

Introduction
China actively promotes the synergistic development of socio-economic and ecological civilizations, continuously enhancing development quality. However, natural ecosystems are generally fragile, with limited ecological and environmental capacities due to resource endowments, historical factors, and development stages [1]. The pressure on ecological protection from economic development remains significant, and advancements in new technologies for ecological protection and the transformation of scientific research are still insufficient [2]. In 2021, the Chinese government issued "The Outline of the 14th Five-Year Plan for Economic and Social Development and Long-Range Objectives Through the Year 2035 of the People’s Republic of China," which targets a fundamental improvement in the ecological environment by 2035 and aims to elevate ecosystem quality and sustainability. Additionally, Xi Jinping, during the 20th National Congress of the Communist Party of China (CPC), emphasized the need to promote green development and enhance ecosystem diversity, stability, and sustainability. The report also highlights the necessity of accelerating the implementation of an innovation-driven strategy, improving technological transformation, and fostering industrialization. It calls for accelerating digital economy development and integrating it with the real economy. Industrial digitalization, green technological innovation, and ecological resilience are crucial elements of the industry-technology-ecology nexus in the socio-economic structure. The synergistic development of these elements is vital for promoting socio-economic sustainability. Therefore, understanding the degree of synergistic development of these components across regions, analyzing regional development differences, and exploring the driving mechanisms behind their synergy is crucial for mitigating regional environmental pressures, transforming industrial structures, and supporting sustainable socio-economic growth.
Resilience reflects the system's or individual's ability to regain resilience from an experience of shock or perturbation [3]. Holling [4] introduces resilience into the ecological field. It is considered that ecological resilience is the degree of perturbation that a natural system can withstand or absorb when faced with both natural and human-induced effects. Ecological resilience is an important indicator of stable and sustainable development of the ecological environment [5], emphasizing that a good ecological environment can reduce the vulnerability of the ecological environment and improve the ability of the system to resist risks and disasters [6]. Current research on ecological resilience mostly focuses on the evaluation perspective. Zhang [7] assessed the ecological resilience of China's ecological functional areas by constructing multi-criteria indicators from macro perspectives. Lee [8] assesses the ecological resilience of Yangtze River midstream cities by constructing a PSR model and analyzing the influencing factors by the spatial Durbin model. Li [9] evaluates the ecological resilience of Chinese cities from the perspective of "Resistance -Adaptation- Resilience" and analyzes regional differences on this basis. Some studies have also been used to analyze how to promote ecological resilience. Ma [10] explores the importance and nonlinear effects of landscape patterns on ecological resilience using random forest regression modeling.
Industrial digitization refers to the support and leadership of the new generation of digital science and technology. To upgrade, transform, and reengineer the whole elements of the upstream and downstream of the industrial chain with data as the key element, value release as the core, and data empowerment as the main line. Technological innovation is inevitably needed to provide impetus to give full play to the supporting role of digital technology in industrial digitization [11]. Industrial digitization can also establish technology clusters and bring about technological cross-fertilization innovation, thus promoting technological innovation [12], speeding up reshaping industrial division of work collaboration, new pattern processes, and promoting the transformation of old and new kinetic energy [13]. It will improve the resource utilization efficiency in the process of industrial development, which will facilitate ecological environment improvement and enhance the ability of environmentally sustainable development. With the proposal promotion and application of the digital economy, industrial digitalization has become a category of hotspot in industrial research. At present, the research on industrial digitalization mainly includes theoretical connotation [14], digital transformation empowerment of related industries [15, 16], and the impact of industrial digitalization on the economic efficiency of enterprises [17, 18]. Some scholars also analyzed the impact of digital transformation on the environment [19, 20].
Green technology innovation can help build an economic system of circular development, provide structural support for the digital economy [21], and promote the coordinated development of industrial digitalization and the ecological environment. Green technological innovation, as a modern technological system in harmony with the ecological environment, has a positive impact on both economic and environmental development. With the proposal of "carbon peak and carbon neutral", the research on green technology innovation focuses on the empirical analysis of carbon trading [22] and green economic development [23]. Chen [24] investigated the dynamic evolution and spatial-temporal patterns of green technological innovation and explored the impact of green technological innovation on carbon intensity by nonlinear spatial Durbin modeling. Chen [25] analyzed the green technology innovation, green finance, and financial development impacts on green total factor productivity in a comprehensive manner.
Existing research confirms quantitative and qualitative relationships between industrial digitization, green technological innovation, and ecological development. However, research about industry digitization, green technology innovation, and ecological resilience is more limited. Based on existing research, data from 30 provinces in China from 2011 to 2021 are selected in this paper for the following innovations: (1) Exploring the degree of synergistic development of industrial digitalization, green technological innovation, and ecological resilience. By measuring the ability of synergistic development of multiple systems in the process of regional development, we analyze the weaknesses of system development in different regions. (2) Analyzing and decomposing regional variability and exploring the quantitative relationship between internal and external regional differences through the Dagoum Gini coefficient. (3) Exploiting the performance of different development factors in the multi-system synergistic development of different regions through spatial econometric modeling. Analyze the differentiation strategies of different regions and study the driving mechanisms that promote the degree of regional synergistic development. The research process of this paper is as follows: Section 2, Data and Methodology, which focuses on the evaluation system, data sources, and methodology used for empirical analysis; Section 3, Empirical analysis; Section 4 discusses the findings of the research; Section 5, Conclusions and recommendations.
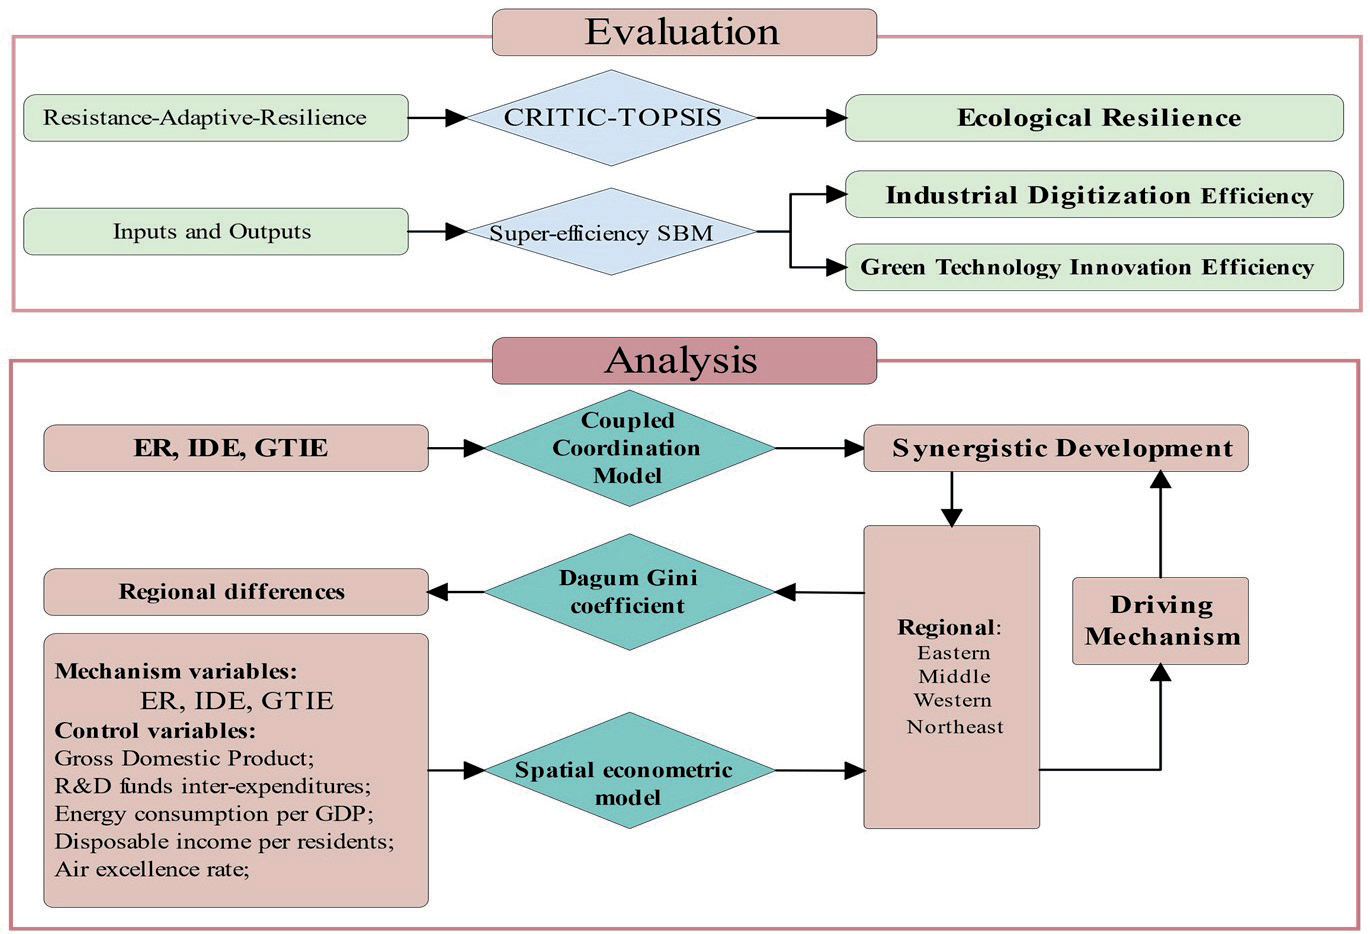
Table 1.
Ecological Resilience Evaluation System.
Data and Methodology
It aims to analyze the synergistic development level and driving mechanism among ecological resilience, industrial digitization, and green technology innovation efficiency for this paper. Eco-resilience is assessed by constructing the "PSR" indicator system. Using Industrial Digitization Efficiency (IDE) and Green Technology Innovation Efficiency (GTIE) to represent the industrial digitization and green technology innovation levels. IDE comprehensively considers the relationship between industrial digitalization infrastructure construction and economic efficiency. GTIE reflects the output capacity of human, capital, and project inputs in the technological innovation process for green technology applications. ER is measured by CRITIC-TOPSIS [26]. IDE, GTIE measured by Super Efficiency SBM [27, 28]. Research framework as shown in Fig. 1.
Ecological Resilience
According to the definition of urban resilience [29], ecological resilience(ER) refers to the ability of ecosystems to adapt, change, and enhance the status quo while maintaining or rapidly restoring desired functions in the face of disturbances. Thus, ecological resilience consists of three main features: resistance, adaptation, and resilience. Resilience represents the ability of ecosystems to withstand external disturbances and is expressed in terms of five indicators: total sulfur dioxide emissions (X11), total chemical oxygen demand (COD) emissions (X12), total smoke (dust) emissions (X13), direct economic losses from natural disasters (X14), and energy consumption per unit of GDP (X15). Resilience indicates the ability of the ecosystem to maintain stability, which mainly includes the urban sewage treatment rate (X21), air quality excellence rate (X22), the comprehensive utilization rate of industrial solid waste (X23), and harmless treatment rate of domestic garbage (X24), and the potential of the ecosystem to recover to the pre-destructive state after being impacted by the impacts, which mainly includes the number of water resources per capita (X31), the green coverage of built-up areas (X32), park green space per capita (X33), and the strength of environmental protection expenditures (X34). (X32), green space per capita (X33), and environmental protection expenditure (X34) (Table 1).
Among the data of X11-X14, X21 is from the China Statistics Yearbook on Environmental (https:/data.cnki. net/yearBook/single?id=N2023070120) issued by China Economic and Social Big Data Research Platform, X15 is from provincial statistical yearbooks, and X22 are from provincial Bulletin of Environmental Condition. X23-X34 data from the China Statistical Yearbook published by the China Statistics Bureau (http://www. stats.gov.cn/sj/ndsj/).
Green Technology Innovation Efficiency
Green technological innovation efficiency (GTIE) is an important indicator of regional technological innovation capacity, and this paper considers the manpower, capital, and innovation activities of different provinces in technological innovation as input indicators and the number of green patents granted as output indicators (Table 2). in which, the number of green patents authorized includes the number of green invention patents authorized and the number of green utility model patents authorized, and the data comes from CNRDS (https:/www.cnrds.com/Home/Login).
Table 3.
Indicator System for Measuring Industrial Digitization Efficience.
Table 4.
Classification of the Coupling Coordination Degree.
Industry Digitization Efficiency
This paper constructs an industrial digitization efficiency measurement system (Table 3). The relationship between industrial digitization infrastructure construction inputs and economic outputs, taking the manpower, equipment, enterprise, and Internet infrastructure construction involved in the process of industrial digitization as the input indicators [30, 31], and the software revenue and e-commerce sales as the output indicators, where the software revenue includes the software product revenue and the software business revenue. Data from the China Statistical Yearbook (http://www.stats.gov.cn/sj/ndsj/).
Coupled Coordination Model
The coupled coordination model describes the interactions between subsystems in a system, accurately reflects the degree of coupling and dynamic changes between related systems, and reflects the coordination effect between systems while capturing the integrated development of related systems [32]. The industrial digitalization development and green technology innovation of socio-economic systems are affected by regional natural resource endowments, and thus there is a certain degree of coupling between ecological resilience, industrial digitalization, and green technology innovation. The IDE, GTIE, and ER coupling coordination degree models are constructed by referring to the way of modification of the traditional coupling degree model by MENG [33]. The model is described as follows:
where Dt denotes the coupling coordination degree (CCD) in year t, categorized according to Table 4, Ct denotes the coupling degree in year t, Tt denotes the coordination degree in year t, and ωiis the weight of system i according to CRITIC. Xit, Xjt denotes the level value of system i,j in year t, and n is the number of systems.
Dagum Gini Coefficient
In terms of analyzing the internal and external differences between different regions in the degree of coupling coordination, according to the geographical division of China, the internal and external differences of different regions are analyzed through the Dagum Gini coefficient, which is an improvement of the traditional Gini coefficient, making up for the shortcomings of other methods used to measure regional disparities due to the failure to address the overlap of the data under investigation and better identifying the sources of regional disparities. The model formula is as follows:
Where G denotes the overall Gini coefficient, which measures the total difference between regions. m denotes the number of regions. ni,nj denote the number of provinces within region i(j), (i,j=1,2, …,m), n denotes the total number of provinces, yih, yir indicates the level of dynamic changes in the CCD of each province, and ȳ denotes the average value of CCD in all provinces.
G can be decomposed into the coefficient of variation within groups Gw, the coefficient of variation between groups Gb, and the coefficient of hypervariable density Gt, which satisfies the relationship G = Gw + Gb +Gt. Among them, Gw denotes the distributional difference within region i, and Gb denotes the distributional difference between regions i, j, and Gt reflecting the effect of the phenomenon of overlap of the regions on the overall Gini coefficient G. The specific coefficient decomposition equation is as follows. The specific coefficient decomposition equations are as follows:
Eq. (5) measures the contribution of differences in the dynamic level of CCD within region i to the total Gini coefficient, where,
Eqs. (7) and (8) measure the contribution of inter-area CCD differences and the intensity of inter-area differences to the total Gini coefficient, respectively. Where Gij denotes the inter-area Gini coefficient, which is calculated by Eq. (9), Dij denotes the relative impact between areas i,j, which is calculated by Eq. (10), and (1-Dij) denotes the hypervariance density.
Where dij, pij denote the difference in CCD between regions i, j. dij can be interpreted as the mathematical expectation of the sum of the sample values of yih-yjr>0 in regions i, j. pij can be regarded as the mathematical expectation of the sum of sample values of yjr-yih >0 in regions i, j.
where, Fi(j)(y)denotes the cumulative distribution function for region i(j).
Spatial Econometric Model
In order to comprehensively consider the coordinated development of industrial digitalization, green technology innovation, and ecological resilience, a spatial econometric regression model containing industrial digitalization, green technology innovation, and ecological resilience is constructed:
where yit is the explanatory variable CCD, y(I,t-1) is the first-order lag, di’Xiδ represents the spatial lag term of the explanatory variable, and di’ is the ith row of the spatial weight matrix w. ui is the spatial effect, γi is the time effect, εit is the error term, β is the coefficient to be assessed, and τ,ρ,δ,λ indicate the parameters of the model determination test, which are passed by the LR, LM, and Hausman tests, A spatial Durbin model if λ = 0, the spatial lag model if λ = δ = 0, and then a spatial lag model if τ = ρ = δ = 0.
Simultaneously, in a bid to determine the applicability of the model, the condition of significant spatial correlation needs to be fulfilled when performing spatial measurements, which is ascertained by means of the global Moran’s index (Morans’ I):
where n is the number of districts, wij means the weight matrix obtained from Eq. (14), and xi refers to the coupling coordination level of the ith district.
Empirical Analysis
Provincial Coupling Coordination Degree
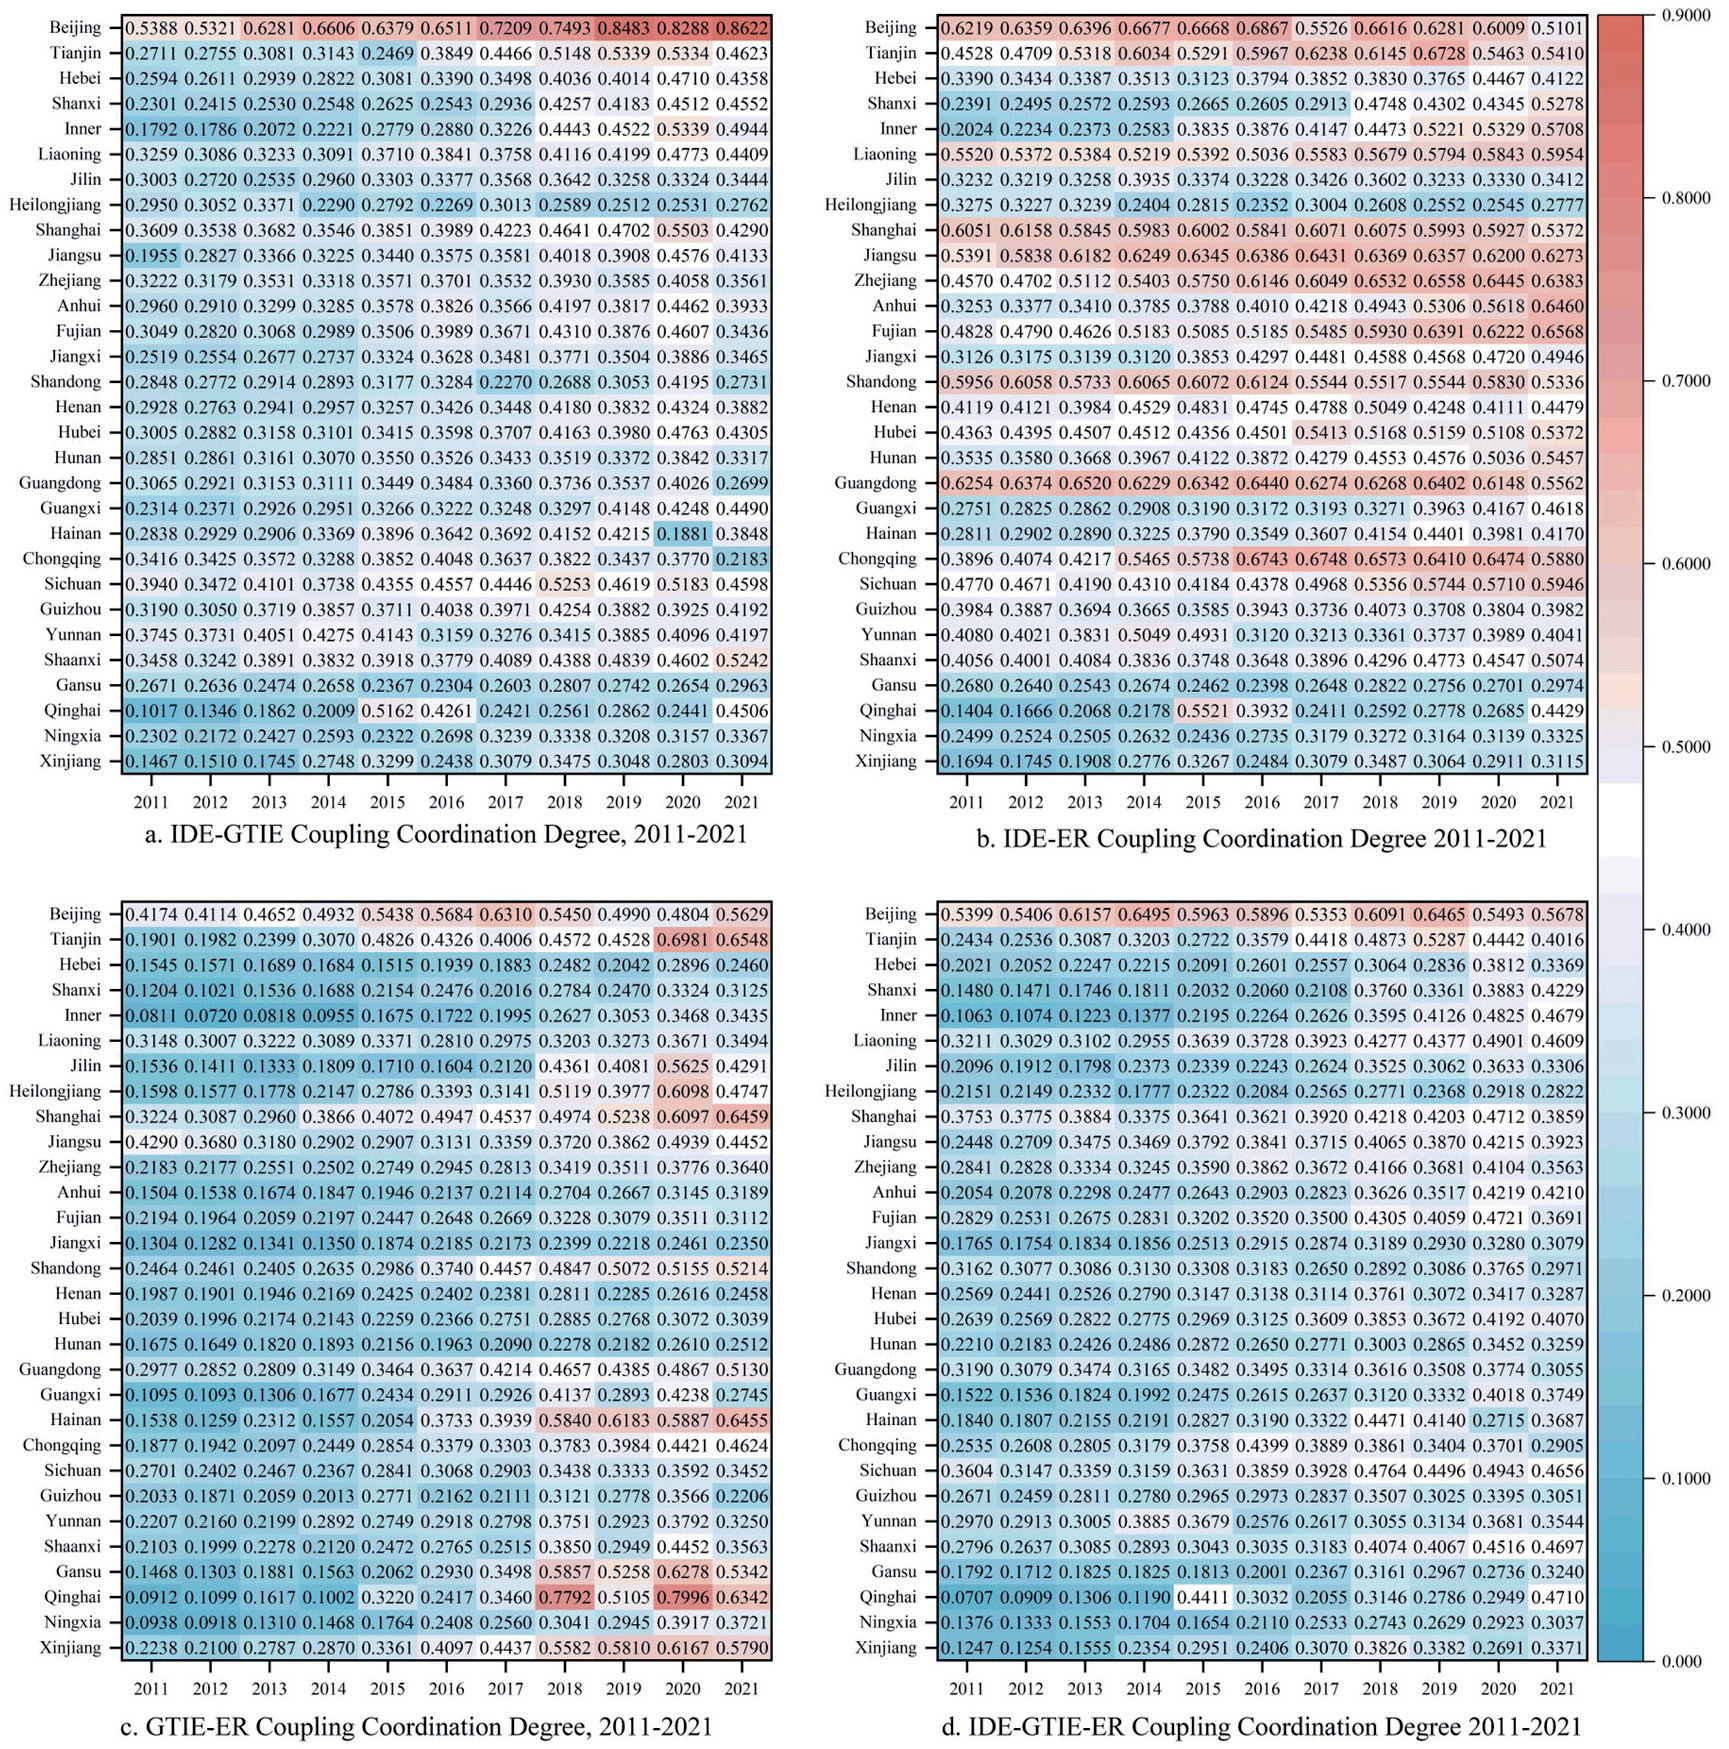
The IDE-GTIE coupling coordination degree (Fig. 2a) measurement results show that all provinces and cities show a steady upward trend during the study period, among which the coupling coordination degree of Beijing is higher, from 0.5388 (barely coordinated) to 0.8623 (good coordinated) during the study period, and the other provinces and cities are from severe disorders, moderate disorders to on the verge of disorders, and quantitatively the results show that, in the process of industrial Chinese provinces, they are committed to moving from energy-driven to technology-driven. At the end of the study period, the coupling coordination of Shandong, Jiangsu, and Guangdong provinces decreased due to the impact of COVID-19.
The overall performance of the IDE-ER system coupling (Fig. 2b) in each province is good, and at the end of the study period, most of the provinces are in the barely coordinated as well as the elementary coordinated stage, but the coupling coordination degree is low in Heilongjiang, Jilin, Gansu, Ningxia, Xinjiang, Yunnan, and Guizhou. Of which, Gansu, Ningxia, and Xinjiang improved from 0.1376 and 0.1247 (severe disorder) to 0.3037.0.3371 (mild disorder) during the study period, showing a good upward trend to a certain extent, but Heilongjiang, Jilin, Yunnan, and Guizhou changed less during the study period, mainly due to the fact that the industrial foundation of these regions is poorer, and the traditional industries account for a relatively large, the level of industrial digitalization development is low, the radiation capacity for the ecological environment is weak, and the degree of interactive coupling influence is low.
In comparison, the coupling coordination of GTIE-ER in each province (Fig. 2c) performed poorly but trended positively, with most of the provinces being in the stage of severe disorder, moderate disorder at the beginning of the study period, and mild disorder at the end of the study period, which indicates that the interaction coupling of GTIE-ER is developing in a benign direction. Among the 30 provinces, GTIE-ER has a high coupling coordination degree in regions with better economic development, such as Beijing, Shanghai, and Shandong, and at both, it also has a high coupling coordination degree in regions with a lower level of economic development, like Gansu, Qinghai, and Xinjiang. It shows that the interactive coupling of green technology innovation and ecological resilience has a "U" trend in the economic perspective, i.e., in the lower stage of economic development, the region based on the local natural conditions of the resources of the traditional industrial economic activities, and thus most of the innovation activities are related to the ecological resources. In the mid-stage of economic development, the industry's dependence on natural resources is weakened, and the green technology innovation activities around the industry also reduce the interactive coupling relationship with the ecology. When economic development reaches a certain level, some of the benefits of industrial development empower the ecological environment, and the innovation activities also strengthen the interactive coupling relationship with the ecology.
According to the measurement results (Fig. 2d), the coupling coordination degree of IDE-GTIE-ER in most of the provinces showed a certain upward tendency, with lower changes in Beijing, Shanghai, Heilongjiang, Shandong, and Guangdong, while the coupling coordination degree of Shandong and Guangdong slightly decreased at the end of the study period due to the COVID-19. In Beijing, the IDE and GTIE both remain high in the study period, while the ER is low, and all three are relatively stable in the study period, so the improvement of the level of coupling coordination degree in Beijing requires the improvement of ecological resilience. Shanghai stays in the stage of mild disorder during the study period. As a more economically developed region in China, it has good economic conditions in industrial digitization and technological innovation, but Shanghai's industry and manufacturing industry account for a lower proportion of the economic system, and the degree of ecological dependence is lower, so the degree of interaction between industrial digitization and green technological innovation and ecological resilience is weaker. Heilongjiang has lower industrial digitalization efficiency and green technology innovation efficiency during the research period, i.e., the utilization rate of industrial digitalization infrastructure and green technology innovation resource inputs in Heilongjiang is relatively low, which is fundamentally due to the poorer foundation of industrial development and fewer modern industries. Shandong and Guangdong show an upward trend in IDE during the study period, and ER maintains the average level in China (0.4024), but the innovation efficiency of GTIE is lower.
In general, the average level of coupled coordination of IDE, GTIE, and ER systems is shown as IDE-ER > IDE-GTIE > IDE- GTIE -ER > GTIE -ER. i.e., in the process of system evolution, the IDE is most closely related to the ER, and China, which mainly focuses on the real economy, has a high degree of relevance to the ecological resources during the process of industrial development, and on the basis of this, an industrial digitization transformation will likewise have a high connection with the ecological environment. In the context of strengthening the construction of ecological civilization, the industrial digitization transformation needs green technology innovation to provide motive power, while the industrial digitization provides direction and platform for green technology innovation, as a result of which IDE has a high interaction effect with GTIE and ER in the process of development, and the synergistic development level of GTIE and ER is the lowest. On the one hand, technological innovation is enterprise-oriented, and even if it is green technological innovation, most of it is green technological research for the improvement of traditional processes, with less technological research and development for the ecological field. On the other hand, technological research and development and popularization have a lagging effect, and green technology has a weaker direct impact on the ecological environment in the premise that it fails to give full play to the benefits of scale. On the one hand, technological innovation is enterprise-oriented, and even if it is green technological innovation, most of it is green technological research for the improvement of traditional processes, with less technological research and development for the ecological field. On the other hand, technological research and development and popularization have a lagging effect, and green technology has a weaker direct impact on the ecological environment in the premise that it fails to give full play to the benefits of scale. The average level of co-evolution of the IDE- GTIE -ER system is higher than that of GTIE -ER, indicating that the industrial system contributes to the improvement in the level of technological and ecosystem co-evolution.
Regional Coupling Coordination Degree
In order to promote coordinated regional development, 30 provinces were divided into four regions according to China's regional planning [40], and the coupling coordination degree of each region was measured (Fig. 3).
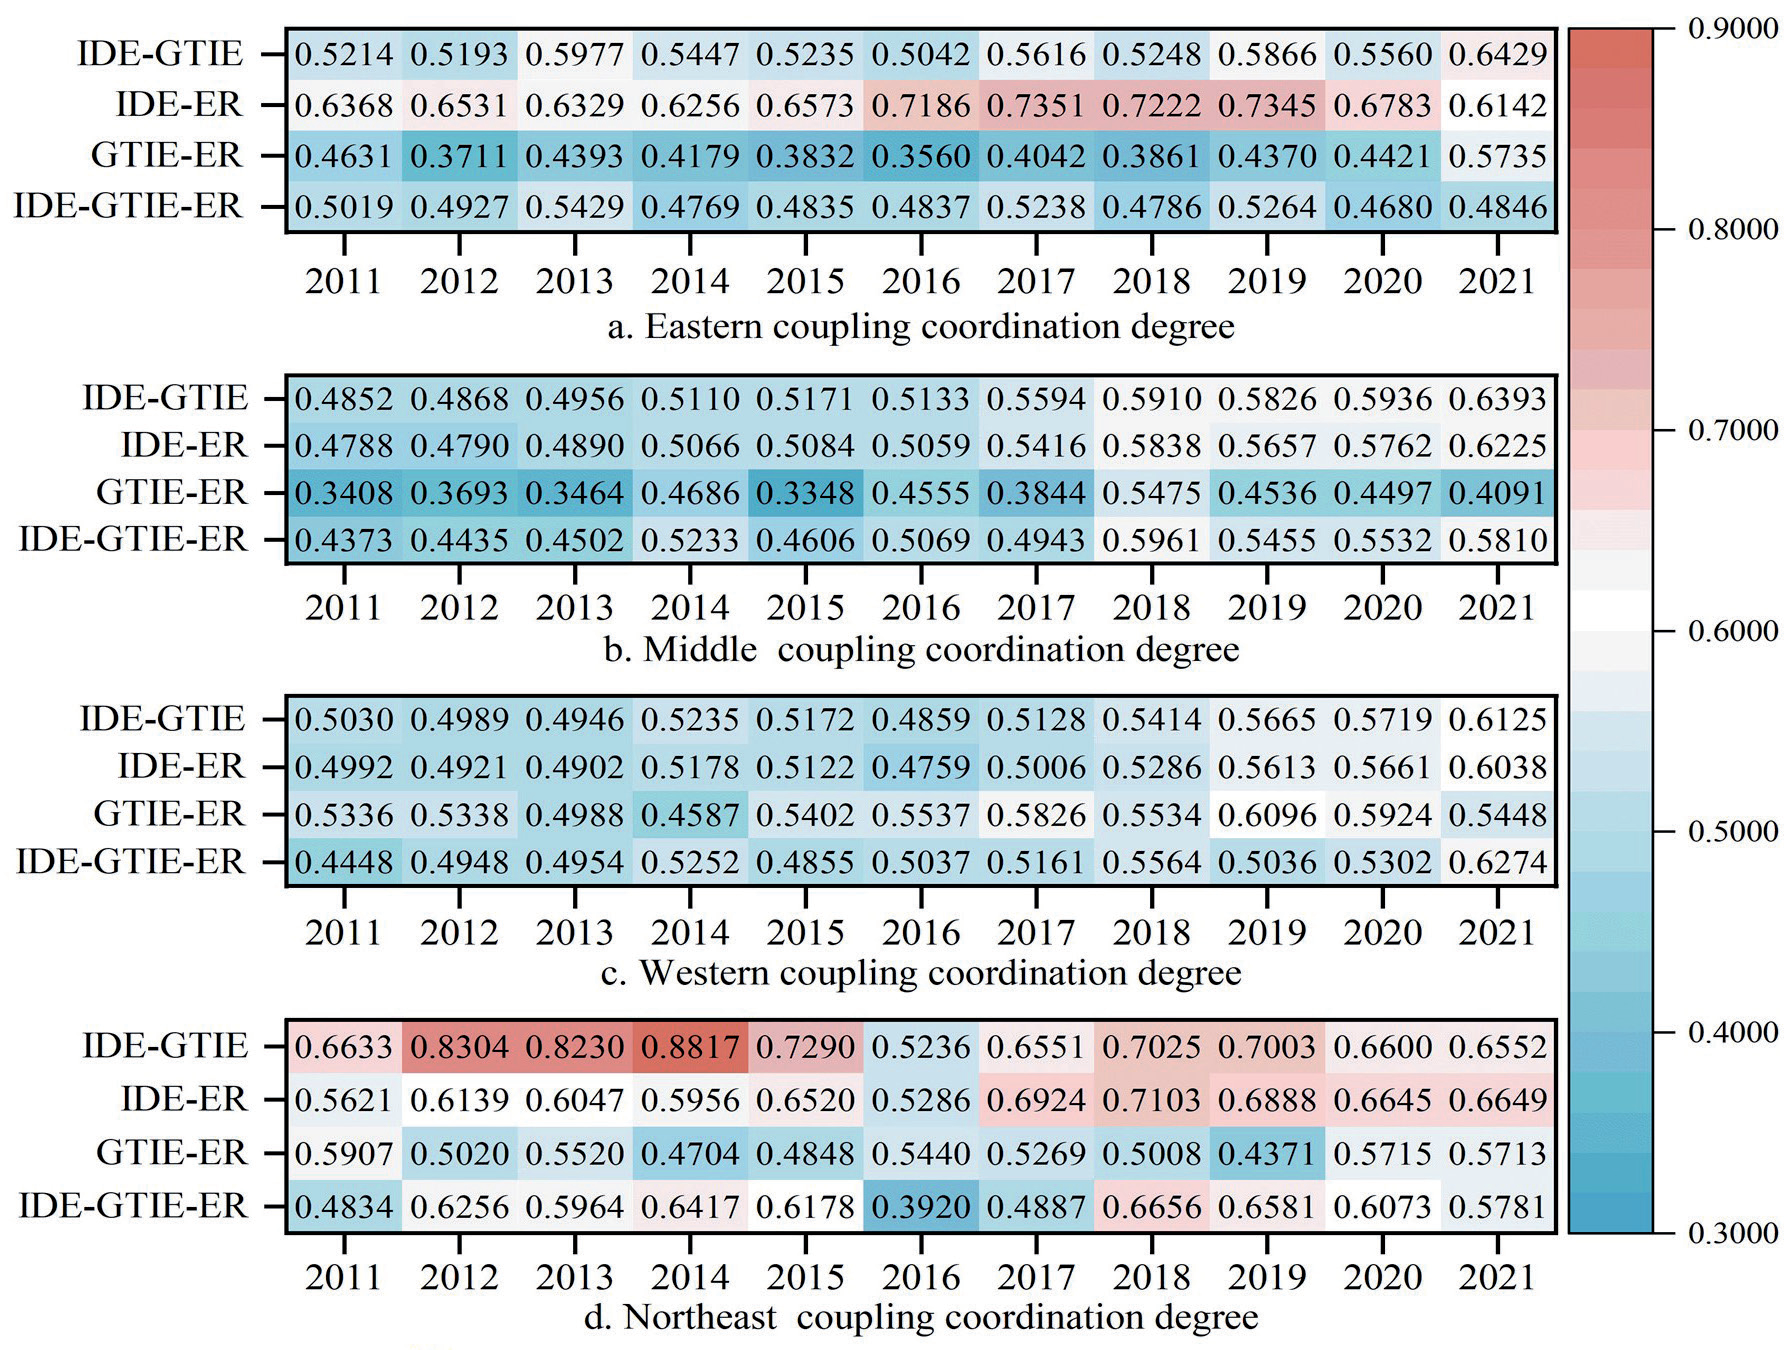
In the research period, the coupling coordination degree of IDE-GTIE-ER in the eastern region (Fig. 3a) fluctuates between the verge of disorder and barely coordination. According to the results of the research on the coupling coordination degree among IDE, GTIE, and ER, the overall stability of IDE-GTIE and IDE-ER is good and the coupling coordination degree is good, while the GTIE-ER coupling degree is low and volatile, with the change interval Between 0.3560-0.5735, which shows that the lower coupling degree in the eastern region is mainly due to the efficiency of technological innovation, mainly due to the fact that although the eastern region has good technological innovation resources, the proportion of green technological innovation patents in the authorized patents is relatively low, which leads to the lower efficiency of green technological innovation.
The coupling coordination degree of the IDE-GTIE-ER system in the middle region shows an upward trend, with an average annual growth rate of 1.31%. According to Fig. 3b, among the coupling coordination degrees of the subsystems in the middle region, the GTIE-ER coupling degree is low, but unlike the eastern region, which faces pressure from factor cost and international competition, the middle region mainly faces the quantitative crude economy, especially in Shanxi, Henan, and Anhui agricultural provinces, where labor-intensive industries occupy a large proportion and the problem of insufficient green innovation endowment is more prominent.
Based on Fig. 3c, the coupling coordination degree of the IDE-GTIE-ER system in the western region shows an upward trend with an average annual growth rate of 1.7%, in which the coupling coordination degree of the IDE- ER subsystem is lower than that of other subsystems. Compared with other regions in China, the western region has poorer conditions for overall economic development, and the industrial structure is mainly dominated by the energy industry and mineral resource extraction and processing industry. Due to environmental constraints, industrial development in the western region is strongly correlated with regional resources, and the level of industrial digitalization is low.
Based on Fig. 3d, the coupling coordination degree of the IDE-GTIE-ER system in northeast China is on the rise overall, but it shows strong instability during the study period. In the early stage of the study, the coupling coordination degree of the system shows fluctuating and rising, in which the IDE-GTIE subsystem shows a significant rise, mainly due to the transformation of northeast China's old industrial zones, and due to the low degree of marketization, in the course of the economic restructuring process, the Need for industrial digitization and green technology innovation together, in the late stage of the study, the coupling coordination degree of IDE-GTIE decreases, and with the proposal of green ecological civilization construction, the industrial development takes ecological factors into account, and the coupling coordination degree of IDE-ER gradually increasing.
From Fig. 3, the coupling coordination degree level of the IDE-GTIE-ER system in each region is slightly higher in the northeast than in other regions, by analyzing the subsystems, while the overall system development level is lower in the East, mainly due to the higher efficiency of industrial digitization in the east and the relatively low green technology innovation and ecological resilience. Subsystems' coupling coordination degree of IDE-GTIE and IDE-ER sub-systems is higher in the northeast and east than in the middle and west, respectively, while gtie -er is higher in the west and northeast than in the east and middle, as shown by results of the subsystems' synergistic development level research. East and northeast have good industrial foundations, with the continuous promotion and optimization of regional coordination development strategy, the sustainability of the economic system has been enhanced, while the digital transformation, green technology innovation, and ecological transformation based on the industrial foundation for the system interaction has been increasing, while the western industrial development foundation is poorer, and the digital construction of the industry is difficult to a certain extent, but the western energy industry has a better heritage, and the green technological innovation has improved energy utilization efficiency and reduced resource depletion, thus reducing environmental pressure to a certain extent. To a certain extent, green technology innovation has improved energy utilization efficiency and reduced resource loss, thus reducing environmental pressure. Middle Region, as an important transportation hub as well as a production base for agricultural products, and an important industrial base for energy and raw materials in China, has a weak urban industrial infrastructure, a relative lack of conditions for green technological innovation on an industrial basis, and a low coupling coordination degree of the system.
Regional Variance Analysis
Due to the estimation results in Fig. 4, the overall difference between IDE, GTIE, and ER in each region Fig. 4d tends to decrease during the study period, but it rises in 2019 and keeps decreasing thereafter, and according to the decomposition of the differences, the main reason for the overall increase in the differences in 2019 is due to the increase in the differences between the groups.
By comparing the overall differences in the coupling degree coordination of the subsystems (Fig. 4a,b,c), the overall differences in the IDE-GTIE subsystems were maintained in the range of 0.11-0.15 during the study period, and the results of the difference decomposition showed that the contributions of the inter-group differences, intra-group differences, and hyperdensity differences to the overall differences were more evenly distributed, basically maintained in the range of 0.3- 0.7. The IDE-ER subsystems showed a decreasing trend during the study period, mainly because the intergroup differences decreased continuously during the study period. The study period showed a decreasing trend, mainly due to the fact that the between-group differences were decreasing during the study period. The overall differences of the GTIE-ER subsystem basically remain stable during the study period, and unlike the IDE-GTIE subsystem, the overall differences of the GTIE-ER subsystem are mainly affected by the changes in the differences between groups. Through the spatial distribution, the intergroup differences of IDE, GTIE, and ER synergistic development are mainly realized as the differences between the eastern region and the northeastern and western regions, and according to the coefficients of differences of each subsystem, the overall differences of the synergistic development of the subsystems are mainly originated from the intergroup differences.
Fig. 4.
Decomposition results of regional differences in the coupling coordination degree of the system.
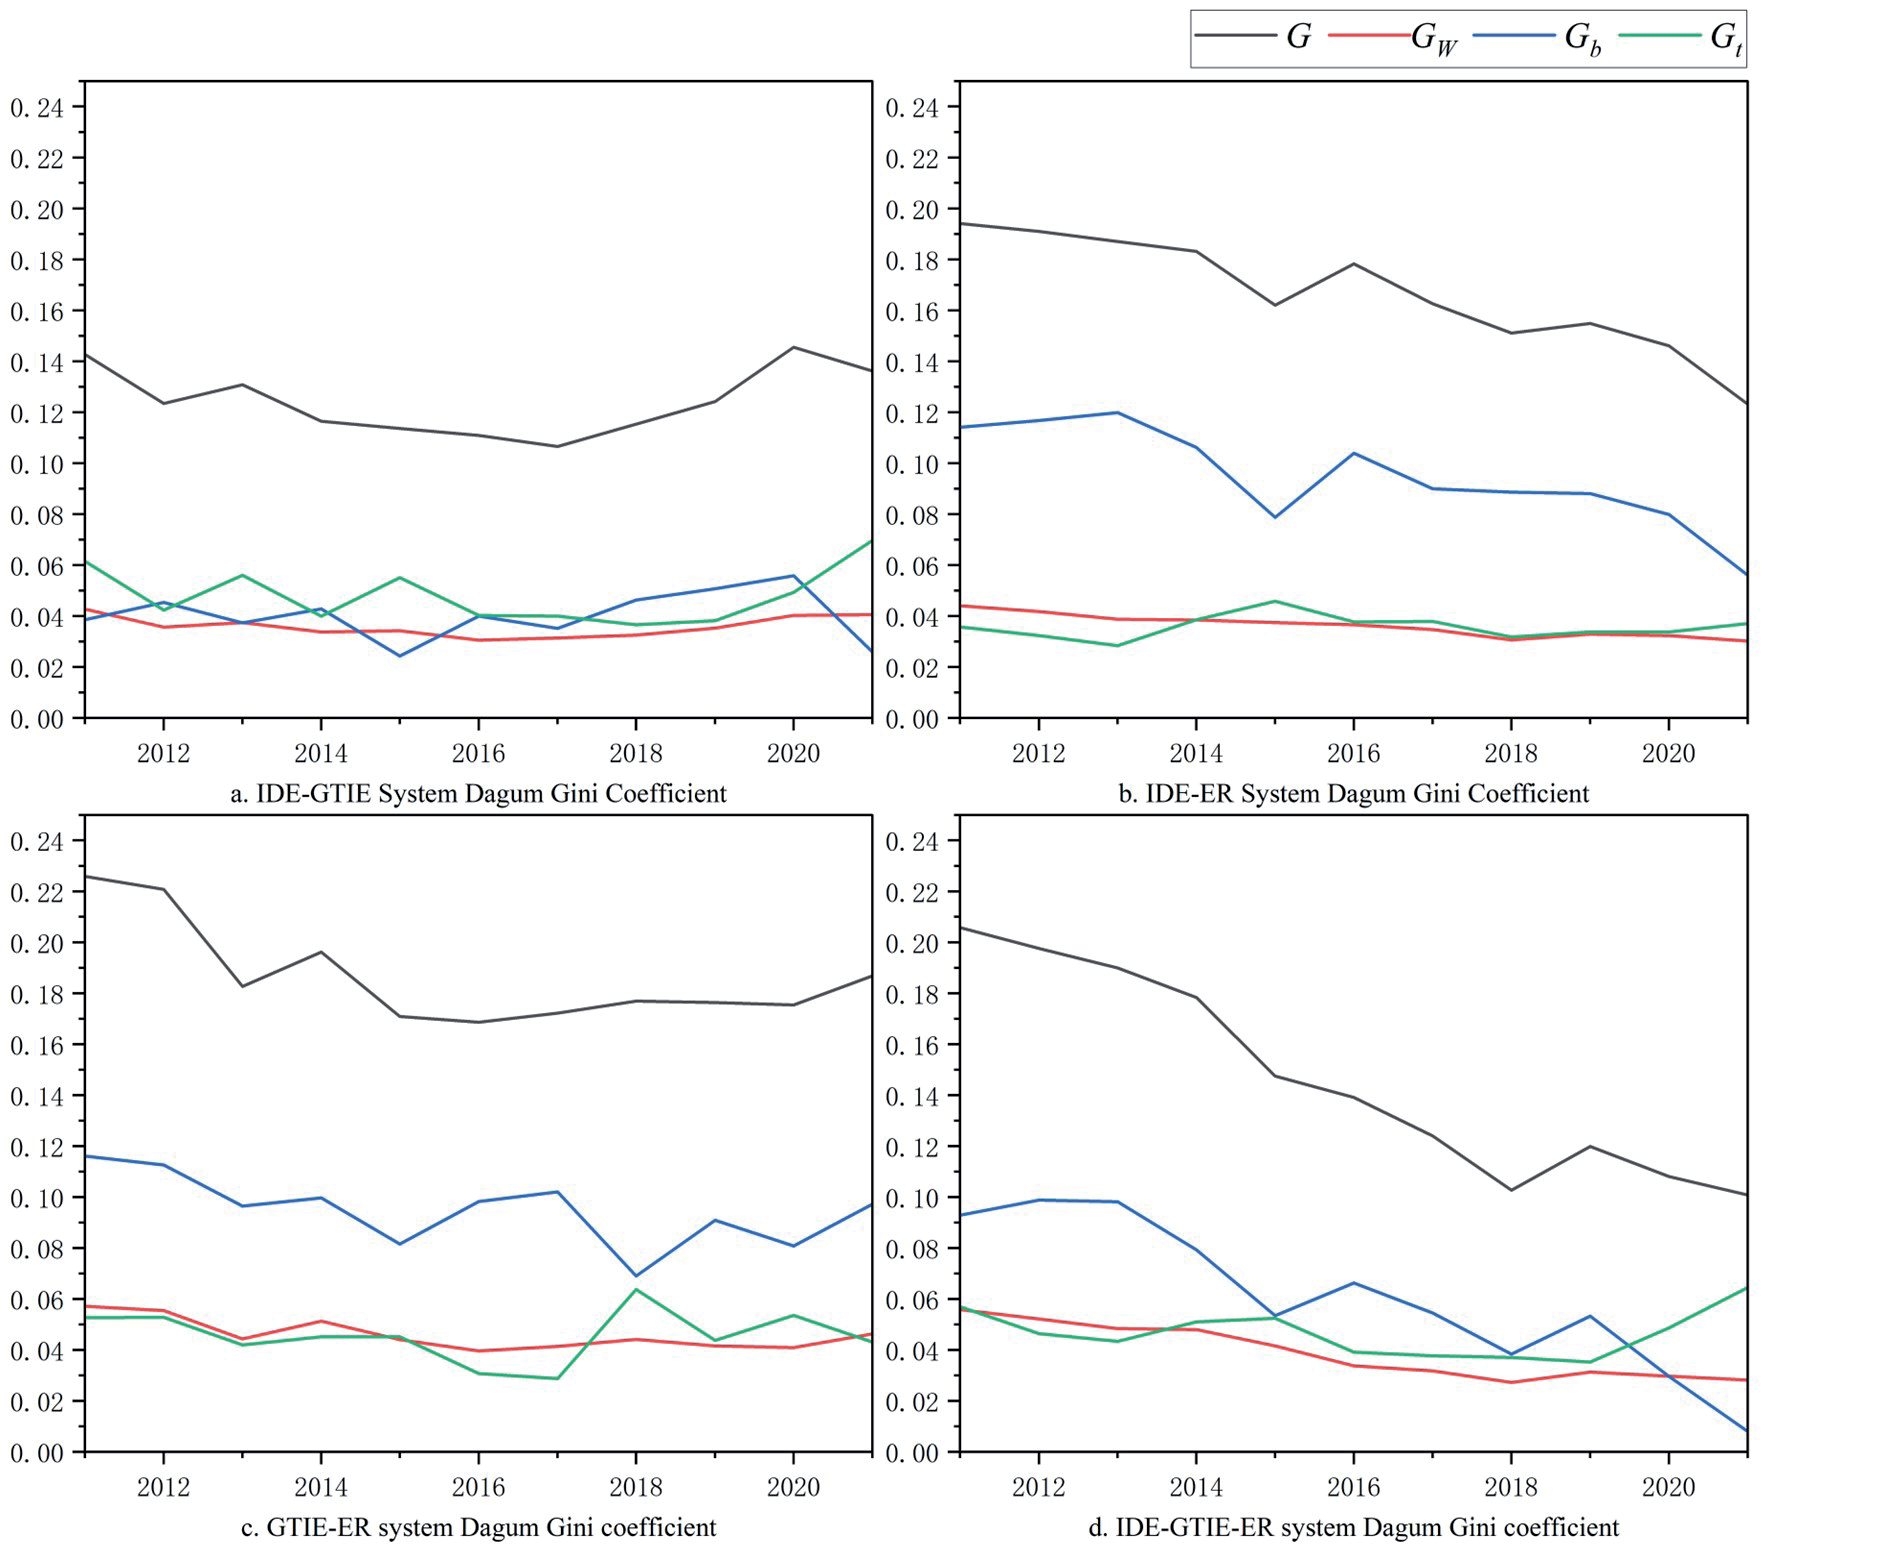
It can be seen from the comparison that the overall differences in synergistic development of IDE, GTIE, and ER mainly originated from intergroup differences, while in the process of synergistic development, in the trend of change by the IDE-ER intergroup differences in the role of the greater influence, while IDE-GTIE and GTIE-ER to a certain extent to maintain the IDE, GTIE, and ER synergistic development of the stability of the IDE, GTIE, and ER, in particular, by the intergroup differences between the GTIE-ER. The effect of the difference was more influential.
Mechanism Analysis
Variable Selection
Explained Variables. The coupling coordination degree reflects the level of IDE-GTIE-ER system synergistic development. From the results, in 2011, most of the provinces in the country were located below 0.5, and the system development shows a disorder between the systems. With the increasing emphasis on the coordinated development of the different systems, during the study period, most of the provinces of the DE-GTIE-ER system synergistic development shows a better upward trend.
Mechanism variables. Industrial digitalization efficiency, green technology innovation efficiency, and ecological resilience are selected as mechanism variables to explore the mechanism of different degrees of system development on the overall synergistic development.
Control variables. The Outline puts forward the main indicators of economic and social development in the 14th Five-Year Plan, based on economic development, innovation drive, people's well-being, and green ecology. The selected control variables include: (1) Gross Domestic Product (GDP): GDP reflects the final results of production activities in different provinces during a certain period of time. (2) Internal Expenditures on R&D Funds, which reflect the actual expenditures used by the surveyed units to carry out R&D activities internally. According to different sources, this paper categorizes the internal expenditure of R&D funds into government funds (Gov) and enterprise funds (Expenditure) Data from China Science and Technology Statistical Yearbook (https://data.cnki.net/yearBook/ single?id=N2023030111). (3) Energy consumption per GDP (Energy), (4) Disposable income per resident (Income), (5) Air excellence rate (Air).
Model Selection
To ensure the consistency of model selection across regions, the global spatial autocorrelation coefficients of each province were measured using Stata17 software. The Moran I measurements [0.069, 0.278] are between and significant, indicating that spatial correlation exists between regions. On this basis, the LM test shows that the spatial error model is insignificant and the spatial lag model is significant. The Hausman test shows that the fixed effects are significant, and the LR test shows that the double fixed effects are better than the single fixed effects. Therefore, this paper chooses the spatio-temporal double-fixed spatial lag model as the mechanism analysis model.
Regression Results
The results of the spatial double fixed-effects spatial lag model measurements for each region in China are shown in Table 5.
Eastern region regression results show that the influence coefficient of a single system shows negative influence at the significance level, while the influence of an interacting system is positive, and the influence relationship is in the order of GTIE×ER (3.2164) > ER×IDE (1.311) > IDE×GTIE (0.0806). It can be seen that the interaction effects of GTIE, IDE, and ER are much larger than the interaction effects of GTIE and IDE. This is mainly due to the relatively better development of high-tech industries in the eastern region, which possesses certain resources and technologies for green technology innovation and industrial digital transformation. The investment in ecological resilience construction is relatively weak, while the industrial digital transformation efficiency is better than the green technology innovation efficiency. Therefore, green technology innovation efficiency is superior to green technology innovation efficiency. At the same time, industrial digital transformation efficiency is better than green technology innovation efficiency. Therefore, the joint effect of green technology innovation efficiency and ecological resilience is stronger than other types of system interactions.
Mid-region regression results show that the effects of IDE and GTIE on the overall level of synergistic development are 0.7342 and 1.5657, respectively, and are significant. Meanwhile, the interaction test results show that only the interaction between GTIE and ER is significant. The linear effect coefficients of GTIE and ER are greater than the one-way effect coefficients when significance is valid. That is, the influence relationship is shown as GTIE+ER>GTIE×ER>GTIE,ER, presenting a two-factor nonlinear enhancement trend [34]. Results from the regression show that improving the efficiency of green technology innovation and strengthening the application of green technology in the construction of ecological resilience can help to enhance the level of regional synergistic development. On the one hand, compared with the eastern region, the central region's industrial digital foundation is relatively weak, but its natural resource endowment is not weaker than that of the eastern region, and green technological innovation has a certain application space, while green technological innovation has a certain knowledge spillover effect [35]. On the other hand, the central region, as a region more closely linked to the east, will also be affected by the eastern region. Therefore, strengthening the construction of green technology innovation infrastructure in the central region and improving the efficiency of green technology innovation can help to enhance the level of regional synergistic development.
Table 5.
Spatio-temporal double-fixed spatial lag model Regression Results.
Fig. 5.
Synergistic development theory analysis for the synergistic evolution of industrial digitalization, green technology innovation and ecological resilience.
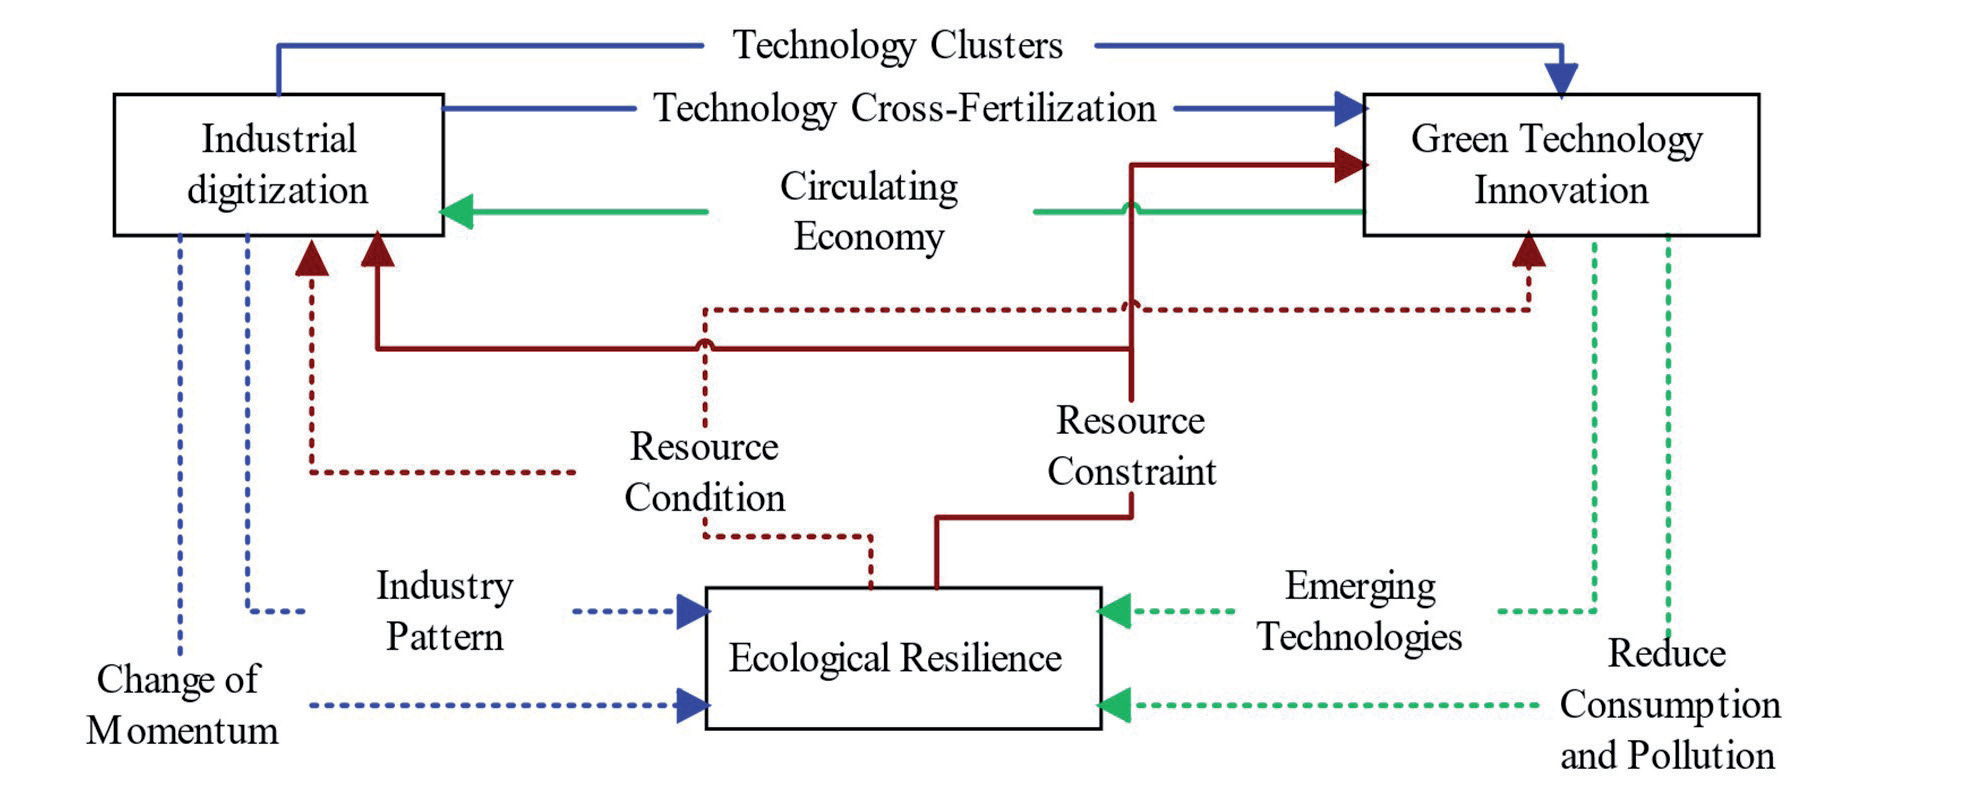
Fig. 6.
Driving mechanism for synergistic development of industrial digitization, green technology innovation, and ecological resilience.
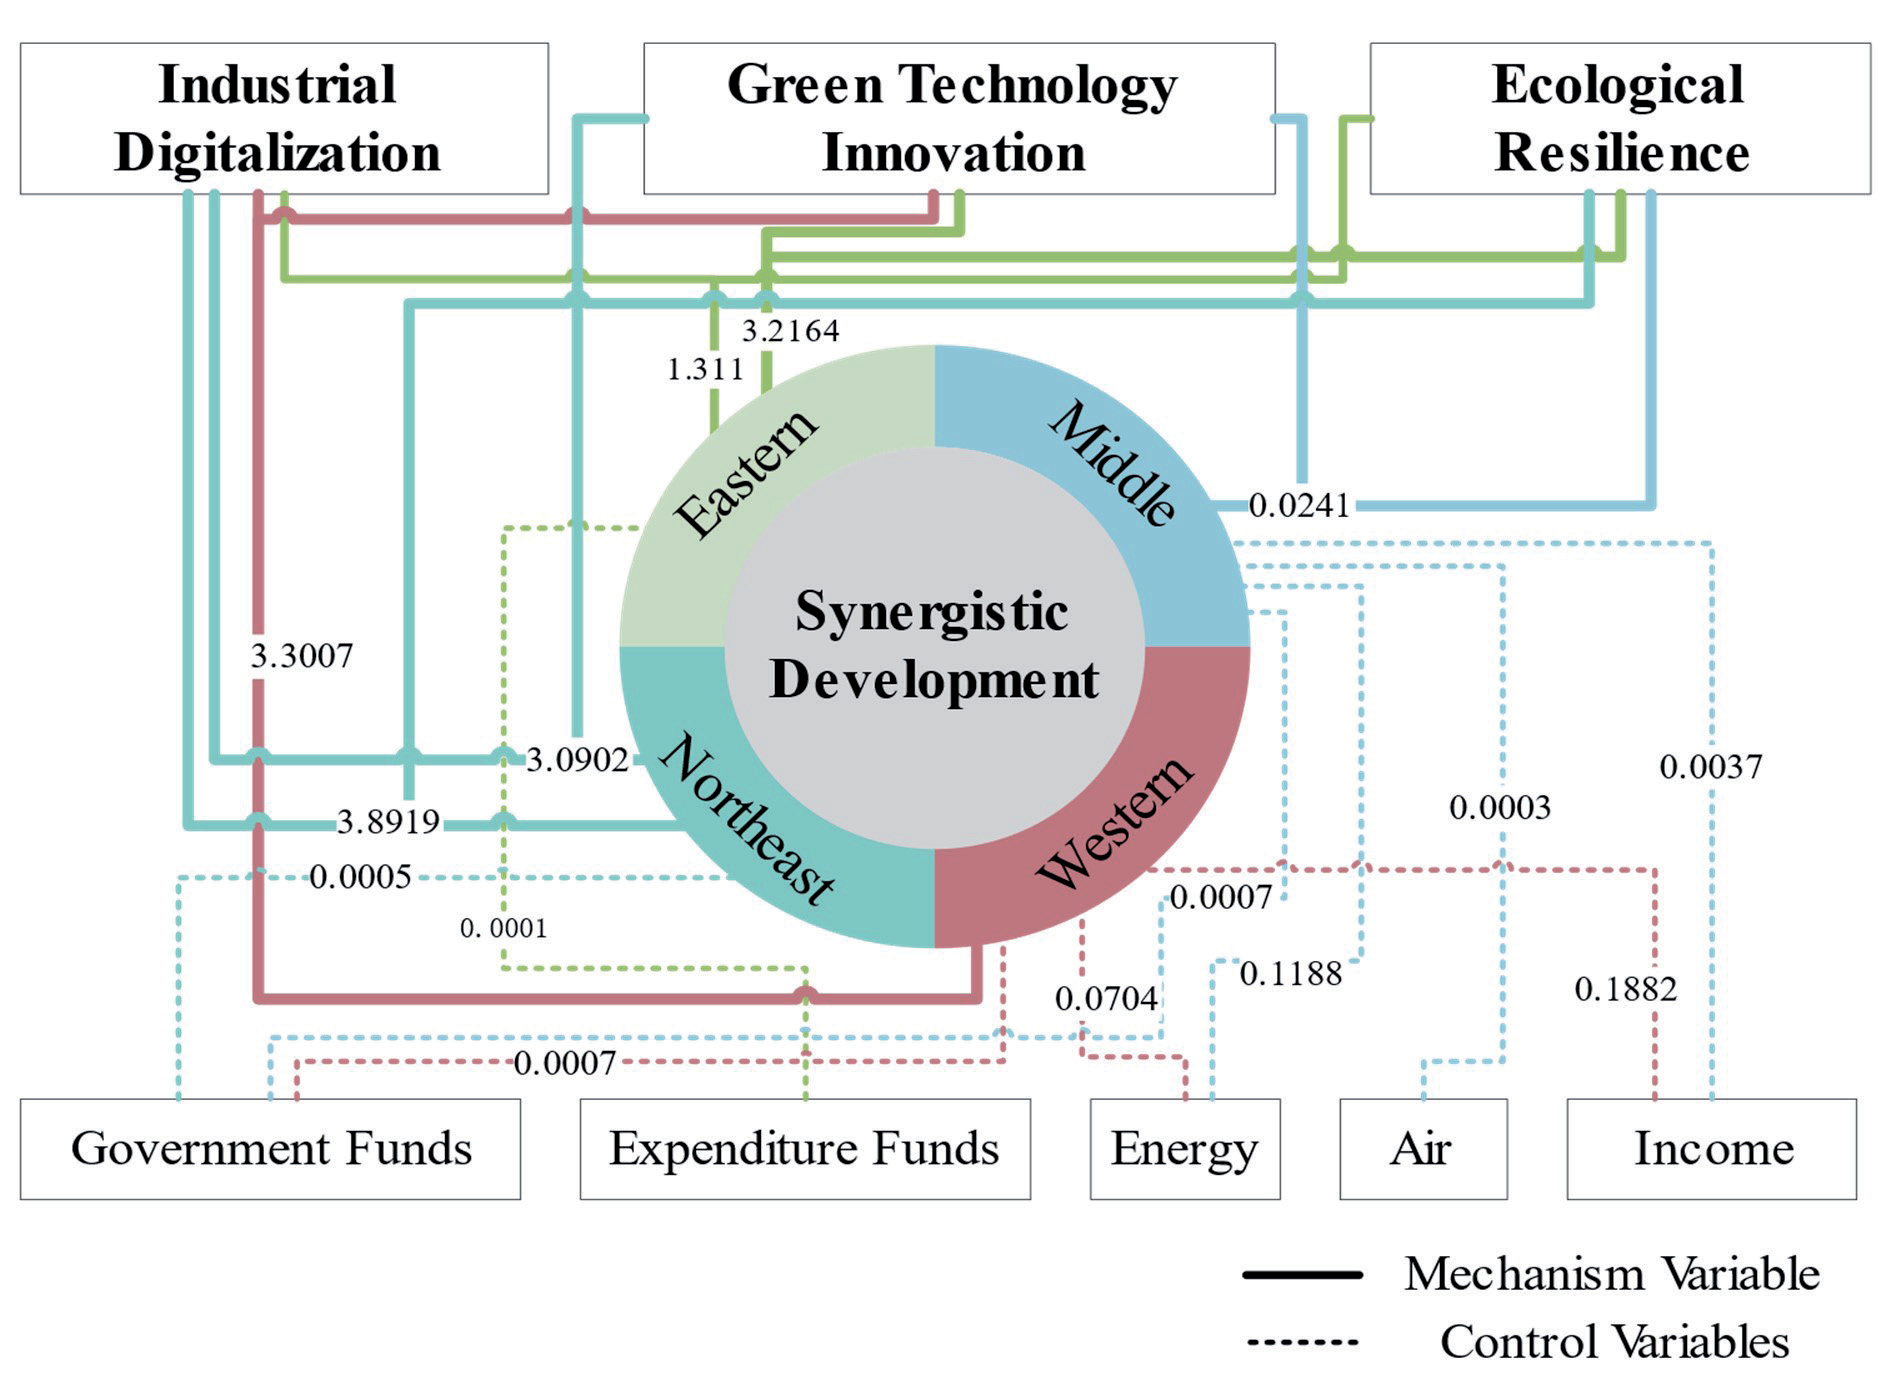
Western region's measurement results show that there is a significant positive effect of one-way regression results of IDE and GTIE. According to the results of the interaction test, only the interaction effect of GTIE × IDE shows obvious significance, while in the relationship of the influence coefficient, GTIE × IDE > GTIE,IDE, shows a two-factor enhancement trend. From the measurement results, the western region is more affected by the interaction effect of GTIE and IDE. Unlike the eastern region, the average level of GTIE and IDE in the western region is lower than that in the eastern region, while the level of ER is not much different, so the marginal contribution of the enhancement of GTIE and IDE to regional synergistic development is much larger than that of the eastern region and the contribution of ER to the western region.
The northeast region's regression results show that only IDE has a positive effect on the overall synergy development level at the 1% significance level in the one-way regression. According to the interaction test, IDE×GTIE and ER×IDE both show positive influence effects on the overall synergistic development and at the same time show a two-factor enhancement trend in the quantitative relationship. GTIE×ER has a significant negative effect, but GTIE+ER shows a positive effect at the 1% level of significance, which suggests that the IDE plays a major role in the synergistic development of the system in the Northeast region, whereas the linear regression results of GTIE and ER indicate that the IDE plays a major role in the systematic synergistic development. GTIE, ER linear combination can also promote system development, but the influence role is lower than the mutual interaction with IDE, that is, ER * IDE>IDE*GTIE>GTIE+ER confirmed the results of the one-way test.
Discussion
Industrial digitalization, green technology innovation, and ecological resilience in the process of synergistic evolution Fig. 5. Industrial digitization has an impact on green technology innovation and ecological resilience by triggering technology integration [36] and industrial division of labor [37]. Green technology innovation helps to build a circular economy system and has an impact on factors such as technology and energy utilization [38], thus affecting industrial digitization and ecological resilience. Excellent ecological resilience can provide resource conditions for industrial development and technological innovation [39, 40], and poor ecological resilience can force technological reform and industrial restructuring [41].
A coupled coordination model was used to measure the level of synergistic development of industrial digitalization, green technological innovation, and ecological resilience in 30 provinces in China, based on the results of the measurements. As the complexity of the system increases, the difficulty of coordinating the development of the system increases, and at the same time, due to the traditional economic structure, which makes the industry closely linked to multiple systems. The direct role between the subsystems linked to the development of the industry is small, so the digitalization of the industry in the overall system plays a moderating role in the link between green technological innovation and ecological resilience.
The Dagum Gini coefficient results indicate that differences in the synergistic development levels of industrial digitization, green technological innovation, and ecological resilience among regions have decreased year by year. The decline in overall systematic differences is primarily due to the decreasing disparities in industrial digitization and ecological resilience subsystems, while differences in other sub-systems have remained stable.
An econometric model exploring the synergistic development mechanism of industrial digitization, green technology innovation, and ecological resilience (Fig. 6) reveals that the main driver in the eastern region is GTI×ER, with ER×IDE as a secondary factor. In the central region, the driver is GTI×ER. In the western region, the driver is GTI×IDE, and in the northeastern region, the main driver is ER×IDE, with GTI×IDE as a secondary factor. The research shows that single factors have a weak role in driving the system; instead, the interactions of different systems and the flow of factors are more significant due to the diversification of the socio-economic structure. Among the control variables, GDP as a social development goal does not show a notable effect, while energy utilization efficiency, residents' disposable income, and internal government R&D expenditure have a more significant impact across regions.
Conclusion and Suggestion
A coupling coordination degree model, Dagum's Gini coefficient, and a spatial measurement model are used in this paper to explore the level of synergistic development, regional differences, and driving mechanisms of industrial digitization, green technological innovation, and ecological resilience in 30 provinces in China. The main findings are as follows:
(1) At the provincial level, the overall coupling degree of most provinces lies between mildly disordered and on the verge of disorder, and only Beijing lies at the level of barely coordinated. At the regional level, the overall system coupling coordination degree of the four regions lies between the verge of disorder and elementary coordination. In the quantitative relationship manifested as Northeast > Western > Middle > Eastern. The correlation between the overall system and the subsystems is shown as ID-ER>ID- GTI >iD-ER- GTI>GTI-ER.
(2) In general, the Gini coefficient decreased from 0.2058 to 0.1008 during the research period; among the sub-systems, the Gini coefficient of the GTI-ER subsystem was located between [0.2260, 0.1868] with a large variance during the research period; the ID-GTI subsystem was located between [0.1428, 0.1362], which basically remained stable; and the Gini coefficient of the ID-ER subsystem decreased from 0.1941 to 0.1233.
(3) By applying the econometric model to explore the synergistic development mechanism of industrial digitization, green technological innovation, and ecological resilience in different regions, the research results show that the driving factor in the eastern region is mainly GTI×ER, with ER×IDE as a secondary factor, in the central region, GTI×ER, in the western region, and in the northeast region, the main driver is ER×IDE, with GTI×IDE as a secondary factor, while energy use efficiency and internal expenditure of government R&D funds have a more significant impact on each region. and GTI×IDE as a secondary factor in the northeast region, while energy utilization efficiency, disposable income of residents, and internal expenditure of government R&D funds have a more significant effect on each region.
Based on the research results, in the synergistic development process of industrial digitization, green technology innovation, and ecological resilience, the following problems mainly exist: (1) The green technology innovation level is generally low in all regions, and inadequate attention has been paid to technology research and development. (2) Under-utilization of green technology innovations in the ecological resources domain. (3) Limited capacity building for inter-regional resource factor exchanges.
In response to these issues, this paper makes the following suggestions:
(1) Increase the government's investment in R&D funds and give play to the government's leading capacity. In the structure of a multi-party technological innovation system, enterprises play a major role as the main body of technological innovation. However, in China's market structure system, the government has a significant guiding role, and it is important to increase the government's R&D funding for green technology innovation, especially in the middle, western, and northeastern regions. On the one hand, it helps to carry out green technology research and development for different regional industrial structures, and on the other hand, it helps to guide multiple actors to increase their attention to green technology innovation and to increase the research and development of green technology and its application in different fields.
(2) Enhance the application of green technological innovation in the energy sector and give full play to the spillover effect of green technological innovation. Energy utilization efficiency is a binding indicator for social and economic development, and the application of green technology in the energy field can help improve energy utilization efficiency, but there are big differences in China's regional energy structure, so the application of green technological innovation in different regions should be different. In the eastern and northeastern regions, the main purpose is to reduce the loss of energy downstream of the industrial chain, while in the central region, the main purpose is to increase the efficiency of energy utilization of water resources, mineral resources, etc. In the western region, there is a lack of an industrial base for the deep processing of ore energy, but abundant renewable resources such as light energy and wind energy, so the green technological innovation in the western region can consider the recycling and storage of these renewable resources.
(3) Accelerating industrial digital transformation and enhancing regional factor exchange capacity. With the continuous development of the digital economy and the in-depth promotion of industrial digital transformation, the infrastructure of industrial digitalization in various regions has been continuously improved, but there is a lack of industrial digitalization in the depth of industrial application in different regions, and most of the industrial digitalization is based on the industrial manufacturing industry, with an insufficient degree of extension to the upstream supply chain and downstream service industry; therefore, it is necessary to accelerate the application of industrial digitalization to the upstream supply chain, and to strengthen the different regional resource exchange, taking into account the downstream service industry on this basis, and gradually going deeper, so as to perfect the whole industry chain transformation of industrial digitalization.

