

Introduction
Excessive greenhouse gas emissions have led to increasing global warming concerns worldwide. In 2020, China announced its commitment to enhance its autonomous contribution towards achieving the ambitious goals of carbon peaking by 2030 and carbon neutrality by 2060. To effectively manage carbon emissions, the government has deployed direct regulatory measures to eliminate and control outdated industries while promoting the development of modern high-tech and service industries [1]. Despite being in the middle to late stages of industrialization and urbanization, China is expected to maintain high economic growth rates. However, this growth will rely heavily on energy-intensive industries and require significant infrastructure development, leading to high carbon emissions and intensity [2, 3]. This means China is still has a tough road to travel to reduce CE. Moreover, under China’s centralized political and decentralized financial system, the performance appraisal mechanism focusing on economic growth has led to varying degrees of competition among local governments to attract capital [4], even at the expense of the environment, to attract high-polluting industries, exacerbating environmental pollution and CE [1, 5].
In the context of local government competition for capital (GCC), land as an important factor of production in the process of urban economic development, and the government being the monopolist of the land supply market, land concessions have become a magic weapon for local governments to attract capital [6]. Localities engage in bottom-line competition that undermines social welfare through the use of land concessions, such as competing to expand the scale of industrial land offerings, reducing the price of land concessions, and reducing the quality of capital attraction. Local governments attract low-quality industrial enterprises by adopting a land supply strategy of cheaply granting industrial land and high-priced commercial land, which can drive fiscal revenue and rough economic growth [7]. But land resource misallocation (LRM) will lead to spreading expansion, idle waste, and inefficient use of industrial land, increasing industrial pollution [8]. Therefore, land resources should be rationally allocated to curb the expansion of high-energy-consuming industries and promote low-carbon economic transformation to achieve the goal of green development. Local economic recovery pressure increased, especially after the economy was hit by COVID-19. The need to achieve energy conservation and emission reduction through local governments’ changing development concepts and rational allocation of land resources has become more urgent. Therefore, what mechanisms do GCC and LRM employ to affect CE? This is a theoretical and practical issue that needs to be studied further. Therefore, in the context of promoting the market allocation of land elements, combating pollution, and supporting efforts towards carbon peaking and neutrality, it is significant that this paper integrates GCC, LRM, and CE within a comprehensive framework for research.
The contributions are as follows: First, this paper incorporates GCC, LRM, and CE into the same framework to examine the direct impact of GCC on CE and the indirect impact through LRM under spatial association. Second, most of the relevant studies have used a single equation to examine GCC, LRM, and CE, which can lead to some endogeneity bias in the measurement results. This paper controls for endogeneity between LRM and CE by using the GS3SLS model while introducing spatial lag terms for GCC and LRM to examine the relationship between GCC, LRM, and CE at the spatial level more comprehensively. This study will provide practical action plans for rational land concessions and synergistic carbon emission control between neighboring regions. Finally, this study further explores the relationship among GCC, LRM, and CE from the perspective of improving the appraisal system for officials. This can provide an empirical reference for the government to improve the performance appraisal system and avoid the behavior of sacrificing the environment to achieve economic growth.
This paper takes 30 provinces in China from 2008- 2020 as the study subjects and examines the complex effects between GCC, LRM, and CE by constructing spatial panel simultaneous equations. This paper theoretically analyzes the impact of GCC on CE from a spatial perspective and the mediating role played by LRM. Then, the paper empirically tests the spatial impact of GCC on CE and the mediating role played by LRM using the GS3SLS econometric model. The results show that competition for capital between local and neighboring governments not only directly increases local CE but also indirectly contributes to local CE by encouraging LRM. And we further explored that the phenomenon of GCC has slowed down after the ecological civilization construction is incorporated into the officials’ assessment system, which can directly reduce CE. However, GCC will also indirectly increase CE by exacerbating LRM.
Literature Review
Government competition refers to the strategic interaction of governments in adopting tax and environmental policies to attract labor, capital, and other mobile factors to enhance their competitive advantage. The impact of government competition on CE is developed in two main ways. One is that competition among local governments exacerbates environmental pollution through taxation, environmental policies, and other means. Government competition for capital attraction may be an important reason for the existence of the green paradox in local development [9]. Local governments tend to adopt lax environmental regulatory policies to broaden the tax base and increase tax revenue to enhance their competitive advantage in economic competition [10]. Fredriksson and Millimet (2002) found that the environmental regulatory policies adopted by neighboring regions were closely related to the local level of energy conservation and emission reduction [11]. Chirinko and Wilson (2017) conducted additional research on inter-regional pollution management and discovered that neighboring regions adopted a seesaw strategy in environmental management [12]. In addition, capital flows were also found to be an important mechanism by which government tax competition affects sustainable development [13]. Xu et al. (2023) argued that government competition not only directly inhibits low-carbon development, but also reduces the role of green technological innovations as a driver of low-carbon transitions [14]. Nonetheless, some scholars have found that local adoption of tax competition can also be advantageous in mitigating CE. Woods and Potoski (2010) suggested that when the government increased pollution control, local governments would consider the needs of residents for the environment while promoting economic growth, and thus the phenomenon of competition by the top would be detrimental to green development [15]. Eichner (2018) also argued that local government competition raises environmental regulation standards and facilitates inter-regional environmental quality improvement [16]. Liu et al. (2022) found that although local government competition exacerbates carbon emissions, under the constraints of environmental regulations, governments ultimately opt for positive competition [17]. The other one is land. As the largest resource owned by local governments, it is also an important competitive tool in the competition for capital inflows at the local level [18]. Some scholars analyzed the asset properties of land, such as Han and Kung (2015), who found that increased competitive pressure between regions would attract the inflow of manufacturing industries with higher mobility by adopting land agreements for concessions to bridge the fiscal gap, but a large inflow of manufacturing industries would cause an increase in pollution emissions [19]. Wang and Zhang (2022) observed that as the fiscal pressure on local governments intensified, the spatial competition among regions by local governments increased via the low-priced sale of industrial land [20]. In particular, less competitive regions lack the necessary elements to draw high-end industries, and as a result, they resort to offering cheap land concessions that attract more low-end and polluting industries [21]. This, in turn, exacerbates local ecological degradation. In addition, some scholars also analyzed the productive attributes of land; Liu et al. (2021) suggested that local officials were influenced not only by financial incentives but also by performance incentives [22]. They experienced pressure from performance assessments and were motivated to offer land concessions to stand out in the competition for attracting land rather than to generate revenue from selling the land. This competition was driven by the desire to achieve better performance scores. And there was bottom-line competition when local governments used land concessions to attract capital [23]. That is, local officials focused more on the scale than the quality of land, which leads to manufacturing overdevelopment and serious overcapacity [24].
Land resources have social, economic, and ecological functions, and activities such as urban sprawl and energy consumption are closely related to land resource use, while the economic development process often tends to neglect the ecological functions of land and aggravate carbon dioxide emissions [25]. The research on the impact of land resource allocation on environmental pollution has been conducted in two main aspects: First, regarding land resource use conversion, the accelerated urbanization and industrialization processes lead to the transformation of a large amount of agricultural land into construction land, and the increase in urban construction land will cause a subsequent increase in energy consumption of water and electricity, bringing about the deterioration of environmental pollution [8, 26]. He and Du (2022) found that LRM hinders inclusive green growth [27]. Moreover, Burchfield et al. (2006) also argued that the expansion of urban building sites would erode the green area around cities, thus reducing the regional ecological regulation of air quality and carbon reduction capacity [28]. Therefore, some scholars suggest that allocating land resources rationally to improve the level of intensive land use can effectively slow down the growth of CE from energy consumption in land use [29]. Secondly, when it comes to the approach and structure of land resources offered, local governments often facilitate the rapid development of industrialization through extensive concessions of industrial land since industry is a critical driver of economic growth and a significant source of fiscal revenue [30]. Local governments, in order to enhance their attractiveness to foreign investors, have also used industrial land concessions at low prices to recklessly increase the share of industrial land, driving a rapid increase in energy consumption and CE [31, 32]. Because of the non-liquidity of the service sector, local governments drive the development of the service sector by attracting manufacturing inflows at low prices. Commercial and residential land is often sold through bidding, auctioning, and listing at high prices to compensate for the loss of revenue from industrial land concessions. This drives up urban housing prices and stimulates the growth of high-energy industries like construction, which contributes to increased environmental pollution [33]. Xie et al. (2022) further analyzed that LRM is characterized as inefficient, costly, and unsustainable and can aggravate industrial pollutant emissions by hindering industrial structure upgrading and technological innovation [24].
In addition, some scholars paid attention to the CE effect of LRM. Due to the monopoly of the land market by local governments, there is a misallocation of land between residential, industrial, and other land uses, and LRM exacerbates CE [25]. Han and Huang (2022) found that a large amount of urban construction land being used for industrial development would lead to low prices for industrial land and high prices for other land, and there is a land misallocation phenomenon [34]. And LRM can aggravate CE through channels such as hindering industrial upgrading and technological progress. Zhou et al. (2022) found that LRM reduces CE efficiency and that lagging industrial upgrading and technological upgrading are important mechanisms [35].
Although existing research has made some progress, there are still some shortcomings that need to be addressed. First, the findings on the relationship between GCC and CE are inconsistent, and fewer studies have been conducted to explain this difference. Second, there is limited research that incorporates GCC, LRM, and CE within the same theoretical framework. The interaction between LRM and CE also lacks attention, and there is a need to improve the systematicity of research in this area. Finally, there is limited research exploring the impact of improved official appraisal systems on low-carbon development, especially in the context of land resource allocation perspectives.
Theoretical Mechanisms and Research Hypotheses
Direct and Indirect Effects of GCC on CE under the Spatial Association
With the acceleration of the regional integration process in China, the economic ties between regions are getting closer and closer, and there is a radiating effect of industrial structures and development ways between neighboring regions, thus there is a spatial spillover effect of CE between regions [3]. As land resources are an important asset for local governments to pursue development, neighboring local governments will carry out strategic interactions in land resource allocation to achieve economic growth and enhance fiscal revenue, i.e., there is also a correlation effect of LRM in space [25]. While GCC is a strategic interaction between local governments and neighboring regions through a series of instruments to improve competitiveness [36]. Therefore, it is necessary to explore the impact of GCC and LRM on CE from the perspective of spatial association. It can be found that GCC can not only affect CE directly, but also may affect CE by acting on the LRM.
The Direct Impact of GCC on CE under Spatial Association
Based on the spatial correlation perspective, the direct impact of GCC on CE is mainly reflected in the following two aspects: First, the direct impact of GCC on local CE. Under the current performance appraisal standard, which is still dominated by GDP, local governments will adopt competitive behaviors to lower local environmental regulation standards and environmental access thresholds to attract foreign investment inflows and prevent local resource outflows to promote economic growth, but this will increase pollution emissions [5, 37]. Local governments will also compete for capital inflows through a competitive model of lower taxes, which can drive short-term growth in industry and the local economy but can hinder the upgrading of local industrial structures and even increase CE [22]. Local government competition will reduce the supply of public goods such as environmental protection, which will reduce local capital in environmental protection [9] and is not conducive to reducing local CE. Second, the direct impact of neighboring GCC on local CE. Under the tax-sharing system, the inter-regional GDP race and promotion assessment criteria make localities compete with each other [38]. When neighboring governments adopt policies such as tax incentives to attract capital to enhance their competitiveness, local governments will also adopt bottom-up competition strategies to increase their attractiveness to capital with lower taxes to win the competition [39]. This process will lead to an increase in polluting backward production capacity, thus exacerbating environmental pollution and CE between regions. Moreover, the environmental protection investment of neighboring governments in the competition process will also show free-riding [13], thus discouraging the local government’s investment in environmental management and the phenomenon of pollution emission climbing, which aggravates the local carbon emissions. Based on the above analysis, the following research hypothesis is proposed:
Hypothesis 1: Local and neighboring GCC will increase local CE.
Indirect Effects of GCC on CE through LRM under Spatial Association
Based on the spatial correlation perspective, the indirect effects of GCC on CE are mainly reflected in the following two aspects. First, the indirect impact of local GCC on local CE through LRM. Under the Chinese style competition system, local governments have recklessly expanded industrial concessions, distorted land resource allocation to enhance their competitive advantage, and even attracted the inflow of foreign capital (including polluting capital) at the expense of sustainable urban development [31], increasing energy CE in industrial land. Moreover, as an important economic production factor, local governments competing for growth will attract low-quality capital projects into the local region by using ultra-low-priced land concessions or even zero land prices, which is not conducive to local energy conservation and CE reduction [18]. Second, the indirect impact of competition from neighboring governments to attract capital through LRM in terms of local CE. In addition to using taxation and environmental regulations, local governments will also use land concessions to compete in the process of competition. When neighboring governments adopt cheap agreements to grant industrial land, local governments will also distort the price of land elements offered to attract the inflow of industrial enterprises in order to compete for capital inflows [25], while industrial land expansion, as the main driver of CE, can exacerbate local CE [23]. In addition, interregional governments not only adopt the bottom-by-bottom competition strategy of land concession price to attract capital, but also have the bottom-line competition behavior of competing to reduce the quality of capital attraction [23], and thus the LRM caused by GCC can lead to the ultra-regular development of middle and low-end manufacturing industries and intensify pollutant emissions [33], which is not conducive to reducing CE. Based on the above analysis, the following research hypothesis is proposed:
Hypothesis 2: Local and neighboring GCC will exacerbate local CE by distorting the allocation of land resources.
Method and Data
Econometric Models
When constructing the model, two constraints need to be considered: First, there is a mutual influence relationship between local LRM and CE: the reasonable degree of local land resource allocation will be affected by local CE. If the local CE is higher, it means the environmental protection standard is lower, which will easily lead to distortions in land resource allocation. At the same time, the allocation of land resources will have an impact on local CE; the reasonable degree of land resource allocation will affect the local economic development mode [6], and thus there is an aggravating or inhibiting effect on CE. Therefore, a simultaneous equation model for the simultaneous determination of LRM and CE is established. Second, when there is competition among governments, the rational degree of land resource allocation of local governments is influenced by the neighboring governments [25], and there is also a spatial correlation effect of CE between regions [3]. Therefore, a spatial econometric model was developed to systematically examine the possible spatial correlation between LRM and CE, and the model is also able to address endogeneity. Referring to Long et al. (2020) [40], a spatial panel simultaneous equation model including the LRM equation and CE equation is constructed to perform econometric estimation: A spatially weighted term for LRM is added to the LRM equation to represent the strategic interaction status of land resource allocation. In the CE equation, this paper adds spatially weighted terms of CE to control the spatial correlation effect of CE. The model is set up as follows:
where i indicates region, t indicates years, and CO2 represents CE. WGCC, WLRM, and WCO2 denote the spatially lagged terms of GCC, LRM, and CE; W is a N×N dimensional spatial weighting matrix that contains both geographic and economic-geographic mixed weighting types. x and z denote the exogenous control variables of the LRM equation and the CE equation, respectively. εit and μit are the random error terms.
Due to the interaction between LRM and CE, there is an endogeneity problem between the variables and the error term. There is a problem of non-consistency or non-effective estimation of the spatial panel simultaneous equation estimates [40]. To overcome this problem, this paper uses a generalized spatial three-stage Least Squares method (GS3SLS) for econometric analysis. First, Two-Stage Least Squares (2SLS) is used to estimate the regression of the LRM equation and the CE equation, respectively. Treating the exogenous control variables in the model as instrumental variables (IV) and obtaining the corresponding predicted values. Regressing the explanatory variables through the predicted values and exogenous control variables and calculating the residuals ε̂ . Second, this paper estimates the residuals ε̂ , error terms ρ and Φ by the GMM method and obtains a consistent estimate of ρ̂ and Φ , ̂ The Cochran-Orcutt transformation is then used to obtain the model equation for the removal of the ρ and Φ. Finally, all the explanatory variables obtained from the Cochran-Orcutt transformation were regressed on IV to obtain the corresponding predicted values, and the predicted values were estimated on the explanatory variables using the GLS method to obtain consistent and effective estimates of the impact coefficients.
Variables and Data Descriptions
Due to the availability of data, 30 provinces in China from 2008-2020 are used as subjects. CE data is from the China Energy Statistical Yearbook, China Statistical Yearbook. The data on LRM is mainly based on the land sale data compiled by China Land Market Network. Data on GCC are from the China Trade and Foreign Economic Statistics Yearbook, and the China Finance Yearbook. Other data comes from the China Statistical Yearbook, the China Population, the Employment Statistical Yearbook, and so on. All data involving prices in this paper are treated with constant 2000 prices as the base period. The meanings and descriptive statistics of the main variable indicators are shown in Table 1.
Regarding the metric of the explanatory variable CE, the paper uses data and calculations for the seven major fuels (coal, coke, natural gas, fuel oil, diesel, gasoline, and coke, etc.) provided by the IPCC, which draws on Ma et al. (2021) [25], CO2 from energy consumption in each location is calculated by obtaining the CE factor for each fuel and the fuel consumption in each location. In addition, there are a number of industrial products that have a large amount of CE in the production process as well. In this paper, we measure CO2 emissions from the production of two products (cement and coke) with high CE intensity. Then, the CE from energy consumption is aggregated to obtain the total estimated CE for each region. In the robustness test, the paper expresses carbon intensity by using the ratio of total CE to GDP [41].
Table 1.
Descriptive statistics of variables.
On the metric of LRM, this paper draws on Zhang et al. (2022) [23]. The ratio of the average price of non-industrial land to the average price of industrial land was compiled using the raw industrial land sale data from the China Land Market Network to indicate the reasonable degree of land resource allocation. The larger the ratio, the more distorted the allocation of land resources.
Regarding the measure of the core explanatory variable GCC, drawing on Liu et al. (2021) [22], the amount of foreign investment per capita is taken to represent local competition for attracting capital, that is, the ratio of foreign investment to total population in each region, and a larger value indicates more stimulating local competition for attracting capital inflows.
Control variables for the CE equation: economic growth (ey) and its squared term (ey2): real GDP per capita and the squared term of real GDP per capita are used to test the environmental Kuznets curve [42]. Industry Structure (indus): measured by the share of the value added of the secondary sector in the local GDP of each province and region [21]. Population density (den): expressed as the ratio of the total population of the region at the end of the year to the area of the administrative district [6]. Neighborhood Carbon Emissions (WCO2). In this paper, a spatial lag term Wtcoo is added to the CE equation to investigate the effect of CE from neighboring regions on the level of CE in the region and verify the existence of agglomeration effects in the spatial distribution of regional CE in China [3]. Meanwhile, in order to measure the impact of neighboring GCC on local CE, this paper adds a spatial lag term Wcomp to the CE equation.
Control variables of the LRM equation: Economic growth (ey): expressed by local per capita real GDP [23]. Financial pressure (fg): expressed in terms of local government fiscal general budgetary expenditure versus fiscal budgetary revenue [25]. Urbanization level (urban): this article uses the proportion of urban population in the total population to measure [25]. Population size (pop): the total population at the end of the year in each place is used as a measure [3]. Neighborhood land resource misallocation (WLRM), This paper adds a spatial lag term WLRM to the land resource allocation equation to study the influence of land resource allocation in neighboring regions on the rational degree of local land resource allocation in order to verify the demonstration effect of regional land resource allocation in China in terms of spatial distribution. Meanwhile, in order to measure the impact of neighboring GCC on local land resource allocation, this paper adds a spatial lag term WGCCA to the CE equation.
Spatial Evolution Patterns of GCC, LRM, and CE
Spatial Distribution Characteristics in GCC
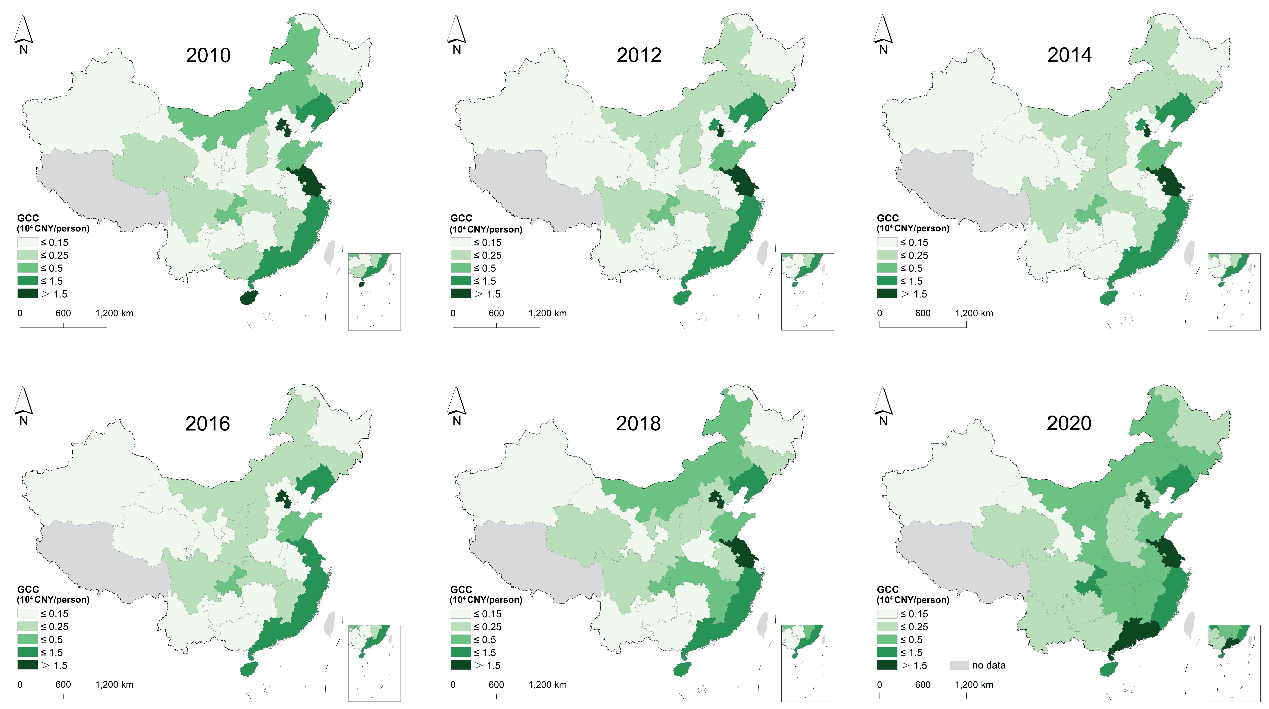
To analyze the spatial and temporal evolution characteristics of GCC in different regions of China, ArcGIS is employed for visual display. Fig. 1 illustrates a gradual increase in GCC over time throughout China as a whole. Starting in 2018, China’s GCC has been spreading from the eastern region to the central region. Overall, the distribution of GCC in China shows that the eastern region is the strongest, the central region is the second strongest, and the western region is the weakest. One possible reason for this pattern is the relocation of polluting industries from the eastern region to the central and western regions as the more developed regions upgrade their industries. Additionally, the central and western regions may offer attractive policies to encourage capital inflows for economic growth. As a result, a GCC development pattern has emerged with the Yangtze River Delta, Pearl River Delta, and Beijing-Tianjin-Hebei urban agglomerations serving as the core. This observation highlights the phenomenon of neighboring cities competing to attract capital. Similarly, due to the western region’s poorer resource endowment and weaker development base, the western region has relatively lower capital attractiveness; as a result, the degree of inter-regional GCC is also lower.
Spatial Distribution Characteristics of LRM
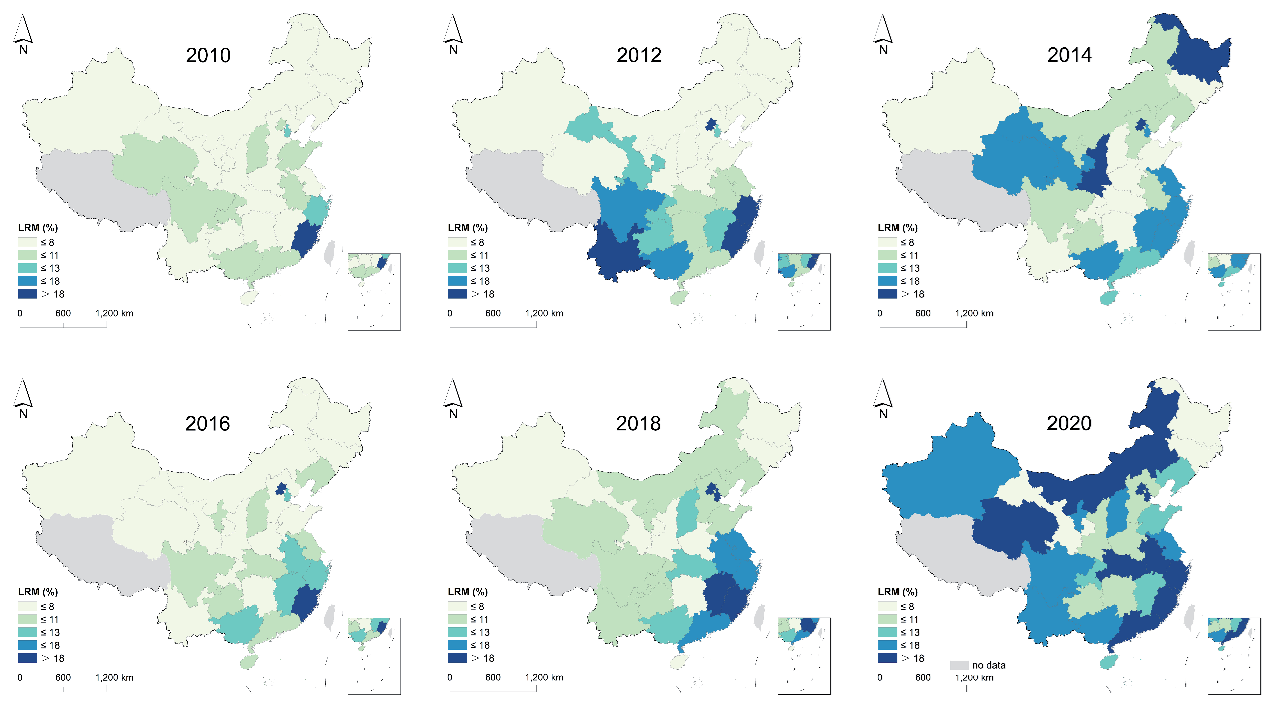
To analyze the spatial and temporal distribution of LRM in different regions, this paper presents a visualization as shown in Fig. 2. The figure reveals that the LRM exhibits a gradual strengthening trend over time. From 2010 to 2014, the LRM of certain regions, such as Yunnan and Sichuan Province, exhibited a rising and then decreasing trend. However, from 2016 onwards, the LRMs of the majority of regions have continued to increase. The LRM trend reveals that it is spreading from the eastern region to the central and western regions. This trend could be due to the fact that central and western regions offer industrial land at lower prices to attract industrial inflows and achieve economic growth, which can result in a serious LRM. The rapid urbanization process in the eastern region has led to high prices for commercial and residential land, while the prices for industrial land remain low. This situation is difficult to effectively change in the short term, resulting in a more serious land mismatch issue in most eastern regions.
Spatial Distribution Characteristics of CE
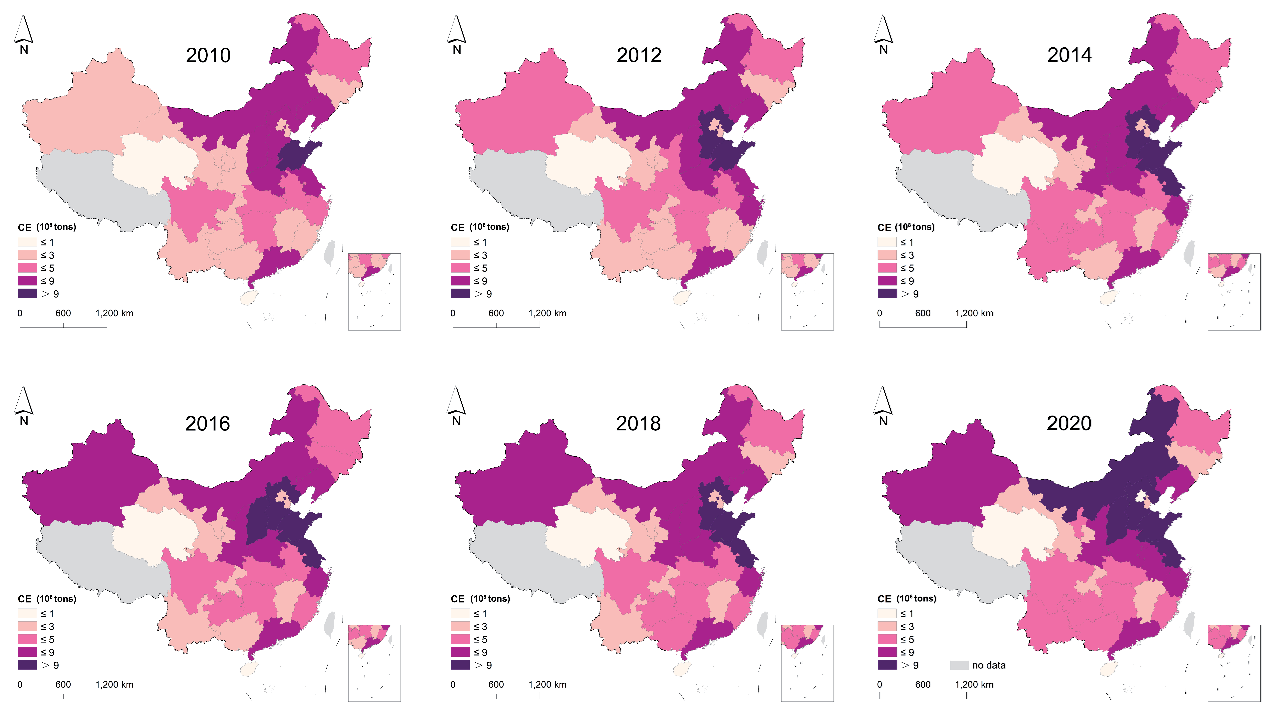
As depicted in Fig. 3, CE, as a whole, demonstrate their low-to-high distribution pattern from the south to the north as well as from the west to the east, indicating remarkable disparities between the southern and northern as well as the eastern and western regions. The observed pattern could be attributed to the dominance of coal in the northern region’s energy structure as well as significant energy consumption during winter heating, resulting in relatively higher CE in this region. Moreover, the eastern region, being a leader in economic development, incurs substantial energy consumption for transportation and industries, leading to higher carbon emissions in this region as well. Furthermore, the overall CE in China has been on a continual rise over time, with the most substantial increments reported in the eastern and northern regions and sizable rises in certain southern cities, such as the Pearl River Delta region. The primary culprit can be attributed to a high level of industrialization in these regions, and the industrial sector stands out as the primary contributor to CE.
In summary, GCC, LRM, and CE in China are exhibiting an increasing trend over time. Furthermore, the eastern region shows a distinctive pattern of GCC exhibiting a rise and shifting towards the central region annually, with the same evolutionary trend observed in CE. This suggests that there may be a correlation between GCC and CE in terms of their spatial and temporal evolutionary characteristics. Moreover, LRM has exhibited a trend of expanding across the nation in recent years, with the east-central region experiencing the most significant impact. The analysis of the evolutionary patterns of GCC, LRM, and CE indicates that they are spatially interlinked, and there may be potential impacts resulting from this. Additionally, there is a spatial correlation and transfer effect among regions. Therefore, it is necessary to examine the relationship between GCC, LRM, and CE from the perspective of spatial correlation, which is an important reference value for each region in China to achieve orderly competition in attracting investment, allocating land resources, and achieving the goals of CE reduction.
Results
Direct and Indirect Effects of GCC on CE under Spatial Association
Due to the existence of competitive behaviors among regional governments and the reasonable degree of land resource allocation, there is also a certain imitative demonstration effect, while CE is also affected by the nearby GCC and land resource allocation. Therefore, two spatial weight matrices are constructed in this paper: one is the common geographic distance spatial weight matrix, which uses the inverse of the nearest road mileage between the local and neighboring provincial capitals to represent. However, there are limitations in constructing the weight matrix purely by geographic matrix. This paper also constructs a matrix of economic distance weights in an economic sense, expressed as the product of the inverse of the nearest road mileage between the local and neighboring provincial capitals and the annual average value of local GDP per capita as a proportion of the annual average value of GDP per capita in all regions.
From the results of the CE equation in Table 2, the coefficient of local GCC on CE is 0.821 and passes the significance test at the 1% level, indicating that an increased degree of local GCC exacerbates CE. This is similar to the findings of Zhang et al. (2022) [23], as local governments compete to reduce the quality of capital in the competition process, thus deteriorating the local ecological environment and increasing pollution emissions. The coefficient of WGCC on CE is 0.883 and passes the significance test at the 5% level, indicating that stronger competition from neighboring places leads to an increase in local CE. This is because when neighboring regions increase their investment attraction efforts, local governments lower local environmental standards in order to win the competition for economic growth, thus increasing local CE [21]. The above findings suggest that the local and neighboring GCC will directly aggravate local CE, which verifies hypothesis 1. The impact of local land resource allocation (LRM) on CE passes the significance test at the 1% level and the coefficient is 0.088. The result supports the conclusions of Huang and Du (2023) [42], indicating that distortions in land resource allocation increase CE. This is because the rising price of commercial land behind the distorted allocation of land resources is an important driver of CE, and the large number of low-priced industrial land concessions is also a major source of CE [34]. The coefficient of WLRM on local CE is 0.178 and significantly positive; that is, distorted land resource allocation in neighboring areas also aggravates local CE. This is because there is an imitation-demonstration effect of inter-regional land resource allocation, and when the land resource allocation of neighboring regions is not reasonable, local governments will adopt similar land use strategies to avoid capital outflow or tax revenue reduction [25]. The estimated coefficient of CE from neighboring regions (WCO2) is 0.750 and significantly positive, indicating that the increase in CE levels in neighboring regions will spread to the local area through the spatial spillover effect, leading to a clustering effect of CE between regions.
Table 2.
Direct and indirect effects of GCC on total CE under spatial association.
From the results of the LRM equation in Table 2, it is clear that the coefficient of the effect of local GCC on LRM is 0.490 and significantly positive, indicating that local GCC causes distortion in LRM. This finding is consistent with that of Liu et al. (2021) [22]. Because land is a scarce productive resource, cheap industrial land will be offered in large quantities during the GCC, resulting in LRM. The coefficient of the effect of neighboring GCC on LRM is 3.283 and significantly positive; that is, an increase in neighboring GCC will also increase the degree of local LRM. This finding is consistent with Du and Li (2014) because governments among localities compete to attract capital inflows through land attraction, such as by lowering industrial prices for industrial land [25]. Governments among regions to attract capital is the underlying incentive for distorted local land resource allocation. The above findings suggest that both local and neighboring GCC lead to local LRM, while local and neighboring LRM will aggravate local CE. Therefore, the local and neighboring GCCs can aggravate local CE through LRM, verifying the existence of hypothesis 2. The coefficient of the effect of local CE on LRM is significantly positive, that is, increased local CE causes LRM. Because regions with more serious carbon emissions have more lenient environmental standards and relatively backward industrial structures, land use will be biased toward backward and polluting industries, resulting in distorted land resource allocation. The estimated coefficient of neighboring CE (WCO2) is 0.166; that is, the increase in neighboring land CE will aggravate the degree of local LRM, but the effect is not significant. The impact coefficient of WLRM is 0.339 and significantly positive, and this result is consistent with the findings of Ma et al. (2021) that there is a spatially correlated effect of LRM between regions [25].
Other control variables affecting CE: the estimated coefficient of economic growth (ey) is significantly positive, while the estimated coefficient of its squared term (ey2) is significantly negative. This finding is similar to that of Yang et al. (2021) [2], suggesting that there is an inverted U-shaped relationship between economic growth and CE, with CE increasing as the level of economic growth rises, but decreasing when economic development reaches a certain level. Because of China’s rapid economic development in the early stages, industrialization and urbanization were relatively crude, and the consumption of fossil energy was high. But with the increasing level of economic development, the government began to realize the unsustainability of development at the expense of the environment, and the increased public demand for environmental quality also put pressure on the government to save energy and reduce emissions [21], which is conducive to promoting CE reduction. The coefficient of the effect of industrial structure (indus) on CE is negative but not significant, indicating that there is no significant aggravating or inhibiting effect between the current industrial structure and CE, probably because the current industrial structure in China is in the stage of upgrading and optimization, and the continuous improvement of the level of clean technology will reduce the CE of the secondary industry. The coefficient of the effect of population density (den) on CE is significantly positive; that is, an increase in population density will aggravate CE because an increase in population density will cause traffic congestion and an increase in energy consumption, resulting in an increase in CE.
Table 3.
Direct and indirect effects of GCC on CE intensity under spatial association.
Other control variables affecting LRM: the coefficient of the effect of ey on LRM is negative but insignificant, indicating that the current government pays primary attention to the scale of land concessions rather than quality when making land concessions, and even to promote economic growth, there is still the act of concessioning industrial land at low prices to attract capital [23]. Therefore, the current economic growth is hardly effective in improving LRM. The estimated coefficient of fiscal pressure (Ffg) is negative but not significant; that is, there is no significant facilitating or inhibiting effect of fiscal pressure on LRM, which is consistent with the findings of Liu et al. (2021) that local governments do not distort land resource allocation in order to obtain fiscal revenue directly from land concessions [22]. The estimated coefficient of urbanization (urban) is significantly positive; that is, urbanization accelerates CE. Because urbanization expansion increases the demand for land resources, the government will promote urbanization by purchasing agricultural land at a low price and selling commercial land at a high price, which leads to LRM. The effect coefficient of population size (pop) is significantly positive; that is, an increase in population promotes LRM. This finding is similar to the findings of Ma et al. (2021) [25], which are due to the fact that an increase in population causes an elevated demand for urban land and a subsequent spike in the price of urban commercial and service land in particular, which leads to distortions in the price of land concessions.
The findings in Table 2 have more systematically verified the theoretical hypotheses 1 and 2 proposed in this paper, namely, that GCC will directly aggravate CE and also through LRM. To verify robustness, the ratio of total CE to GDP is used to express CE intensity for robustness testing, drawing on Ma et al. (2021) [25], and the larger this ratio is, the higher the CE per unit of GDP, which can better measure the CE of current economic activities. The robustness results are shown in Table 3. In terms of the direct effect of GCC on CE intensity, an increase in local and neighboring GCC both directly aggravate local CE intensity. In terms of indirect impacts, both local and neighboring GCCs can exacerbate CE by distorting the allocation of land resources. The other estimates are almost identical to those in Table 2 and will not be repeated. Therefore, this paper concludes that the results of the direct effect of local GCC on CE and the indirect effect on CE through distorting land resource allocation under spatial association are more robust and plausible, again verifying the existence of hypotheses 1 and 2.
Further Analysis
The change in central policy and the resulting change in the performance appraisal system of local officials will cause a change in the behavior and role of the GCC. Thus, the direct effect of GCC on CE and the indirect effect of CE through LRM are likely to shift. In November 2013, the Fifth Plenary Session of the 18th CPC Central Committee clearly proposed that the performance appraisal of local officials should highlight the orientation of scientific development and incorporate the construction of ecological civilization into the appraisal system, which in turn prompted a change in the competitive behavior of each government in capital attraction and promoted the synergistic development of economic growth, energy conservation, and emission reduction. This paper divides the full sample period into two time periods, with 2014 as the boundary, and tries to show whether competitive behavior and the shape of the government’s role in capital attraction change before and after the ecological civilization construction is incorporated into the performance appraisal system.
Table 4 shows the results of the econometric estimation under the mixed weight matrix of economic geography. Before the construction of ecological civilization is incorporated into the officials’ performance appraisal system, the coefficients of both local GCC and neighboring regions’ GCC on CE are significantly positive, indicating that GCC will directly aggravate local CE. When the officials’ performance appraisal system is improved, the coefficient of the local GCC on CE is 0.889, but not significant, and the coefficient of the WGCC on CE is significantly negative, indicating that after the ecological civilization construction is incorporated into the performance appraisal system, the local GCC does not significantly aggravate CE, and the neighboring GCC even reduces local CE. This finding is similar to that of Wang et al. (2021) [1]. It is because, after the central government incorporated the construction of ecological civilization into the appraisal system for local officials, local officials have strengthened their emphasis on environmental protection while pursuing economic growth. And the local government no longer reacts to the competitive behavior of neighboring regional governments or even changes to top-by-top competition. The improvement of regional capital attraction quality will directly reduce local CE. In terms of indirect effects, the coefficients of the effects of local GCC and neighboring GCC on LRM in 2008-2013 are significantly positive, while the coefficients of LRM on CE are also significantly positive, indicating that local GCC aggravates CE through LRM. In the latter time period (2014-2020), the coefficient of the effect of local and neighboring GCC on LRM is also significantly positive, indicating that when the construction of ecological civilization is incorporated into the performance assessment system of local officials, GCC still aggravates LRM and thus increases CE. This is because the integration of ecological civilization construction into the performance appraisal system can change the bottom-by-bottom competitive behavior in attracting capital quality, but local governments will still increase the scale of industrial land concessions and lower the price of industrial land concessions to attract capital inflows, which leads to LRM and aggravates pollutant emissions [33].
Table 4.
Direct and indirect effects of GCC on total CE under different time periods.
In general, after the central government incorporates the construction of ecological civilization into the performance appraisal system, local GCC will change to top-by-top competition, thus directly reducing CE. However, in terms of indirect impact, the improvement of the performance appraisal system has only changed bottom-up competition behavior, and it is difficult to change the current status quo of local governments in attracting capital with land; thus, GCC will still aggravate CE through LRM.
Conclusions
This paper utilizes the General Spatial Three-Stage Least Squares model and other econometric methods to more systematically study the impact of government competition for capital (GCC) and land resource misallocation (LRM) on carbon emissions (CE). The data comes from 30 Chinese provinces during the period 2008-2020. The main findings are as follows: GCC, LRM, and CE display significant spatial heterogeneity, with an overall development pattern that follows a trend of being “high in the east and low in the west,” and a spatial spreading trend. Increased competition between local and neighboring regions for capital attraction will directly aggravate CE, and local and neighboring regions for capital attraction will also indirectly aggravate CE by distorting the land resource allocation channel, so the robustness test is passed. Further analysis reveals that when the construction of ecological civilization is incorporated into the performance appraisal system, there is no direct aggravating effect of local GCC on CE, and neighboring GCC will even directly reduce local CE. However, GCC from local and neighboring regions will still promote LRM, thus indirectly aggravating local CE.
Based on the above findings, the policy implications of this paper are as follows:
First, this study found that GCC not only exacerbated local carbon emissions, but also worsened neighboring carbon emissions. The findings imply that local governments should strive to establish a coordination mechanism between regional capital attraction and environmental protection and continuously regulate the behavior of the local GCC. Local governments strictly set environmental standards in the process of capital attraction, raise the environmental threshold for capital inflow, and prevent local officials from competing to lower the quality of capital to meet performance appraisals, thereby reducing the increase in CE brought by the entry of polluting capital. Second, LRM is an important channel through which GCC exacerbates local and neighboring carbon emissions. The central government should take measures to strictly regulate the land concessions granted by local governments. Such measures can help curb the capital-attraction behavior of local governments and prevent them from engaging in competitive behavior that involves cheap industrial land concessions. By attracting external capital to high-quality projects, this approach can minimize the environmental impact of industrial land-scale expansion. Local governments can also contribute by deepening the market allocation of industrial land and adjusting the land use structure to promote the rational allocation of land resources. Third, the inclusion of ecological civilization in the officials’ appraisal system has an important role to play in easing government competition and reducing carbon emissions. Therefore, the central government should continue to improve the performance appraisal system of local officials, abandon the traditional concept of GDP as the hero, and link environmental protection-related indicators to the performance appraisal. And the central government continues to increase the weight of green assessment content to reduce local government competition for economic growth at the expense of the environment.
Although this study has made progress, there are still some limitations. This study uses data at the provincial level in China, with a sample of overall macro-level data. The conclusions would have been more practically relevant if the study had been conducted at the prefecture-level city level. In future research, we will further explore the relationship between GCC, LRM, and CE at the city level in China. In addition, as land is an important element of economic development, this paper is concerned with the role of land resource mismatch in the impact of GCC on CE. However, the ability of land marketization to mitigate the negative impacts of GCC on CE has not been focused on. Future research will explore the role of land marketization in the implementation of carbon mitigation measures by the government.

