

Introduction
Wheat is the second most important cereal crop after rice, which provides nutritional security to 60 percent of the world population [1], and a marginal reduction of wheat yield occurs due to the effects of abiotic and biotic crop stress [2, 3]. The drastic climate change patterns are adding an adverse effect on crop health due to the evolution of new races of pathogens for different fungal genera [3, 4]. Leaf rust, or brown rust, is a major constraint of wheat production targeting yield losses due to the increasing pressure of virulent strains [4]. Prevalent pathotypes of leaf rust (12-5, 77-1, 77-5, 77-9, 104-2) in the Indian subcontinent are creating epidemics in the northwestern parts of the country [5]. Breeding is the most important strategy for the management of triple rust in wheat with exploitation of host resistance, categorized in two ways, such as race-specific and non-race-specific resistance [6-8]. In the present day, nearly 76 resistance race-specific breeding genes with several quantitive loci are identified and exploited in breeding programs for the development of resistance varieties [9- 11]. The race-specific resistance is the most manipulated genetic resistance, which is overcome easily due to the evolution of new races challenging the durability of the cultivars, but the cultivars with broad, non-race-specific resistance have shown longer durability [11, 12]. The gene expression is generally based on providing defense techniques in combating plant diseases, altering the changes in the physiochemical structures of the plant cell [13]. The resistance action is provided by active and passive barriers to defense-related actions in plants, Active barriers of the plant cell, such as ion influxes across the plasma membrane alter the changes of the cell membrane and cross-linkages of the cell membrane with callose deposition [14], and membrane leakage due to pathogen infection affects photosynthetic activity associated with high transpiration, which changes the water levels in plants [15, 16]. However, the little-known information on the effect of the physiological and biochemical alternations in wheat plant cells and their impacts on yield reduction was less understood. The present research was conducted to learn about the effect of the physio-biochemical properties in yield reduction and the effect of the resistance patterns of cultivars on physio-biochemical parameters in response to leaf rust. Physical parameters such as disease severity at the flag leaf stage, membrane stability of wheat plant cells, proline concentrations, and test weight of seed samples were important parameters recorded during the cropping seasons 2021-22 and 2022-23.
Experimental
Plant Material
Plant material for the evaluation of leaf rust resistance was obtained through AICRP Wheat and Barley, IIWBR-Karnal, Haryana, India. 100g of seed material of wheat germplasm was used as the testing material; forty-eight germplasms of seed material were tested in two replications along with susceptible checks Lalbahadur, and Agra local from the Division of Plant Breeding and Genetics, SKUAST-Jammu. The prominent leaf rust pathotypes were collected from the infected seed samples and stored at 40C, and the samples were soaked in sterile distilled water, and the inoculum was multiplied on the susceptible cultivar of Agra local in the controlled growth chamber. Spacing of 10 cm between plant to plant and 22 cm between row to row was maintained, to ensure severe disease infection fields were irrigated adequately for the proper spread of the disease without any abiotic stress conditions.
Adult Plant Screening
Disease severity of leaf rust was recorded from the February 1st week to the end of the crop period, and disease scoring was recorded from the third flag leaf stage to final harvesting until the green leaf stage for two cropping seasons during 2021-2023. A Modified Cobbs scale was used for disease severity scoring, and visual observations were important in recording the disease severity. Below 2% disease severity recorded as a trace, more than 5% severity intervals were used for disease severity recordings, and 5-10% and 20% intervals were used for higher scores [17]. The slow rusting parameters that were used in categorizing germplasm are based on the following disease severity parameters, such as FRS and CI.
Final Rust Severity Values (FRS)
FRS value at the adult plant stage refers to the degree of resistance among screened germplasm, with different types of disease severity response and the classification of screened germplasm based on different values of FRS, such as 1-20%, 20-40%, 40-60%, and > 60%, refers to high, moderate, and low levels of slow rusting genes [18].
Coefficient of Infection
The data from the field observation was converted to disease severity by using the Modified Cobbs scale, combining the disease severity with the host infection reaction [19]. The disease score was recorded as a modified cobs scale with IT values 0-immune; Resistant R-0.2; Resistant to Moderately Resistant RMR-0.3; Moderately Resistant MR-0.4; Moderately Resistant to Moderately Susceptible MRMS-0.6; Moderately Susceptible-0.8; Moderately Susceptible to Susceptible-0.9; and Susceptible-1 [20]. The categorization of the slow rust lines by using the CI lines, such as values 1-20, 21-40, and 41-60 shows high, medium, and low levels of slow rusting genes, which are used in estimating the partial resistance in wheat cultivars [21]. The effect of disease severity on different physio chemical parameters was represented in Fig. 1. through a scatter plot.
Membrane Stability
The membrane stability of plant cells indicates the extent of plant resistance under different biotic and abiotic stress. For this, we have to take 20 ml tubes containing deionized distilled water. Leaf bits of wheat were cleaned and placed in the test tubes, rotated under the vortex machine, and EC was measured as the initial electrical conductivity of sample E0. Samples were refrigerated at 40C for 24 hrs, and electrical conductivity was assessed as EC1, and the same samples were autoclaved at 1200C for 20 min, and EC2 was counted. The membrane stability index was calculated as [22].
EC1 ˗ EC0/EC2 ˗ EC0 X 1000
Proline Content
Proline content in the leaves of the screened germplasm was estimated to know the effect of the proline concentration due to leaf rust on different germplasm leaves, and it was calculated by the procedure [23].
Proline content in leaf tissue was calculated by using the formula given below:
Test Weight of the Seed
The test weight of 1000 grain seed weight was calculated from the screened germplasm lines for two cropping seasons [24].
Fig. 1.
Scatter Plot representation of impact of disease severity on different physiochemical parameters.
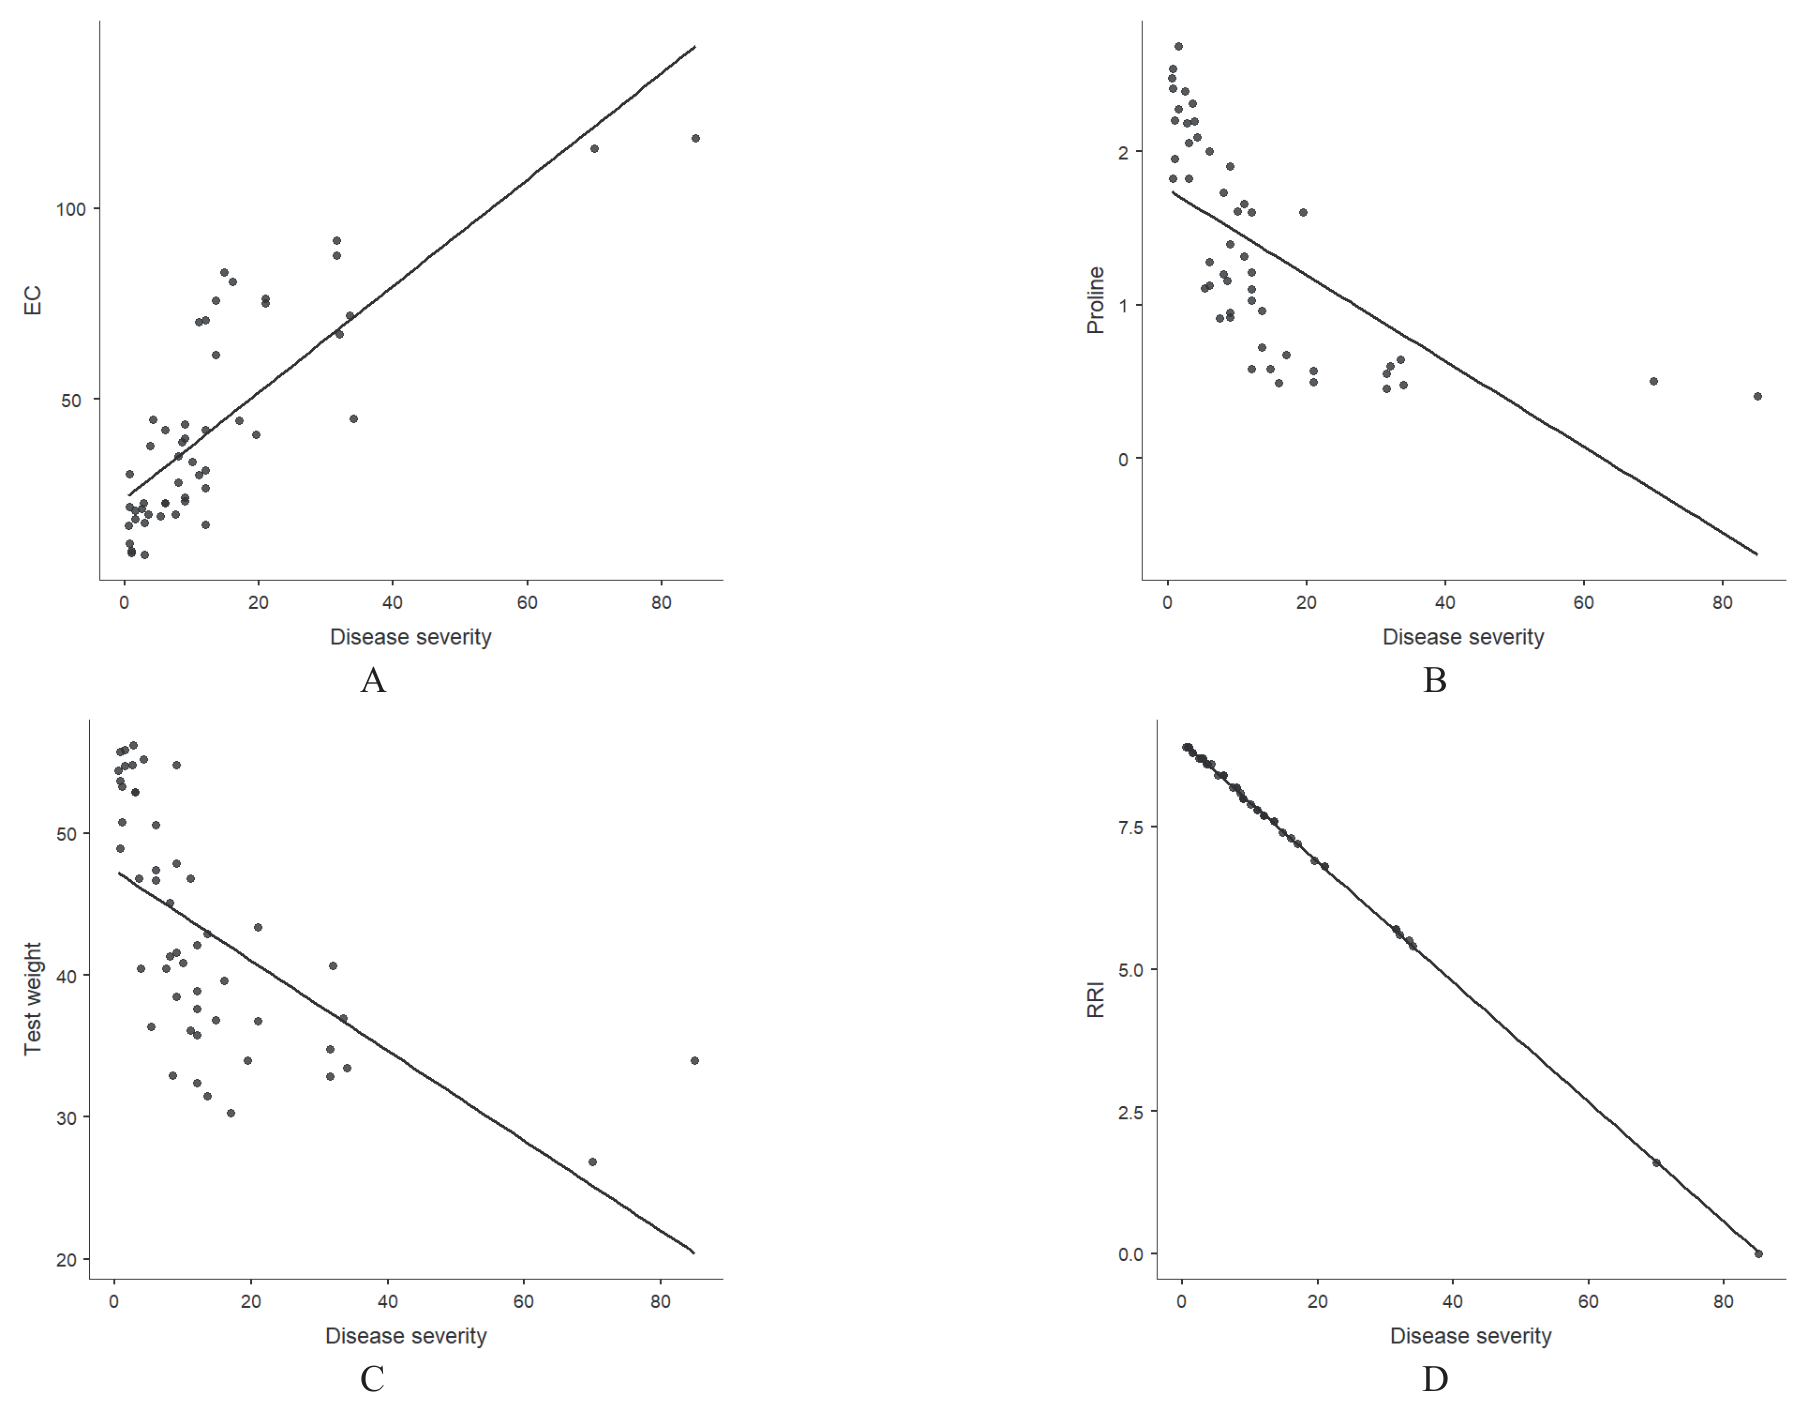
Table 1.
Adult Plant reaction and Disease severity values of scrneed germplasm of wheat during rabi 2021-23. Table 1. Table continued.
Relative Resistance Index
The Relative Resistance Index of the germplasm was calculated to know the effect of resistance patterns among the screened germplasm, in which the Relative Resistance Index of the screened line was calculated by using a 0-9 scale, in which 0 represents the most susceptible and 9 represents highly resistant, and for the stripe rust, the acceptable index of RRI is 6 or 7. The lines with RRI values 6 to 7 are considered the slow rusting lines [25]. The RRI values are calculated by considering the highest CI value as 100, which is the CARPA value of the country’s average relative percentage of attack, and the CARPA values of the rest of the lines are calculated accordingly to the highest line.
Statistical Analysis
The data of disease scoring parameters, disease severity, and physio-biochemical parameters are subjected to statistical analysis and compared at p <0.05 for significance. SPSS software was used for performing statistical research.
Results and Discussion
Adult Plant Resistance
Average Coefficient of Infection
The ACI value of screened germplasm was calculated based on the final rust severity of the screened germplasm for two successive cropping seasons, and it had been identified that the average coefficient of infection ranged between 0 and 80 percent of the final disease severity. The two susceptible checks of the wheat germplasm Agra local and PBW343 had been noticed with disease severity more than 60 percent with susceptible reaction for two cropping seasons. Among the fifty-germplasm average coefficient of infection value where the disease severity less than 0-10 was observed in twenty-eight germplasm lines such as JSW 1, 3, 5, 8, 9, 10, 11, 15, 16, 17, 18, 19, 21, 22, 26, 28, 29, 30, 31, 32, 33, 34, 37, 38, 40, 41, 44, and 47. The disease severity average coefficient of infection values 11-20 was observed in thirteen germplasm lines such as JSW2, 4, 6, 7, 12, 13, 25, 27, 35, 39, 42, 46, and 48. ACI values between 21 and 40 were observed in seven germplasm lines such as JSW 14, 20, 23, 24, 36, 43, and 45. The susceptible checks PBW343 and Agra local show a susceptible reaction.
R to RMR relative moderate resistance had been noticed in fourteen germplasm lines such as JSW 1, 3, 5, 8, 9, 10, 11, 15, 18, 19, 28, 32, 34, and 41 potential sources of race-specific genes represented in Table 1. FRS values are crucial for the identification of slow rust resistance in germplasm, with the aaverage coefficient of infection values of 1-20%, 20-40%, 40-60%, and > 60% referring to high, moderate, and low levels of slow rusting genes [25, 26]. Germplasm JSW 3, 5, 9, 8, 10, 11, 15, 16, 18, 19, 26, 28, 29, 32, 34, and 41 and their FRS values are less than 10; these are good sources of monogenic resistance and also recorded the highest 1000 seed weight with RRI values greater than 8, which indicates strong race-specific resistance [27, 28].
Electric Conductivity
Electric conductivity refers to the membrane stability of wheat germplasm, which indicates the level of resistance membrane stability index ranged from 9.765 to 118.31. The pattern of the stability index for two cropping seasons from 2021-2023 is as follows: from 9 to 19.4 in nine germplasm lines and values between 20.85 to 28.5 in twelve germplasms, 30.3 to 39.75 in seven germplasm lines, and 40.8 to 44.7 observed in eight germplasm. Values of membrane stability from 61.5 to 67.5 were observed in two germplasm lines, such as membrane permeability from 70.25 to 75.95 was observed in six germplasm lines. Values of 80.8 to 87.8 were observed on three germplasm, one germplasm with membrane stability of 91.7, and the highest membrane stability was observed between 115.8 and 118.319 in Agra local and PBW343. Membrane stability, or EC values, are important factors for understanding the host-pathogen interaction. The more resistance of the germplasm, the lesser membrane stability, or EC, is observed, and the higher the susceptibility, the higher the EC. Germplasm with a disease severity response of R and RMR showed lower EC as the infection type and severity increased the electric conductivity; these are similar and supported by the research findings previously [29, 30].
Proline Content
The proline content of wheat under biotic stress was calculated from the leaf tissues; the proline content ranges from 0.503 µMoles/g of leaf samples in Agra Local to 2.685 µMoles/g of leaf samples in JSW15. Proline, which is a stress protein released due to adverse effects of environmental changes; rust susceptibility leads to a strong decrease in the proline content of the plant, but the germplasm that is resistant has a high level of the proline in their leaf tissues [8] found higher proline content in the moderately infested leaves of HD1222 compared with the controls as reported previously. The proline content and disease severity (%) maintained a highly significant negative correlation across the wheat germplasm, indicating wheat genotypes with high proline tend to have low disease severity, and the results were strongly supported by the results of [9, 10].
1000 Seed Weight
1000 seed weights were calculated among different germplasm, with a maximum seed weight of 55.7 g in JSW5 and the lowest seed weight of 26.85 g observed in Agra Local. The results of seed weight were reduced as the rust severity increased.
RRI
The RRI values of the screened germplasm indicate the durability of the germplasm. The highest RRI values were observed in the germplasm, which were above 8 in germplasm, viz., JSW 1, 5, 8, 9, 10, 11, 15, 16, 17, 18, 19, 21, 22, 26, 28, 29, 32, 33, 34, 37, 40, 41, 44, and 47. The germplasm RRI values, which are above 7, are recorded in viz., JSW 2, 4, 6, 7, 13, 25, 27, 35, 38, 39, 42, and 48. The germplasm with an RRI value below 7 was observed in germplasm, viz., GWJ 14, 20, 23, 24, 36, 43, and 45. The lowest RRI values were observed in susceptible checks such as Agra Local and PBW343, with RRI values of 1.6 and 0. The acceptable limits of RRI values for the leaf rust above 6 or 7 are considered to have the best potential, and above 7 is considered to be the best, as mentioned earlier in germplasm for RRI [31, 32].
Correlation Studies
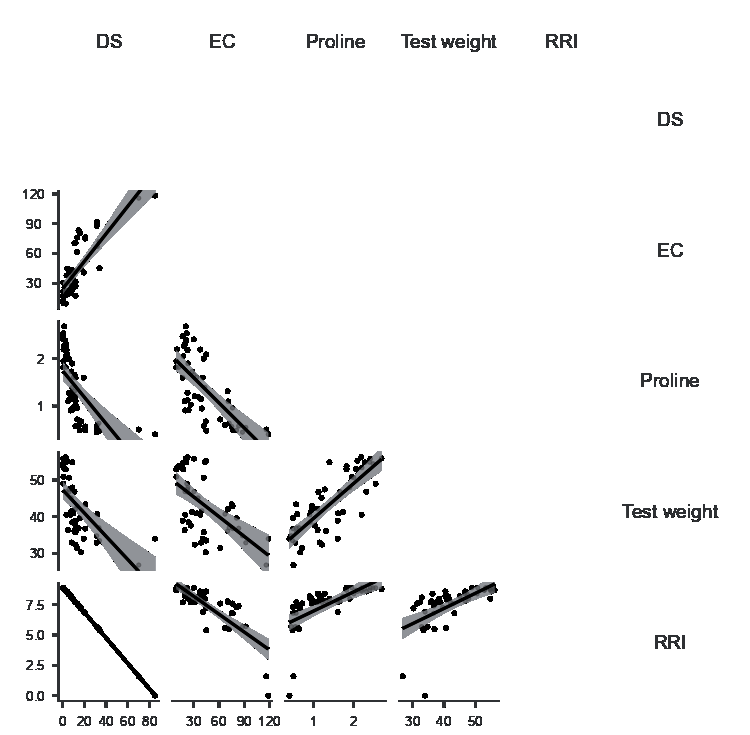
Correlation studies were performed between biochemical parameters and quantitative disease parameters of screened germplasm of wheat to understand the host-pathogen interactions and their corresponding effect on host resistance, which allowed us to understand the physio biochemical parameters related to resistance. Among the different variables, there was a strong correlation between the membrane stability or EC of the wheat with an average coefficient of infection values, which was a significant positive correlation (r= 0.808***) and positively correlated between seed weight and proline (r=0.794***). There is a negative correlation between the two biochemical parameters such as EC and proline, in which both are negatively correlated (r= -0.711***). The Relative Resistance Index, which describes the stability of the cultivars based on the ACI values, is more important, and it is negatively correlated with EC or membrane stability (r= -806***) and positively correlated with proline (r=0.648***). The calculated values of membrane stability (EC), proline, 1000 seed weight, and RRI are given (Table 2, Fig. 2.). The correlation studies of different variables, mainly EC and disease severity are positively correlated with each other [25, 26], and proline content was negatively correlated with disease severity [27, 28].
Cluster Dendrogram Analysis
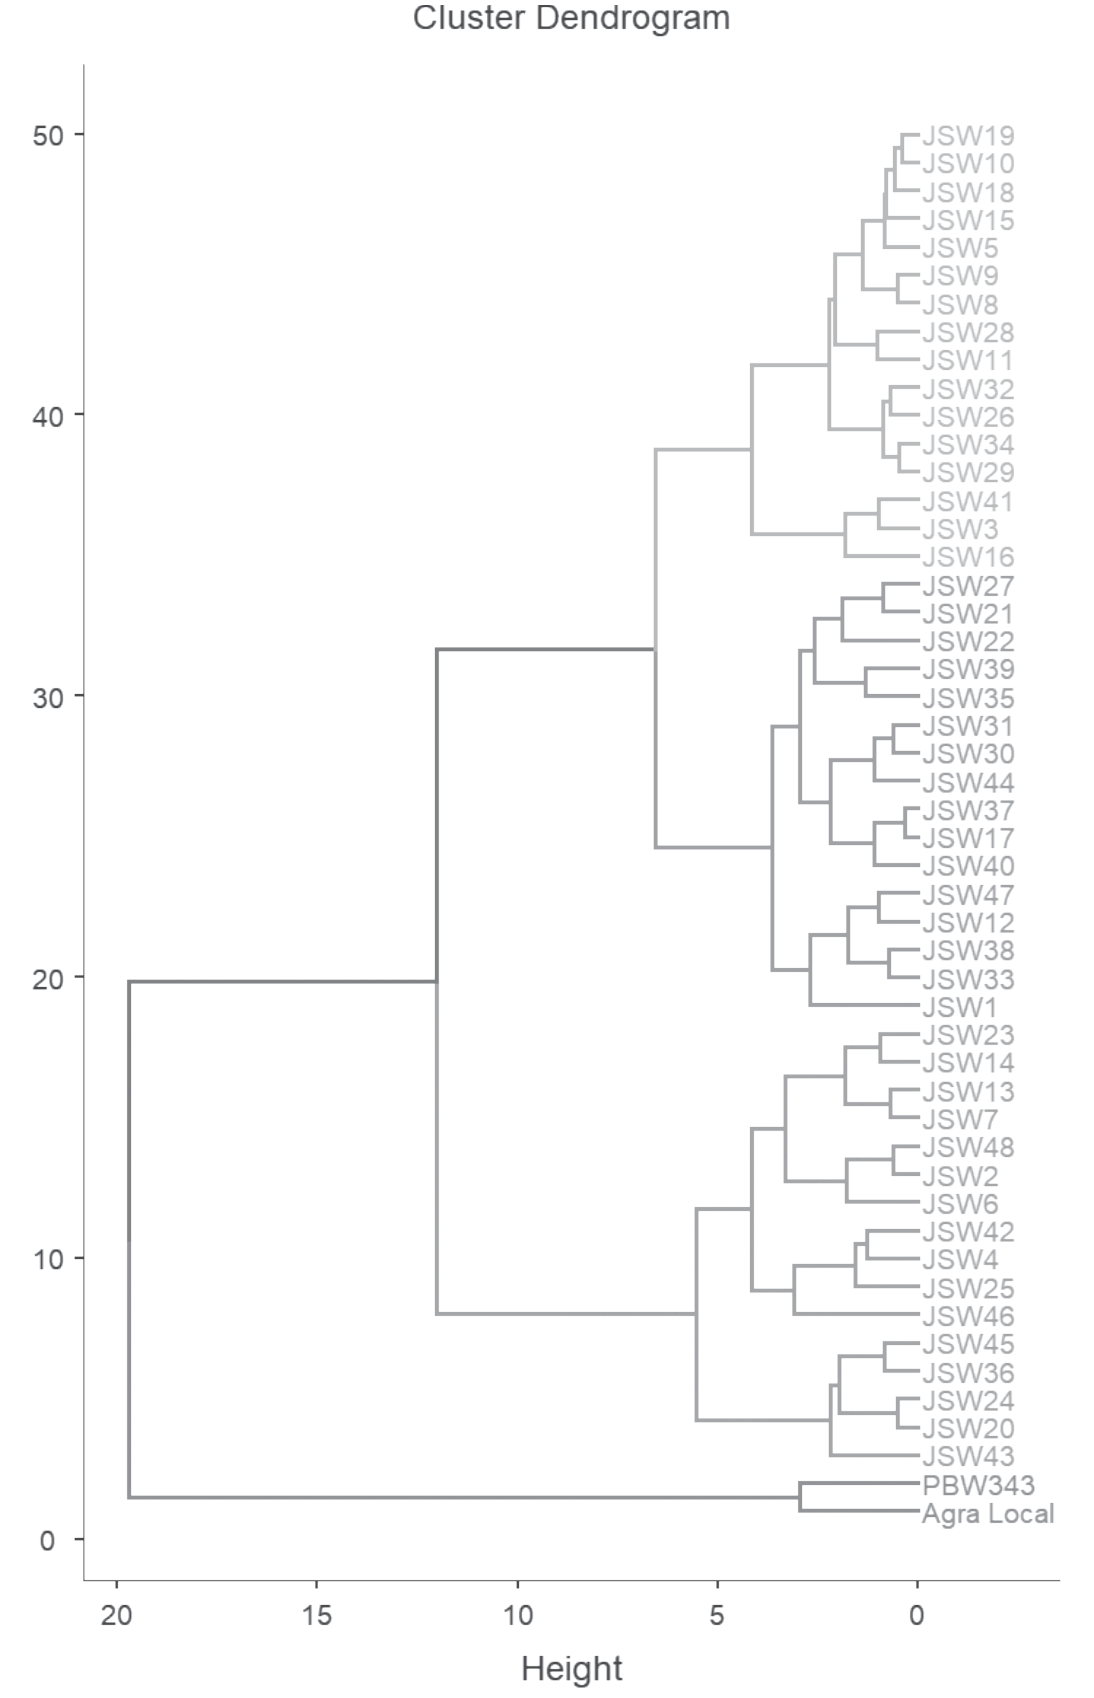
The cluster analysis of the germplasm was based on different parameters and classified the germplasm into four different clusters, such as cluster 1 with 16 germplasms, viz., JSW 3, 5, 9, 8, 10, 11, 15, 16, 18, 19, 26, 28, 29, 32, 34, and 41. This germplasm was observed with disease severity from 0.75 to 6, and the disease reaction of the germplasm ranges from R, RMR, and MR infection type, with proline concentrations of 1.85 to 2.475 µMoles/g and EC or membrane stability between 10.32 and 42. The second cluster consists of 15 germplasms viz., JSW 1, 12, 17, 21, 22, 27, 30, 31, 33, 35, 37, 38, 39, 40, 44, and 47. These germplasm was observed with disease response RMR, MR, MRMS, and MS, and proline concentration recorded as 0.92 to 2.195 µMoles/g, and EC or membrane stability with between 17.2 and 39.5. The third cluster consists of 16 germplasms, viz., JSW 2, 4, 6, 7, 13, 14, 20, 23, 24, 25, 36, 42, 43, 45, 46, and 48. The fourth cluster consists of only two germplasm lines, Agra Local and PBW343, with the lowest proline of 0.53 and 0.38 µMoles/g. A cluster based dendrogram of germplasm is represented in Fig. 3. The cluster analysis approach is the best way to group the screened germplasm based on different parameters; this type of cluster group in germplasm screening was reported previously [29, 30].
Table 2.
Tabular values of Physiochemical -characters in scrneed germplasm of wheat. Table 2. Table continued.
Conclusion
The present study reveals that the lines had enough diversity regarding partial resistance, ranging from immunity to partial resistant lines. Most of the tested germplasm exhibited better performance under high disease pressure. The resistance of germplasm and physio-biochemical parameters in accordance with disease severity exhibited high variation in response to disease severity. These lines were supposed to have genes for varying degrees of race-specific to partial resistance, and enough diversity was observed to be used for further genetic manipulations. Further testing for stability over years and locations for leaf rust along with other desirable characteristics must be made before approval.

