


Introduction
Safflower is a promising oilseed that has been growing under diverse agroecological conditions worldwide [1]. However, global statistics data reports indicate that Pakistan has never been a part of the history of safflower production. Safflower is significant for human dietary consumption due to its high achene oil content and the presence of polyunsaturated fatty acids (ώ-6) or monounsaturated fatty acids (ώ-9) [2-4]. Safflower seed contains essential components such as crude fiber, moisture, ash, proteins, and healthy non-oil components like tocopherols, phytosterols, and micronutrients [5-8]. Safflower is used in various industries, including edible oil, animal feed, soap, varnishes, plastics, and paints. Safflower petals are extracted for food color and dyes, proving their versatility in daily life and textile industries [9-13]. Moreover, safflower is an extremely drought-tolerant crop that can withstand abiotic stresses such as frost, salt, and soil fertility [14, 15].
Pakistan’s agriculture faces significant challenges due to climate change, including uncertain river flows, rainfall patterns, and soil issues. These factors limit crop husbandry, leading to unprecedented uncertainties in food security for the common [16]. Particularly, heat exposure tarnished maize cobs, plummeted wheat yields coupled with severe rust spread, and total failure of cotton seed production due to water scarcity, resulting in hefty imports of edible oil of US$ 3.681 billion in Pakistan during the production year 2019 [17]. The consumption of foreign exchequer on unhealthy chemically bleached palm oil led to the widespread cultivation of oilseeds for national needs as well. Further, local production of quality oilseeds, such as groundnut, sunflower, and canola, is discouraged, leading to the replacement of these with sustainable, easy-to-grow oilseed choices like safflower. Furthermore, adversities like soil salinity, irrigation water dearth, frost impact, and poor fertility require crop resilience and sustainable agricultural endeavors for food security and livelihood. Quality oil can be obtained from crops like sunflower, canola, and sesame, although they are not particularly resilient to climatic variations and certain temporal shocks.
Safflower is drought-resistant and able to thrive on low-nutrient soil with minimal photoperiod response and soil salinity [18-21]. The high amount of oil that can be extracted from safflower and its high quality made it evident that it would be a good choice for 220 million people in the nation. However, its limited spines on leaves, stem, and capitula hinder agronomic practices and interculture cum harvesting operations. Selection of non-spiny safflower accessions for local cultivation is therefore a viable option to increase local adoption. Introducing spiny and non-spiny safflower in semi-arid to arid, frost-prone, and saline conditions in Pakistan can be an effective strategy for increasing local adoption and the availability of high-quality edible oil for food security, health, and industrial use [22].
Targeted breeding programs are currently underway worldwide to develop diverse safflower germplasm through selection and hybridization. These programs are characterized by ideo-plant architecture, capitula spines, floral diversity, achene size, and oil content [23]. Genetic variability may also exist for adaptation to any new environment and to high-temperature exposures; thus, 145 introduced safflower accessions, and four local controls were cultivated to expose germplasm to the local environment of Pakistan. This research aims to identify safflower lines with spiny and spineless nature, equivalent oil content, higher potential for seed production, achene oil content, and other relevant characteristics. It was carried out to screen exotic safflower for better achene yield and achene oil traits even under extreme terminal heat stress at the close of spring, low soil fertility with sandy loam texture, and in response to temperature shocks.
Experimental
Germplasm Selection and Climatic Features of the
Experimental Site
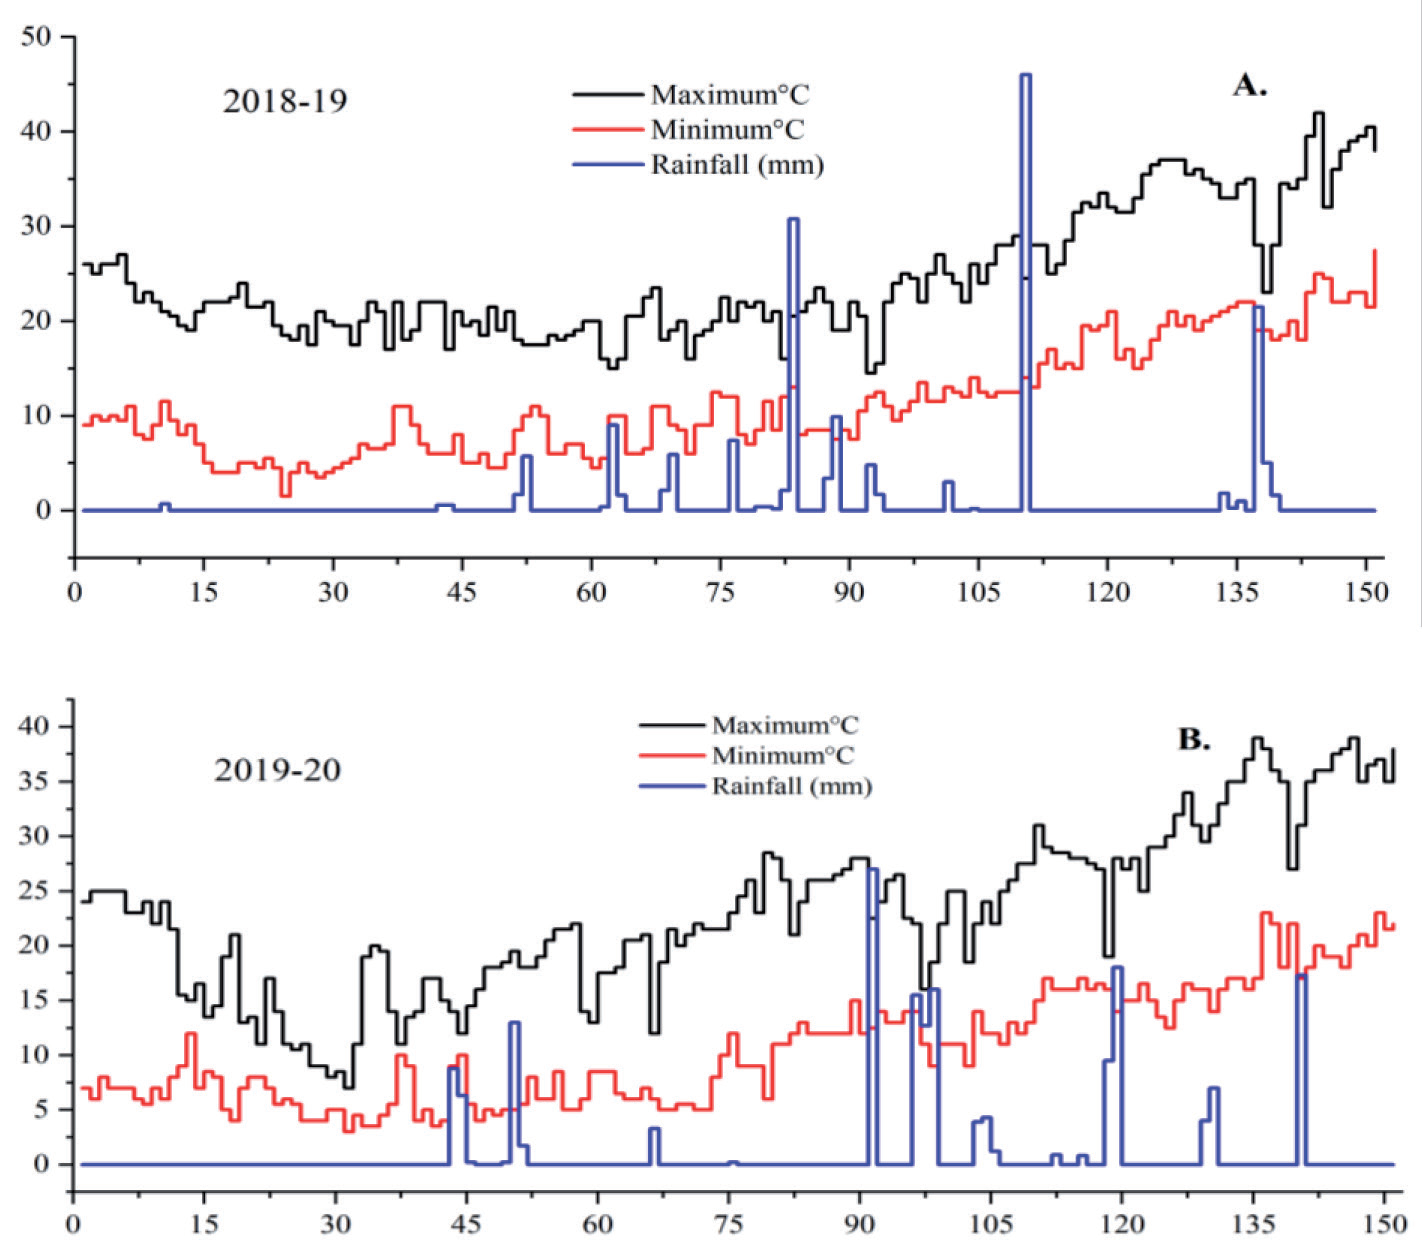
Safflower germplasm from the United States Department of Agriculture, USA, was imported and sown under semi-arid canal irrigated field conditions in Faisalabad, Pakistan (31.4504 ̊ N, 73.1350 E, and 184.4 m altitude). A series of experiments were designed with 145 cultivars along with four local control cultivars (Check-18, Check-29, Check-31, and Check-40) obtained from Oilseed Research Station, Bahawalpur working under the aegis of Oilseed Research Institute, Faisalabad Pakistan (detailed in Table 1) utilizing single replicated augmented layout [24]. Physical climate parameters (temperature and rainfall) and soil characteristics have been shown in Figure 1 and Table 2, respectively. In this study, the winter seasons Spiny score: 1; spineless, 2; less spiny, 3; more spiny of the years 2018-19 and 2019-20 were used to assess the responsiveness of safflower germplasm. The average photoperiod for the vegetative and maturity phases was between 4.8 and 8.9 hours during the study year of 2018- 19, whereas in 2019-20, the photoperiod was between 4.4 and 8.5 hours throughout the corresponding phases. Cultivar seeds were sown in single replicated augmented designs during the final week of November 2018-19 and 2019-20, but four local control cultivars were sown with three replicates in a single row of 4 m. Sowing was done by hand placement with 45 cm row-to-row spacing, and plant population was maintained after emergence with 15 cm spacing between plants with population density of 148148 plants per hectare. Diammonium phosphate was applied at seedbed preparation at a rate of 143 kg ha-1 containing 46% P2O5 and 18% NO3-. The remaining nitrogen was supplied by urea application at a rate of 146 kg ha-1. A pre-emergence herbicide containing S-metolachlor and Pendimethalin was sprayed after 10 hours of sowing to control weed growth. The crop only had one irrigation application, but it was 40 days after the sowing. However, later in the crop cycle, rainfall assisted the crop to meet its need for water. During a two-year experiment, growth characteristics, yield, and quality were recorded.
Table 1.
Some characteristics of investigated exotic safflower accessions obtained from Western Regional PI Station Washington State University Regional Plant Introduction Station 59 Johnson Hall Pullman, Washington, United States of America.
Table 2.
Soil type and its nutrient enrichment level used for testing different accessions of the safflower during 2018-19 and 2019-20.
| Parameters | 2018-19 | 2019-20 |
|---|---|---|
| Soil texture | Sandy loam | Sandy loam |
| Soil saturation (%) | 35 | 36 |
| EC (dS m-1) | 1.9 | 1.86 |
| pH | 7.7 | 7.8 |
| Organic matter (%) | 0.6 | 0.68 |
| N (%) | 0.25 | 0.3 |
| P (ppm) | 4.2 | 4.0 |
| K (ppm) | 235 | 238 |
Data Collection on Selected Traits
Traits including flower color (Yellow, orange, red), spiny score (spineless, less spiny, and more spiny), days to 50% flowering (DTF), days to maturity (DTM), plant height (PH), number of branches plant-1 (Bran), number of heads plant-1 were recorded. Capitula from ten randomly chosen plants were counted, and seed yield per plant was calculated by harvesting capitula from all ten of the plants in each accession. The seed yield was measured at 12% seed moisture content after the capitula were threshed by hand, and the seed was cleaned by storing it at 50 °C. Each accession had ten plants, and their seed weight was determined by weighing 1,000 seeds from each. Extraction of oil from the seed using a Soxhlet device was used to determine the amount of oil in the seed. Safflower seeds weighing 10 g were washed to eliminate inert debris and dried to the appropriate moisture content. Samples were then crushed in a blender and placed onto a Soxhlet apparatus using n-hexane, where they were subjected to solvent extraction until no more oil content was still extractable. Seed samples were loaded, and dried in an oven at a constant weight while maintaining a temperature of 40 °C, and their weight reduction was evaluated using an analytical weighing balance to determine the percentage of seed oil [25]. However, approximately 1.5 g of extracted oil was used for fatty acid profiling. The oil (50 µL) was methylated for one hour at room temperature with 4 ml KOH. Hexane was used to extract methylated fatty acids. Gas chromatography (M-3900, Varian, USA) was used to analyze the fatty acid profiles of all edible oils. The fused capillary column, flame ionizing detector, and nitrogen gas carrier were employed for the analysis @ 3.5 ml min- 1. The temperatures of the injector and detector were set to 260 °C, while the temperature of the column oven was set at 222 °C. Methylated esterified fatty acid was manually injected, and the fatty acid was detected by comparing peak retention time to the standard.
Data Analysis Using Different Statistical Techniques
Data was analyzed using an augmented design consisting of exotic genotypes with a single replication and local controls with three replications. Traits showing significant variability due to accessions were examined using multivariate analysis (principal component analysis) with the software OriginPro-2021. Data of 10 plants for each accession within in single replication was used to get the mean average within a single replication. The comparison of various traits of promising safflower genotypes with controls was conducted using Turkey’s honestly significant differences (HSD) test at a 5% probability level [26]. The promising genotypes were selected based on their performance regarding various traits such as days to 50% flowering (DTF), days to maturity (DTM), plant height (PH), number of branches plant-1 (Bran), number of heads plant-1, thousand seed weight g (TSW), seed yield g plant-1, oil content%, linoleic acid content% (LA) and oleic acid content% (OA) during 2018-19 and 2019-20. For two years, Pearson’s correlation analysis was used to investigate the relationship between phenological traits, yield, and oil characteristics. Using a two-tailed t-test (df-2), the significance of the correlation was examined. The cluster analysis was based on the assumption that different groupings of safflower accessions may be utilized in a breeding program to increase genetic diversity and produce hybrids with greater vigor. The software OriginPro-2021 was used to perform a dendrogram analysis.
Results
Analysis of variance was performed using an Augmented Design of employed safflower accessions and checks, which showed significant variation for subject traits (Table 3). During 2018-2019 blocks (eliminating treatments) exhibited significant variation for days to physiological maturity (DMT) and 1000-seed weight (TSW). Similarly, in 2019-2020 blocks resulted in significant variation in plant height, oil content, and linoleic acid content. In addition, during 2018- 2019, check treatments and test treatments, as well as their interactive (test & check) effect, were also found significant for all traits except DMT, which revealed insignificant interaction. Conversely, during 2019-2020, check treatments and test treatments showed significant responses for all traits. However, the interactive effect of the test and check was significant for assessed traits excluding days to maturity and oil content.
Table 3.
Mean sum of square of ANOVA, block adjusted for days to flowering (DTF), days to maturity (DMT) plant height (PH, cm), number of branches per plant (Bran), number of heads per plant (Heads), 1000-seed weight (TSW, g), seed yield per plant (Yield), oil content (Oil%), oleic acid (OA%) and linoleic acid (LA%) during 2018-2019 and 2019-2020.
Table 4.
Mean, ranges, and accessions variability for various traits i.e. days to 50% flowering (DTF), days to maturity (DTM), plant height (PH), number of branches plant-1 (Bran), number of heads plant-1, thousand seed weight g (TSW), seed yield g plant-1, oil content%, linoleic acid content% (LA) and oleic acid content% (OA) during 2018-19 and 2019-20.
Genotypic Mean Ranges and Genetic Variability in
Safflower Germplasm
In Table 4, the mean value, ranges, and genotypic coefficient of variation (GCV) for the evaluation of various phenological, morphological, and quality characteristics in germplasm are listed. In general, the accession means and ranges were higher than the check means and ranges. Thus, introduced accessions during 2018-19 had a higher coefficient of variation for all traits. The number of heads plant-1, seed yield, and oleic acid content had the highest genetic variability, while plant height, thousand seed weight, oil content, and linoleic acid content had low genetic variability, and phenological development traits had negligible genetic variability. In contrast, the 2019-20 accession means and ranges exceeded the check means and ranges of the 2018-19 study. The introduced safflower accessions exhibited the highest genetic variability for seed yield, number of heads plant-1, and oleic acid content, but the lowest genetic variability for phenological parameters, plant height, oil content, linoleic acid content, and thousand seed weight.
Mean Comparison Analysis of Promising Safflower Accessions
The mean comparison analysis of phenological and morphological traits in 2018-19 revealed a statistically significant effect (p ≤ 0.05) (Table 5). Accession G-77 had the longest days to 50% flowering, and the shortest days were taken in accessions G-24, G-22, and G-25, while maximum days to maturity were observed in accession G-24, which is statistically similar to G-66, G-77, and check-31, and the shortest days were observed in accession G-13. The tallest plant height was recorded in accession G-77, followed by G-24, and the shortest height was found in G-32, although the maximum number of branches was counted in G-48, which did not differ statistically from G-32, G-25, and G-13, and the minimum number of branches was counted in G-77. The G-25 accession had the highest number of heads, followed by the G-13 accession, and the G-77 accession had the fewest heads. Statistically, the highest seed weight was observed in G-24, followed by Check-31, and the lowest seed weight was observed in G-48. However, the highest seed yield was obtained in G-24, followed by G-13, and the lowest seed yield was recorded in G-25, while the highest oil content was extracted from G-66, which is comparable to G-48, and the lowest oil content was extracted from G-25. In addition, according to the description of fatty acids, G-77 had the highest oleic acid content, followed by G-48, while Check-31 had the lowest; the highest linoleic acid content was found in G-66, which was statistically at par with G-25, G-Check-31, and G-22; and G-77 had the lowest linoleic acid content.
Table 5.
Mean comparison of promising safflower accessions for various traits i.e. days to 50% flowering (DTF), days to maturity (DTM), plant height (PH), number of branches plant-1 (Bran), number of heads plant-1, thousand seed weight g (TSW), seed yield plant-1, oil content%, linoleic acid content% (LA) and oleic acid content% (OA) during 2018-19 and 2019-20.
In addition, the results of experiments conducted in 2019-2020 revealed that promising safflower accessions responded significantly (p ≤ 0.05) (Table 5). While interpreting the results of this study, the accession with the maximum days to 50% flowering was G-77 and the one with the minimum days was G-25, while the accession with the maximum days to maturity was G-77 and the one with the minimum days was G-22. In addition, the statistically tallest plant height was measured in G-77, followed by G-24, and the lowest plant height was observed in G-13, whereas the maximum number of branches was found in G-48, which was comparable to G-32, and the minimum number of branches was documented in G-77. The accession with the maximum number of heads was G-25, followed by G-13 and G-77, while the accession with the minimum number of heads was G-77. The accession with the highest thousand seed weight was G-24, followed by G-25 and G-48; check-31 had the lowest seed yield, while G-24 had the highest seed yield. However, G-48 had the highest oil content, which was statistically at par with G-66, whereas G-25 had the lowest oil content. According to the fatty acid profile data, G-77 had the highest oleic acid content, followed by G-21 and G-42, while Check-31 had the lowest. In the second-year study, Check-31 had the highest linoleic acid content, which did not statistically differ from G-25 and G-66, whereas G-77 had the lowest linoleic acid content.
Pearson Correlation Study of Safflower Yield and Quality Traits
Pearson correlation coefficients for 2018-19 and 2019-20 were calculated to demonstrate the relationship between traits (Table 6). There was a highly significant (P< 0.01) negative correlation between days to 50% flowering (DTF) and seed yield; additionally, there was a significant negative correlation between days to maturity (DTM) and yield. Similarly, the percentage of oil revealed a highly significant negative correlation with the number of days to 50% flowering and the number of days to maturity. There was a positive correlation between oil percentage and yield, while plant height showed a positive correlation with DTF and DTM. Furthermore, a similar correlation tendency was detected in 2019-20.
Table 6.
Pearson correlation coefficients among various phenological i.e. days to 50% flowering (DTF), days to maturity (DMT), and morphological traits i.e. plant height (PH), number of branches (Bran), number of heads plant-1, 1000-seed weight (TSW), yield plant-1, oil %, oleic acid% (OA) and linoleic acid% (LA) in safflower during 2018-19 and 2019-20.
Biplot Description
Selected safflower accessions with desirable characteristics were subjected to a biplot analysis to evaluate their traits in 2018-2019 (Figure 2). The biplot analysis revealed four main groups of traits. Plant height, heads, thousand seed weight as well as days to 50% flowering and days to maturation were closely related; consequently, they are clustered on the same axis on the biplot. However, linoleic acid and seed yield fall into the second category, whereas oil content and oleic acid content fall into the third and fourth groups, respectively. These four categories of accessions could be simultaneously selected for these traits. For example, the phenological traits days to 50% flowering (DTF) and days to maturity (DTM) were closely related, and the accessions G-98, G-73, G-104, G-69, G-121, and G-9 got the longest times for flowering and were considered late flowering, whereas the accessions G-73, G-98, G-104, G-121, G-69, G-7, and G-9 utilized the longest days for maturity and were considered late maturing. Accessions G-1, G-107, G-17, and G-8 had the tallest plant height among all accessions, while accessions G-103, G-136, G-134, G-8, and G-72 had the maximum number of heads and branches, and accessions G-106, G-63, G-120, and G-105 had the highest thousand seed weight. The accessions with the highest seed yield were G-24, G-22, G-13, G-66, G-32, G-21, and Check-31, whereas G-53, G-48, G-28, and G-66 had the maximum oil content. While accessions G-19, G-87, G-95, and G-18 had higher linoleic acid levels, accessions G-5 had the highest oleic acid levels.
Moreover, based on the interpretation of the biplot analysis of the second-year research study (Figure 3), four segments of safflower accessions could be selected for desirable parameters in 2019-2020. For instance, phenological traits such as days to 50% flowering (DF) and days to maturity (DTM) were closely related, and the accessions G-121, G-97, G-63, G-104, G-129, and G-69 that required the longest days for flowering and maturity were considered late flowering and late maturing respectively. Accessions G-1, G-8, G-107, and G-95 had the tallest plant height, while G-134, G-103, G-136, and G-101 had the highest number of heads plant-1. However, accession G-103 and G-134 had the highest number of branches plant-1. The accessions with the highest seed yield were G-24, G-13, G-22, G-48, G-25, and G-66, while the accessions with the highest oil content were G-53, G-22, G-16, G-24, and G-28. In terms of fatty acid profile, the accessions G-19, G-11, G-87, G-29, G-25, G-1, and Check-31 had the highest linoleic acid content, while accession G-5 had the greatest oleic acid content.
Fig. 2.
Biplot analysis report for various traits i.e. plant height (PH), days to 50% flowering (DTF), days to maturity (DTM), number of branches plant-1 (Bran), number of heads plant-1, oil content, thousand seed weight (TSW), seed yield plant-1, linoleic acid content (LA) and oleic acid content (OA) during 2018-19.
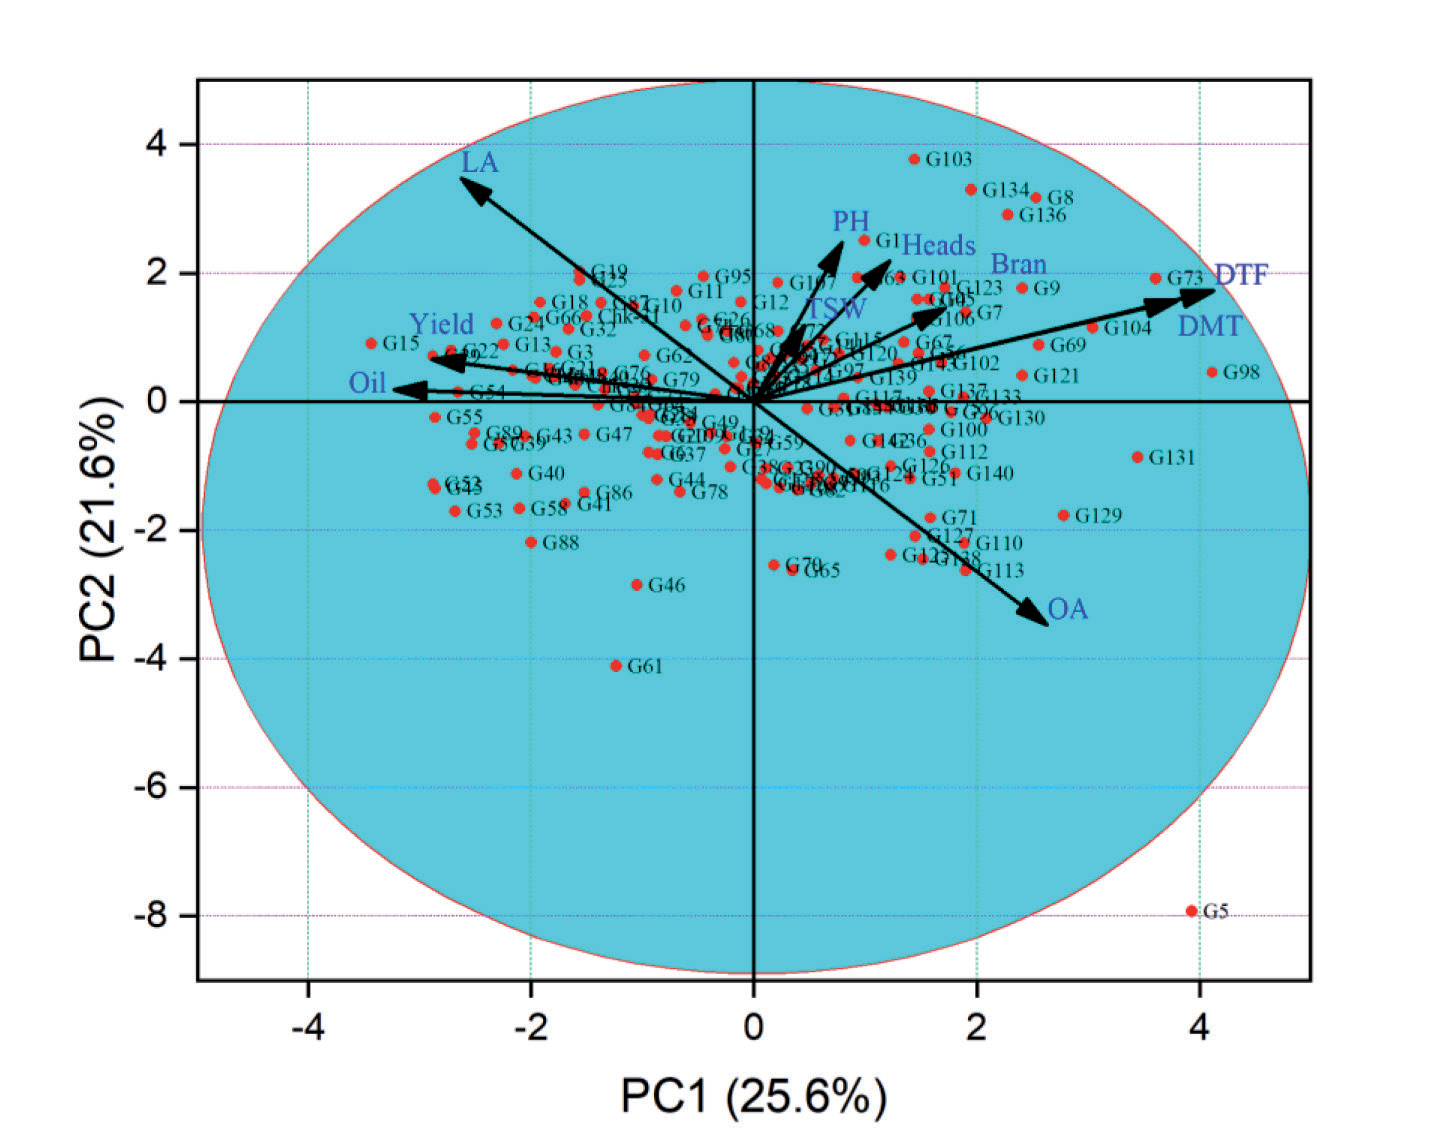
Fig. 3.
Biplot analysis report for various traits i.e. plant height (PH), days to 50% flowering (DTF), days to maturity (DTM), number of branches plant-1 (Bran), number of heads plant-1, oil content, thousand seed weight (TSW), seed yield plant-1, linoleic acid content (LA) and oleic acid content (OA) during 2019-20.
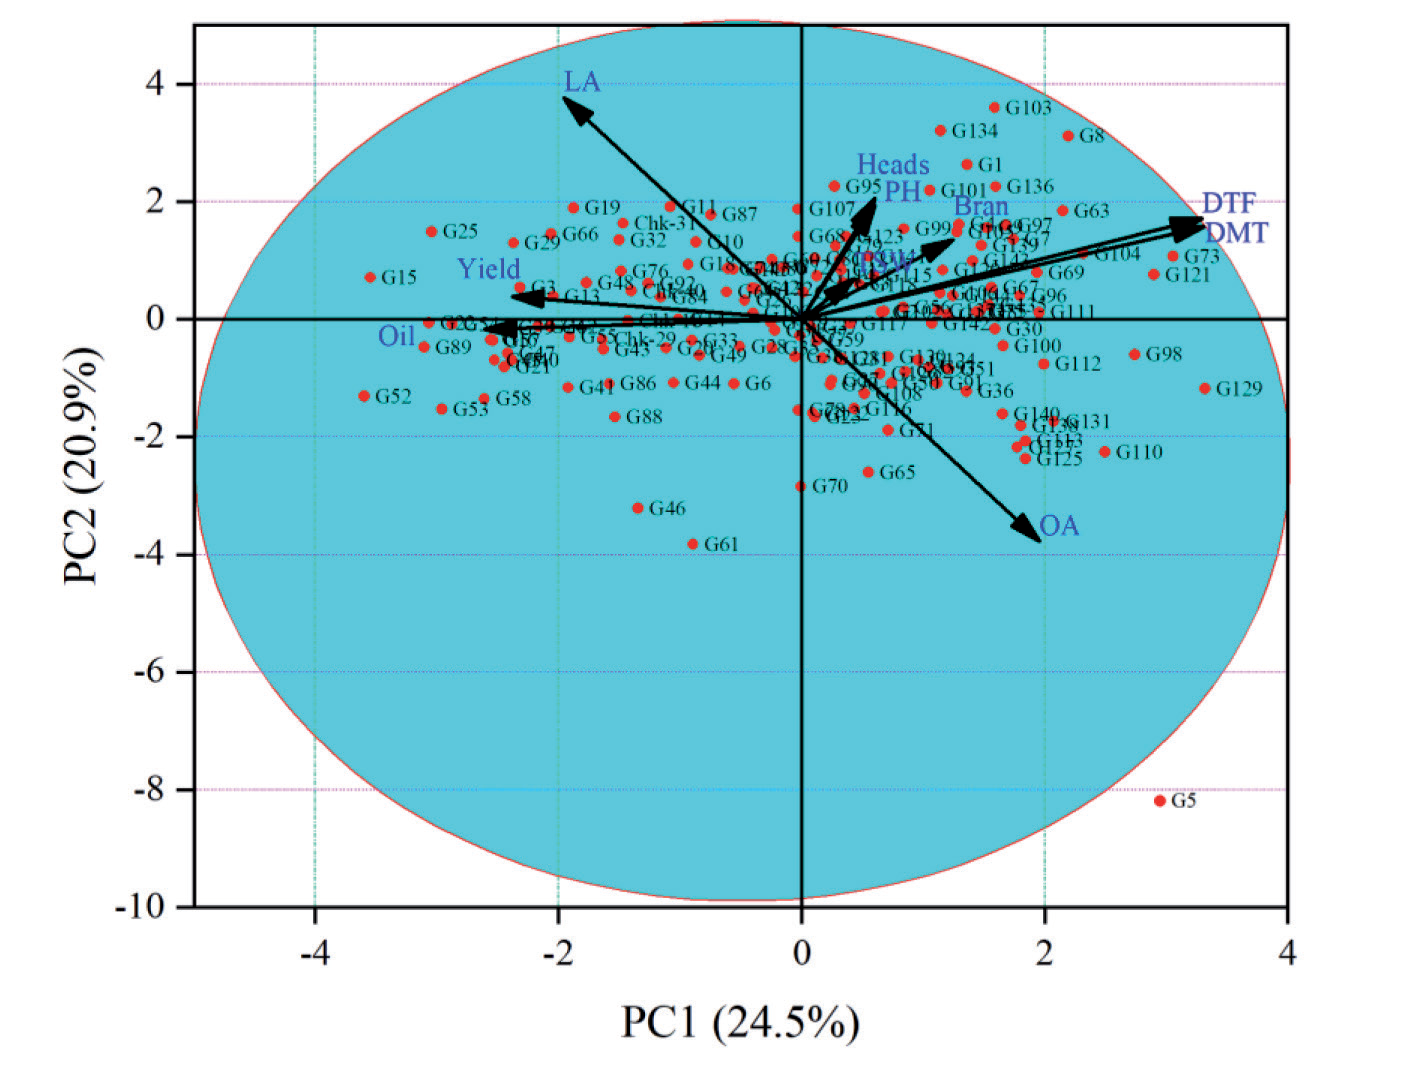
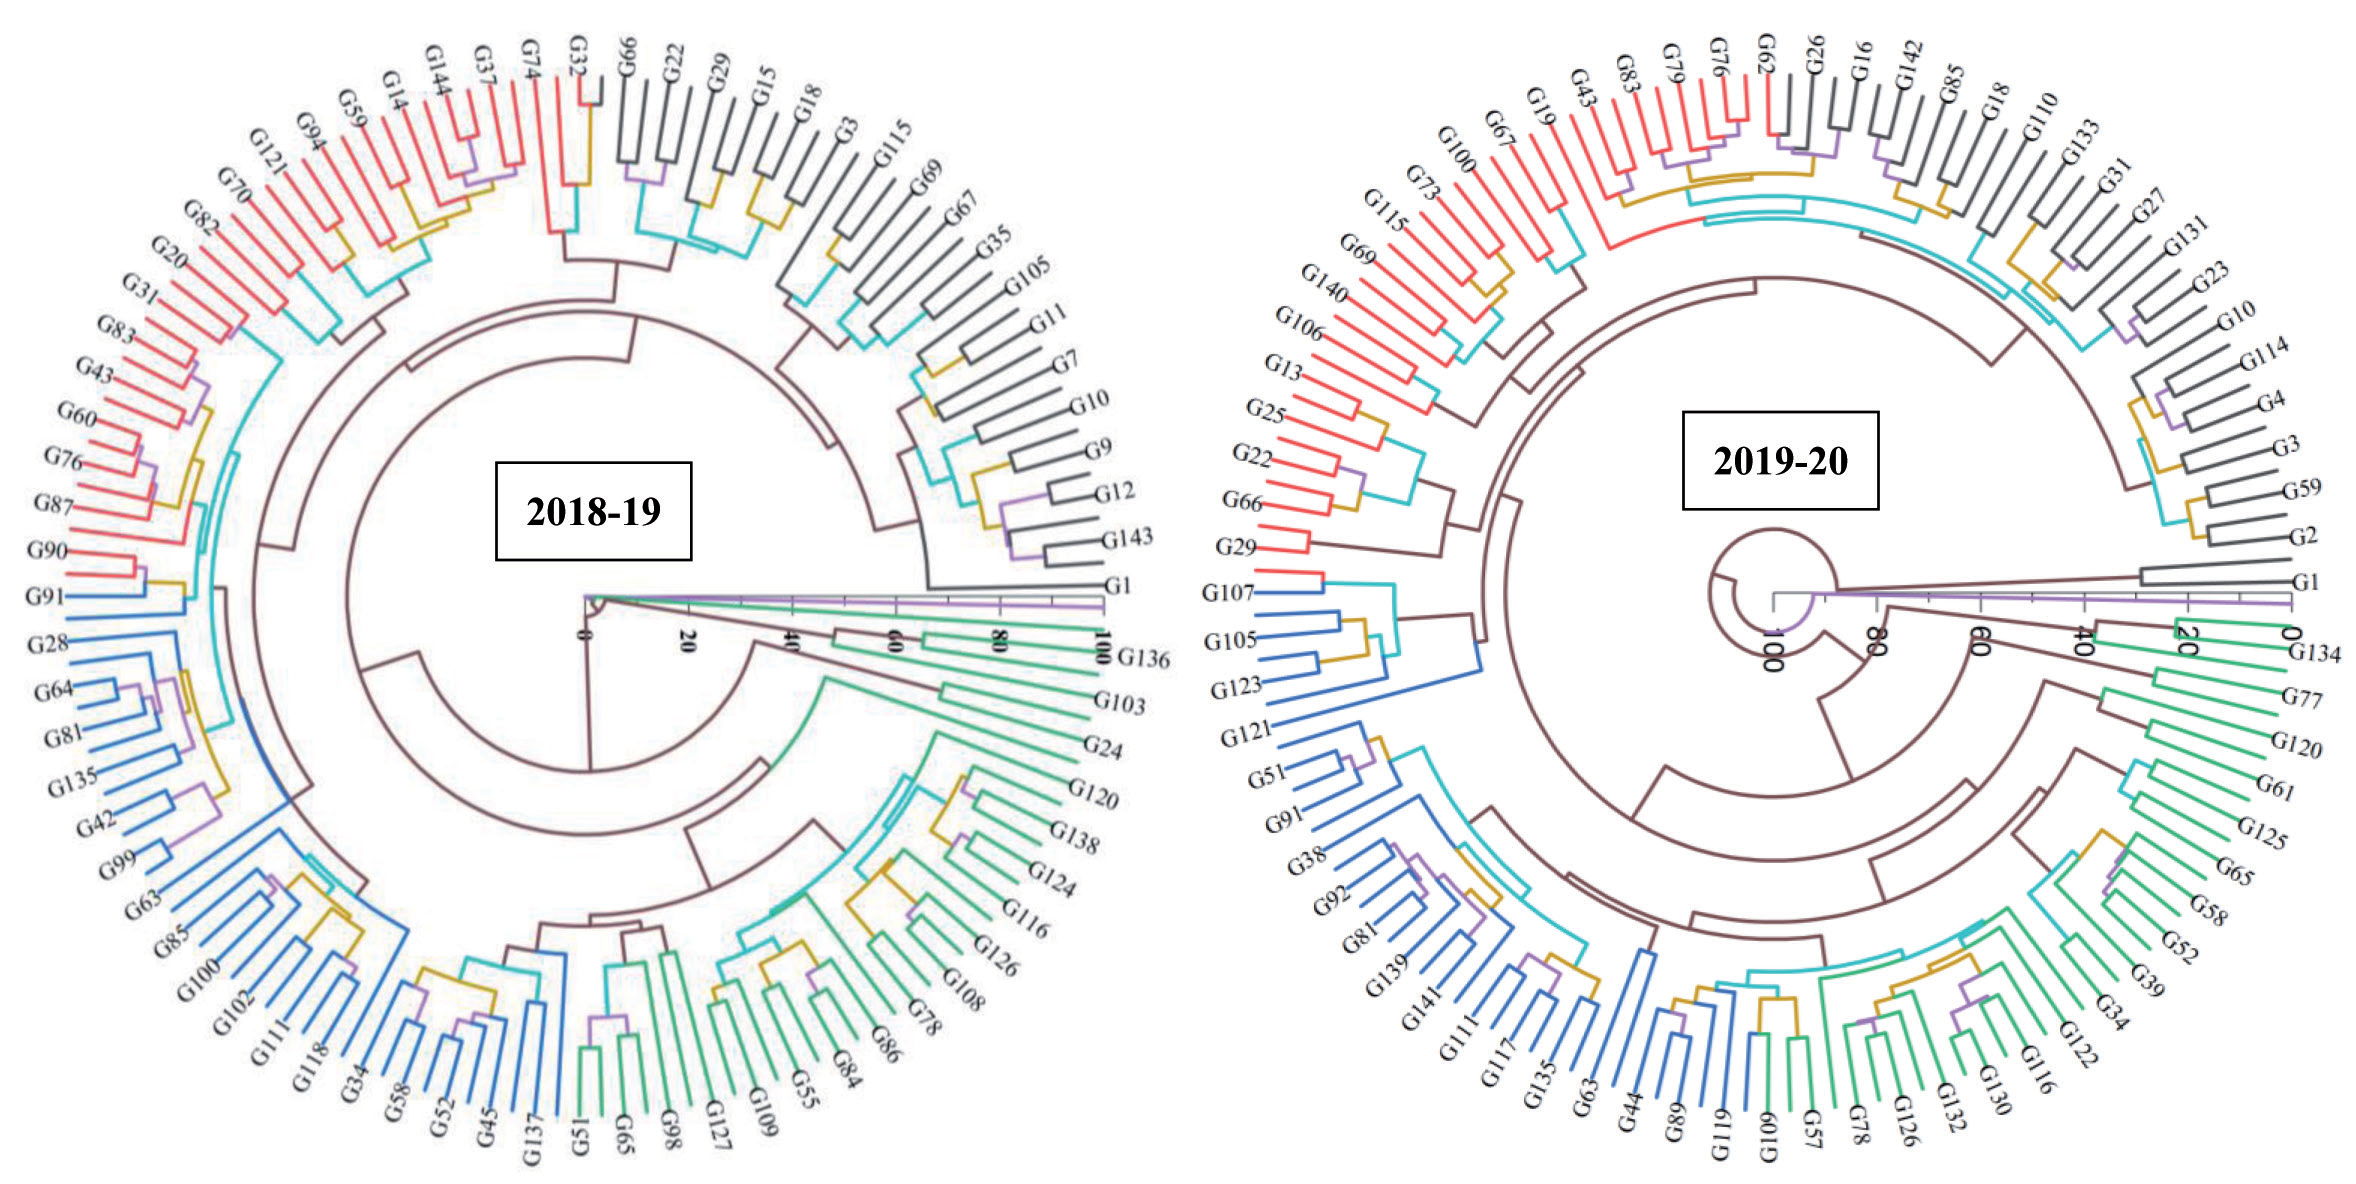
Fig. 4.
Dendrogram of cluster analysis of safflower accessions for various traits i.e. days to 50% flowering (DTF), days to maturity (DTM), plant height (PH, cm), number of branches plant-1 (Bran), number of heads plant-1, thousand seed weight (TSW, g), seed yield (g, plant-1), oil content (Oil%), linoleic acid content (LA%) and oleic acid content (OA%) during 2018-19 and 2019-20.
Utilized Exotic Safflower: A Cluster Analysis
As clear from dendrogram analysis in Figure 4, there were four main clusters and each cluster contained approximately 18 accessions. Accessions within the cluster were uniformly related to one another, whereas accessions belonging to distinct clusters may carry variable or unique characteristics for the clusters in the dendrogram (Figure 4). These different groupings of safflower accessions are utilized in a breeding program to increase genetic diversity and to produce hybrids with greater vigor. Accessions such as G-136, G-74, G-127, and G-63 exhibited higher morphological uniqueness among traits during the two-year study and may be recommended for further investigation under a variety of agroclimatic conditions, in addition to being recommended for use as parental accessions in plant breeding programs by plant breeders (Table 7).
Table 7.
Characteristics of selected safflower accessions in cluster analyses for further breeding on bases of days to 50% flowering (DTF), days to maturity (DTM), plant height (PH), number of branches plant-1 (Bran), number of heads plant-1, thousand seed weight g (TSW), seed yield plant-1, oil content%, linoleic acid content% (LA) and oleic acid content% (OA) during 2018-19 and 2019-20.
Analysis of a Scatter Plot for Safflower Oil Against Plant Height
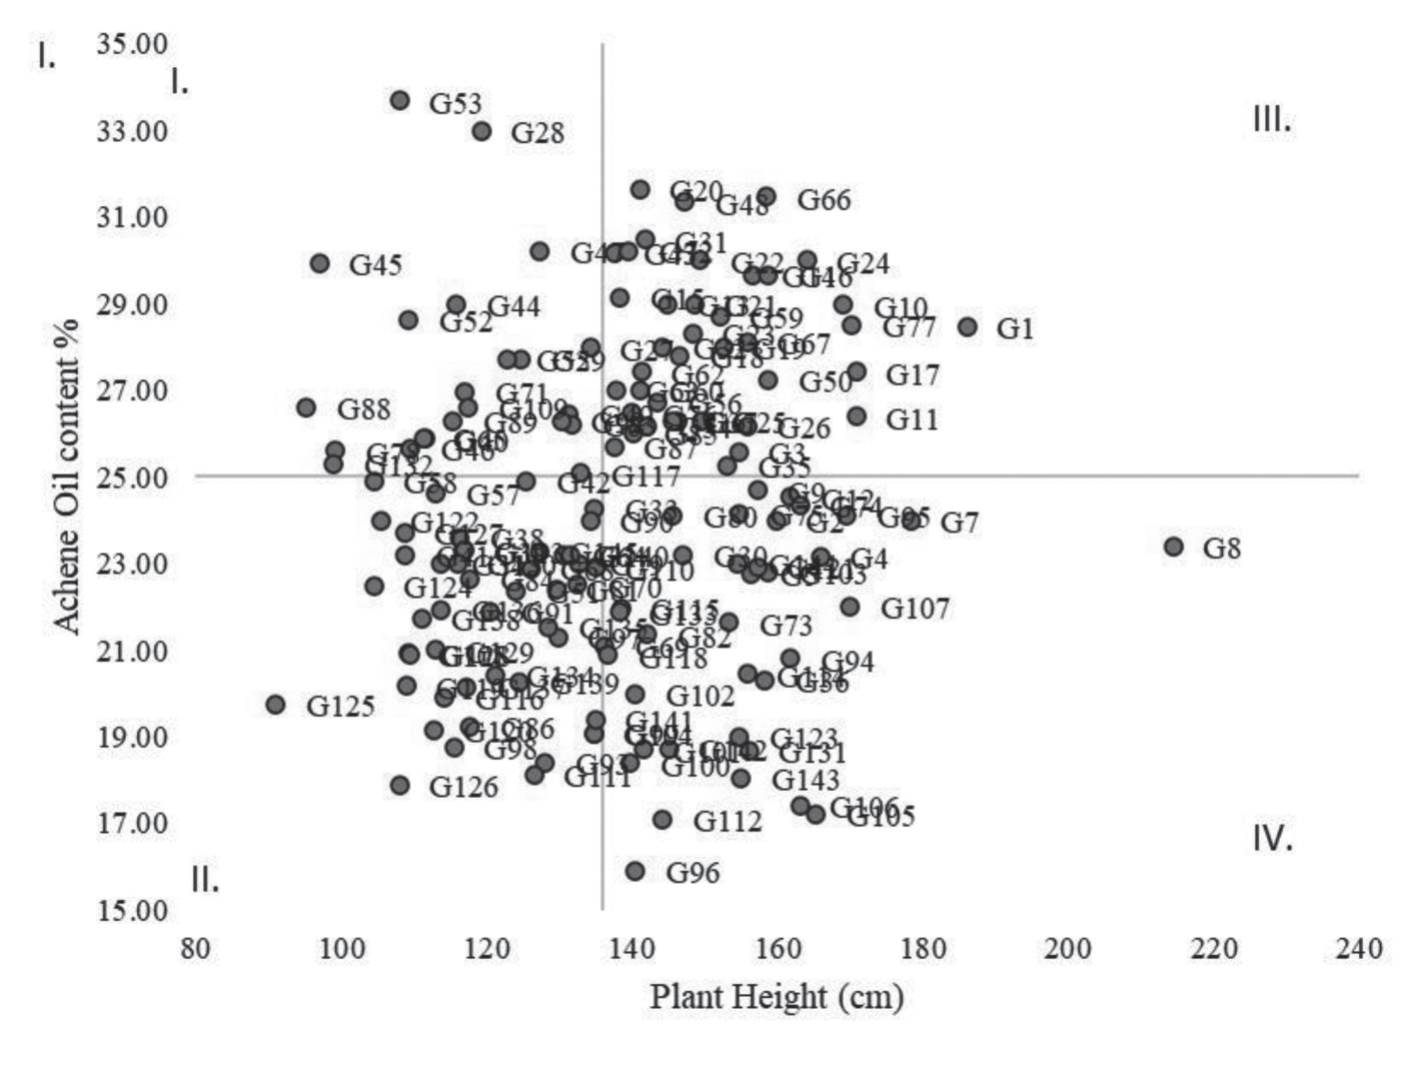
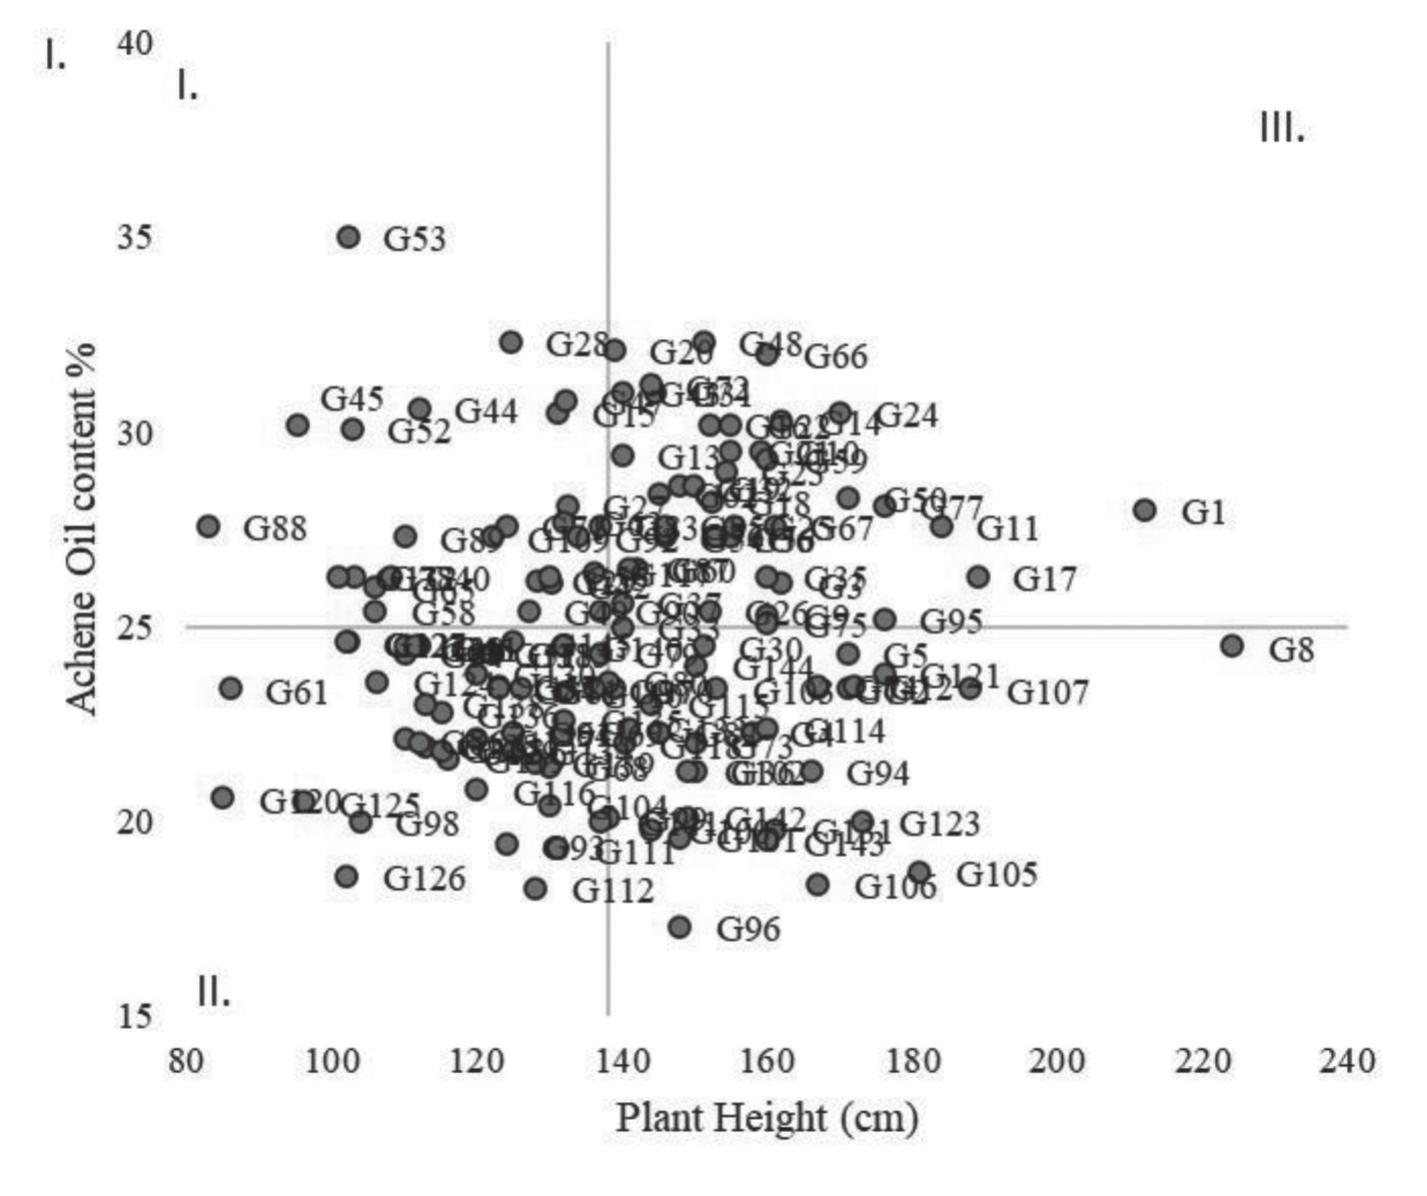
The fluctuation in achene oil % and plant height over 2018-19 was visualized using scatter plot analysis (Figure 5 and 6). The scatter plot diagram was divided into four sections. Component I is in close proximity to a shorter plant height and higher oil content. The accessions G-45, G-53, and G-28 were regarded as more favorable genotypes due to their diminutive plant height and oil content of greater than 30%. G-20 also had high oil content and a medium plant height. Component II was characterized by the accession with low oil content and plant height; G-125, G-126, and G-111 were the accessions with the lowest plant height and oil content. Component III was characterized by accession G-1, which had high oil content and a tall plant height. Component IV was classified as accession G-8, which had low oil content and a tall plant height. In addition, Figure 6 depicts a scatter plot analysis for 2019-20. Component I is in close proximity, exhibiting a higher oil content and a shorter plant height. The accessions G-53 and G-52 exhibited a higher oil content (>30%) with a shorter plant height and are therefore regarded as excellent. Component II, which was characterized by the accessions G-120, G-126, and G-125, had the lowest oil content and plant height, whereas component III, which was characterized by the accessions G-1 and G-17, had the highest plant height and medium oil content, and component IV, which was characterized by the accessions G-8 and G-107, had the highest plant height and lower oil content.
Discussion
Low irrigation water requirements and resilience to poor soil nutrition, saline regimes, and frost exposures made safflower a quality edible oil option for Pakistan-like agroclimatic conditions [27, 28]. In many ecological zones of the country where low rainfall, high soil-borne salt concentrations, and marginal lands are permanent characteristics, safflower’s rapid growth and low irrigation water requirements make it a useful alternative crop for avoiding competition with local cropping patterns [29]. In this study, substantial genetic variability was observed for all introduced safflower traits, especially for number of branches and seed yield (Table 4). As trials revealed, the genetic variability of a trait was influenced by multiple factors, including genotypes, environment, and their interactions. Furthermore, the genetic background, such as the number of loci influencing the traits, also explains the genetic variability associated with the trait of interest. In general, polygenic (affected by numerous loci and environment) traits, such as achene yield plant-1, exhibit continuous variation, which explains the high magnitude of variation within traits.
Characterization of germplasm for phenological traits such as days to maturity and days to 50% flowering revealed limited genetic variability among germplasm and commercial controls (Table 4). The genetic variability of these traits must be increased through interspecific hybridization or mutation [30]. These tools may also be used to develop cultivars with early or medium maturity, which may be advantageous for adaptation to new environments. Correlation analyses of the characteristics highlight the need to develop early or medium-maturing safflower cultivars, as there was a negative relationship between the phenological traits (DTF or DMT) and oil percentage (%) and achene yield plant-1 (Table 5). The negative relationship between phenological traits and oil % or achene yield plant-1 demonstrated that accessions with higher oil content or achene yield had lower days to maturity or days to flower. This may be an adaptation by the accession to avoid the deleterious effects of heat stress during the terminal reproductive phase [31-33].
The low genotypic coefficient of variation for characteristics such as plant height and oil content may explain the oligogenic nature of these plant characteristics. However, there was a broad range of measures among the accessions, from dwarf to tall. Similarly, accessions may also be classified as low-oil or high-oil types. Extreme accessions for oil types with high oil content could be selected to constitute recurrent selection and to intensify advantageous alleles for oil content within single breeding populations [34]. The absence of a correlation between plant height, oil content, and achene yield suggests that these two characteristics are independent of one another, which may facilitate the selection of dwarf plant types with high oil content or yield.
Conclusions
Under Faisalabad conditions of Pakistan, out of 145 accessions of safflower obtained from USDA, G-24 =198990, G-22 =199907, G-13 = 250187, G-32 = 210834, and G-21 = 208677 produced acceptable seed yields while G-66 = 279344, G-48 = 250295, 199907 and 198990 obtained higher oil content. In addition, three accessions (G-77 = 314650, G-21 = 208677, and G-24 = PI-198990) accumulated an excessive amount of (ώ-9), while two exotic accessions (G-66 = 279344 and G-25 = 199873) and Check-31 accumulated an exceptional amount of (ώ-6); these can be chosen as essential characteristics for producing high-quality oil under Pakistani climatic conditions.

