

Introduction
As early as 1997, the Kyoto Protocol specified six major greenhouse gases: carbon dioxide (CO2), methane (CH4), nitrous oxide (N2O), hydrofluorocarbons (HFCs), perfluorocarbons (PFCs), and sulfur hexafluoride (SF6), which have been included in the United Nations Framework Convention on Climate Change. Among them, N2O has extremely stable properties and can exist in the atmosphere for about 150 years [1, 2]. The main hazard of N2O is its destruction of the ozone layer, the formation of ozone holes, and ultimately, the greenhouse effect, which has been regarded as a major contributor to global warming and ozone layer depletion [3]. Research has shown that N2O is growing at a rate of approximately 0.2-0.3% per year. Although the concentration of N2O in the atmosphere is much lower than that of the greenhouse gas CO2, its global warming potential (GWP) is about 310 times that of carbon dioxide, and its contribution to the greenhouse effect is about 6-10%. The emission of greenhouse gases seriously pollutes the environment, resulting in melting glaciers, rising sea levels, changes in climate zones, etc., which has led to species extinction because of the greenhouse effect. The greenhouse effect can also cause rapid changes in local weather conditions, resulting in environmental problems such as high temperatures, heat waves, tropical storms, tornadoes, etc. [4]. Consequently, addressing N2O emissions has emerged as a critical research focus in efforts to mitigate its global warming potential [5].
The main sources of N2O in the atmosphere are the emissions of nature and human activities; the former mainly comes from the ocean [6, 7] and natural soil [8], and the latter mainly comes from human agricultural production activities [9], fossil fuel combustion [10], industrial production emissions [11, 12], and wastewater discharge [13, 14]. The emission of N2O from industrial production is about 0.9Tg/year, accounting for 15-20% of the total direct anthropogenic emissions [4, 9, 11], which mainly come from chemical production processes such as nitric acid, nylon-66, and adipic acid. Among them, the emission of N2O from adipic acid plants accounts for about 70-80% of the total industrial exhaust emissions [15]. Although the proportion of N2O generated from industrial exhaust to total human emissions is relatively low, with the development of industry, the demand for chemical products has gradually increased, and the proportion of N2O generated from industrial exhaust to total human emissions has gradually increased. Countries around the world have been paying more and more attention to reducing N2O emissions from industrial exhaust. In China’s 14th Five-Year Plan of Clean and Efficient Utilization of Coal Technology, it is further required to reduce the pollutant emissions from coal combustion significantly. The value of N2O emission is limited to 80 mg/Nm3, which has not yet been met by many coal-fired power plants. It is, therefore, imperative to develop N2O emission reduction technology that takes NO into account to explore a completely integrated pollutant management method [16, 17]. The chemical properties of N2O are extremely stable, and how to decompose or treat it to reduce its impact on air pollution has been a research hotspot in the field of chemical engineering in recent years.
Currently, the reported N2O emission reduction technologies mainly include separation and purification [15], thermal decomposition [18], selective catalytic reduction using reducing agents such as H2, CH4, CO, and NH3 [19-22], and catalytic decomposition [23]. The cost of separation and purification technology is high, and direct thermal decomposition technology can only be achieved under high-temperature conditions, resulting in significant equipment investment. Although selective catalytic reduction could catalyze the decomposition of N2O at lower temperatures, the use of some reducing agents could lead to the production of the greenhouse gas CO2, which is not conducive to energy conservation and emission reduction. It is generally believed that catalytic decomposition is a promising technology for N2O emission reduction. The reported catalytic decomposition methods mainly focus on precious metal catalysts [24, 25], hydrotalcite-like catalysts [26], and supported transition metal oxide catalysts [27-31]. So far, the domestic N2O decomposition catalyst technology is still in the development stage, mostly in small-scale research. Therefore, developing high-performance N2O decomposition catalysts to reduce greenhouse gas emissions is of great significance for the goal of achieving a carbon peak before 2030 and carbon neutrality before 2060 in China. This article basically reported the use of the composite metal oxides of nickel and manganese supported on SiO2 to achieve N2O decomposition.
Materials and Methods
Materials
All of the SiO2 powder, nickel (II) nitrate hexahydrate [Ni(NO3)2·6H2O], and 50% manganese (II) nitrate aqueous solution [Mn(NO3)2] are analytical grade (AR) provided by Sinopharm Chemical Reagent Co., Ltd., China. Nitrogen (N2) and oxygen (O2) are both produced by Tangshan Zhongsheng Industrial Gas Co., Ltd., China, with a purity of 99.99 (v/v)%. Nitrous oxide (N2O), produced by Luoyang Feilier Special Gas Co., Ltd., China, has a purity of 99.999 (v/v)%. The deionized water used in the experiment was prepared by using the Milli-Q ultrapure water system in the laboratory (conductivity≤0.055 μS/cm).
Sample Preparation
The catalysts used in this study were prepared by the impregnation method. The SiO2 used was ground and sieved to obtain a carrier with a mesh size of 40-20 (0.425-0.850 mm), which was firstly dried in a drying oven at 110-120ºC lasted for 10-12 hr. A suitable precursor aqueous solution based on the preprepared catalyst components and content was prepared, and the solution was sonicated at room temperature for 0.5-2.0 hr to ensure the formation of a uniform precursor aqueous solution before use. During the impregnation process, the prepared precursor aqueous solution was first transferred into a beaker, which was located in a constant temperature water bath at 45.0±5.0ºC; then, the prepared SiO2 carrier was slowly added to the precursor solution under stirring conditions. After the SiO2 carrier was completely added to the precursor solution while stirring continuously for 0.5-1.0 hr, it was filtered and dried in a drying oven at 105-110ºC for 16-24 hr. Then, the precursor catalyst was treated at 550ºC for 4-6 hr in a muffle furnace through the programmed heating method. After calcination, the sample with 40-20 mesh was collected and used to evaluate its catalytic decomposition performance of N2O. The content of active components was determined by X-ray fluorescence spectroscopy (XRF) analysis.
Characterization
The specific surface area and pore structure were analyzed by using N2 adsorption/desorption on a Micromeritics ASAP 2460 analyzer. X-ray fluorescence spectroscopy (XRF) was performed using a Philips Magix PW2424 X-ray fluorescence spectrometer, and X-ray diffraction (XRD) was performed on a Rigaku SmartLab X-ray diffractometer by using CuK alpha radiation, tube voltage of 40 kV, and tube current of 100 mA. The microstructure of the photocatalyst before and after the reaction was observed using a Hitachi S-4800 scanning electron microscope (SEM) with an acceleration voltage of 5.0 kV during the imaging process. The Temperature Programmed Reduction (H2-TPR) analysis was performed on an AMI-300IR fully automatic chemical adsorption instrument. 0.1 g (40-60 mesh) of catalyst was placed in a microreactor and pretreated at the temperature of 150-300ºC in an argon atmosphere for 30 min. After cooling to room temperature, it was switched to an H2/Ar atmosphere as well, and the baseline stabilized. The temperature was raised to 800ºC at a rate of 10-20ºC/min. The hydrogen signal of the reaction tail gas was detected online by using a GAM 200 gas mass spectrometer (Inprocess Instruments, Germany).
Activity Evaluation
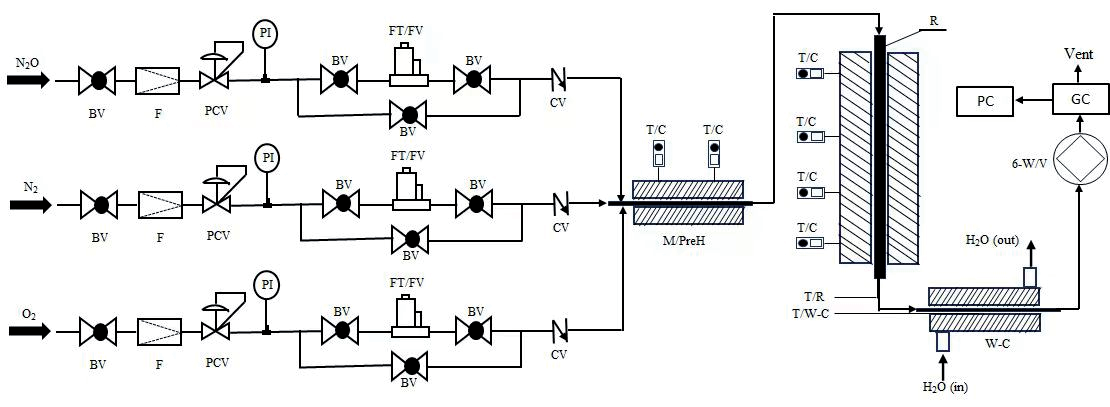
The performance of catalytic decomposition of N2O was evaluated in a fixed bed reactor system, and the experimental setup is shown in Fig. 1. The reactor material was made of 310S stainless steel with an inner diameter of 8.0 mm. The outlet of the reactor was connected to a cooler, and the reaction products were condensed and entered the gas-liquid separator. The gas mixture was discharged through a back pressure valve and accumulated through a metal float flowmeter. It could be directly analyzed by gas chromatography by switching through a four-way valve. It was analyzed by using gas chromatography GC-2010 PLUS (Shimadzu), with a 5A molecular sieve and Porapak Q packed column, and a TCD detector. The conversion ratio or activity of the catalyst was calculated based on the following method.
N2O conversion (%) = (N2Oconversion(in)
– N2Oconversion(out))⁄(N2Oconversion(in)) × 100%
Results and Discussion
SiO2-supported catalysts with different NiO contents were first prepared by using the impregnation method. The designed contents (wt) supported on SiO2 were 4.0%, 8.0%, 12.0%, 16.0%, and 20.0%, respectively. X-ray fluorescence spectroscopy (XRF) results indicated that the actual loadings of NiO were 4.01%, 7.96%, 12.05%, 15.68%, and 19.69%, respectively, which was basically the designed value. In the following discussion, the loadings of NiO in the series of catalysts were based on the designed value for the reason of simplicity.
The specific surface areas of the carrier SiO2 and samples of NiO(4.0%)/SiO2, NiO(8.0%)/SiO2, NiO(12.0%)/SiO2, NiO(16.0%)/SiO2, and NiO(20.0%)/ SiO2 were 292 m2/g, 288 m2/g, 280 m2/g, 275 m2/g, 268 m2/g, and 259 m2/g, respectively. It indicated that the specific surface area of the prepared NiO/SiO2 catalysts gradually decreased with the increase in the content of active components on support. This could probably be because the agglomeration phenomenon of NiO on the surface of the support was gradually increasing as well, and some pores of the support were blocked with the increasing of NiO content, which resulted in a decreasing trend in specific surface area.
The XRD spectra of the prepared catalysts NiO(4.0%)/SiO2, NiO(8.0%)/SiO2, NiO(12.0%)/SiO2, NiO(16.0%)/SiO2, and NiO(20.0%)/SiO2 were shown in Fig. 2, respectively. The broad diffraction peak appearing in 2θ at approximately 22o was the characteristic peak of SiO2 [32], while the appearing diffraction peaks at approximately 37o, 43o, 63o, 75o, and 79o were the diffraction peaks of the face-centered cubic crystal faces (111), (200), (220), (311), and (222) of NiO (JCPDS No. 47-1049), respectively [33, 34]. Using the Scherrer formula, the average particle sizes of NiO on support for catalysts of NiO(4.0%)/SiO2, NiO(8.0%)/SiO2, NiO(12.0%)/SiO2, NiO(16.0%)/SiO2, and NiO(20.0%)/ SiO2 were 12.4 nm, 13.6 nm, 14.5 nm, 15.8 nm, and 16.4 nm, respectively. This indicated that the average particle size of NiO distributed on the SiO2 support showed a slight increasing trend under the experimental conditions of preparation with the increasing of NiO loadings.
Fig. 1.
The schematic diagram of the fixed bed reactor used for catalyst performance evaluation. BV-ball valve, CV-check valve, F-filter, FT/FV-mass flow meter, GC-gas chromatography, H2O(in)-condensate inlet, H2O(out)- condensate outlet, M/PreH-gas mixing preheater, PC-chromatography workstation, PCV-automatic pressure reducing valve, PI-pressure sensor, R-fixed bed reactor, TC-controlled thermocouple, T/R-reactor bed temperature thermocouple, T/W-C-condenser temperature thermocouple, Vent-gas vent. W-C-water-cooled condenser, 6-W/V-gas six way valve.
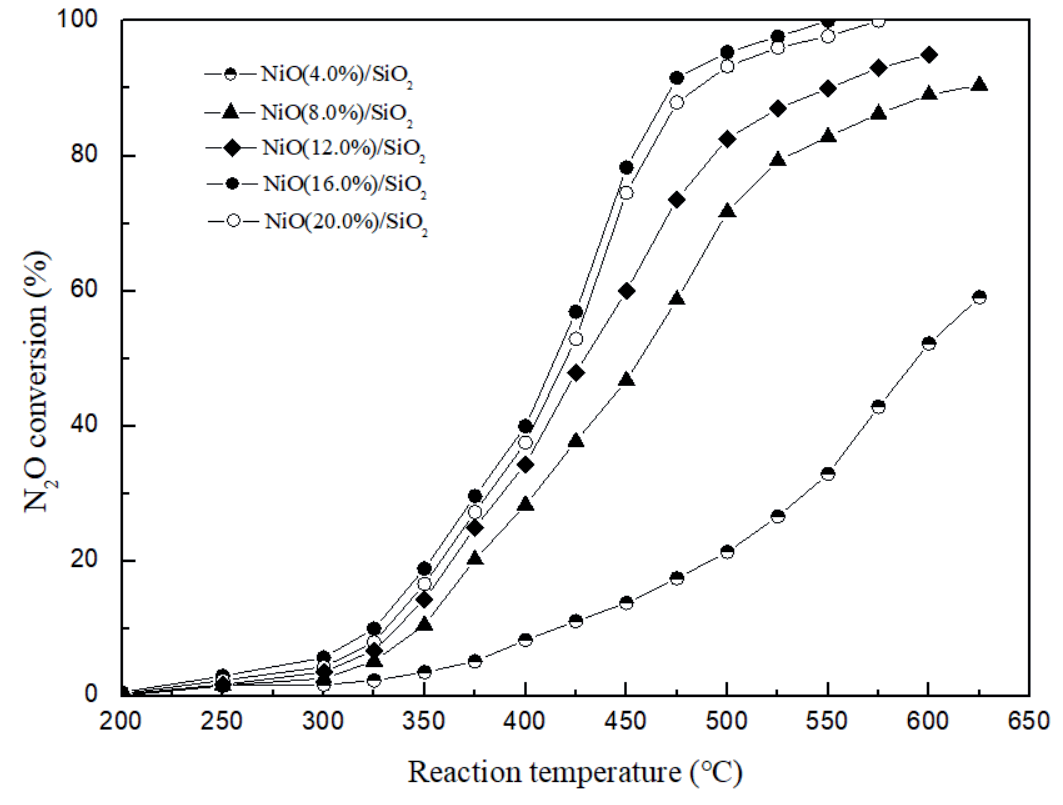
The conversion ratio of N2O decomposition over the above prepared NiO(x%)/SiO2 catalysts was shown in Fig. 3 as a function of reaction temperature. The experimental conditions are listed below: gas composition (v/v) 14.6% N2O+55.2% N2+30.2% O2, volume space velocity of 5000 h-1, and system pressure of 0.1 MPa. The experimental results showed that the activity of decomposing N2O over the prepared NiO(x%)/SiO2 catalysts was basically increasing with the increasing loadings of NiO on support under the experimental conditions of preparation and performance evaluation used. It showed that when the NiO loading reached 16.0 (wt%), further increasing the loadings of NiO slightly decreased its activity of the catalyst for decomposing N2O, indicating that the NiO(16.0%)/SiO2 catalyst had the best performance on N2O decomposition under experimental conditions used with 16.0 (wt%) loadings of NiO on SiO2 support.
The results of the specific surface area showed that for NiO(x%)/SiO2 catalysts, as the increasing content of active component of NiO on support, the specific surface area of NiO(x%)/SiO2 catalysts gradually decreased, indicating that for supported catalysts the variation of specific surface area occurring within a certain range, it did not significantly affect the activity of the catalysts on N2O decomposition. XRD characterization results indicated that for the NiO(x%)/SiO2 catalysts when the amount of NiO loadings was relatively small, the active components were well dispersed on the support, which could fully use the catalytic function of the active components. At the same time, the amount of active component loadings would have a significant effect on the number of active centers. Taking into account the dispersion state of the active components on support and the number of active centers, the NiO(16.0%)/ SiO2 catalyst showed the best performance on N2O decomposition under experimental conditions. The experimental results showed that under the above experimental conditions, the conversion ratio of N2O on NiO(16.0%)/SiO2 catalyst reached 100% when the reaction temperature was about 550ºC.
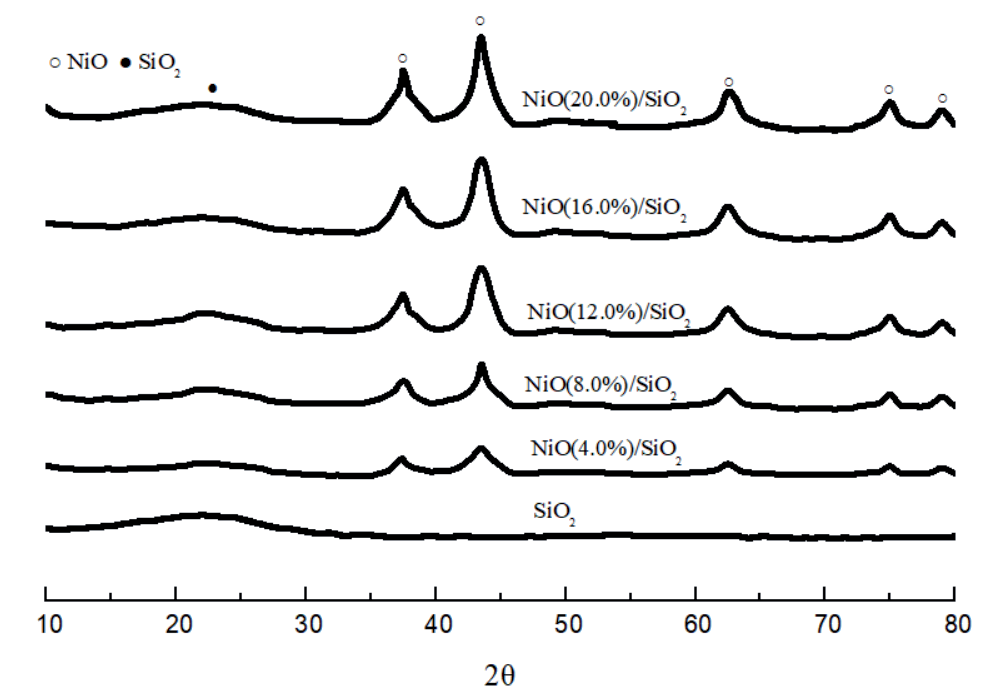
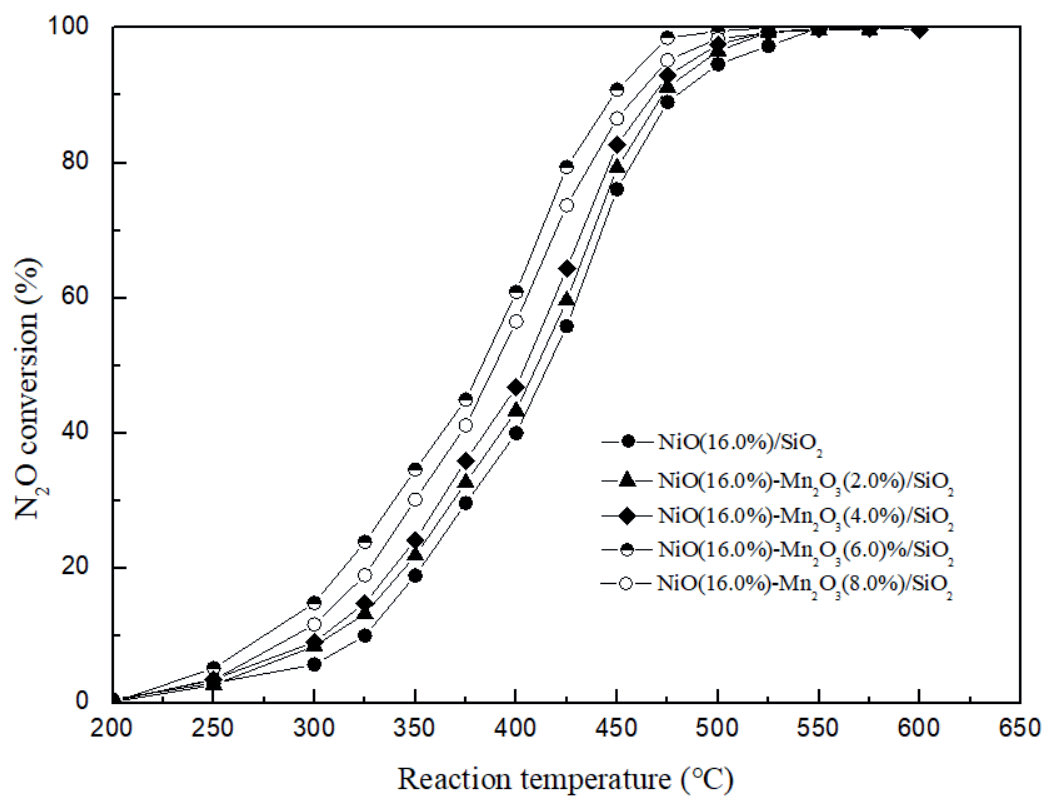
Fig. 3.
The variation of N2O conversion with reaction temperature on the prepared NiO(x%)/SiO2 catalysts.
A series of NiO(16.0%)-Mn2O3/SiO2 catalysts were prepared based on the above experimental results. The designed contents (wt) of Mn2O3 supported on NiO(16.0%)/SiO2 were 2.0%, 4.0%, 6.0%, and 8.0%, respectively, which was basically the same as the actual value through comparing with XRF results. In the following discussion, the loadings of active components in the series of catalysts were still based on the designed value for the reason of simplicity, including NiO(16.0%)-Mn2O3(2.0%)/SiO2, NiO(16.0%)-Mn2O3(4.0%)/SiO2, NiO(16.0%)-Mn2O3(6.0%)/SiO2, and NiO(16.0%)-Mn2O3(8.0%)/SiO2, in order to further investigate the possibility of improving the activity of supported NiO/ SiO2 catalyst on N2O decomposition. Sequentially, the specific surface areas of the prepared samples were 243 m2/g, 238 m2/g, 226 m2/g, and 219 m2/g, respectively, which indicated that the specific surface area of the prepared samples was slightly decreasing with the increase of Mn2O3 on NiO(16.0%)/SiO2 under experimental prepared conditions, while compared with traditionally supported catalysts, the prepared samples still had relatively large specific surface area.
XRD spectra of the prepared series of samples of NiO(16.0%)-Mn2O3(y%)/SiO2 were shown in Fig. 4, which showed that it did not obviously appear in the characteristic peaks belonging to Mn2O3 on the XRD spectrum when the loading of Mn2O3 was 2.0% and 4.0%, respectively, which was probably because the Mn2O3 crystalline structure did not clearly form when the loading of Mn2O3 was lower under the prepared experimental conditions used. It showed two characteristic diffraction peaks at approximately 33o and 35o at 2θ when the loadings of Mn2O3 were 6.0% and 8.0%, respectively, which could be the diffraction peaks of Mn2O3 (222) and (123) crystal planes (JCPDF No. 78-0390), respectively [35,36].
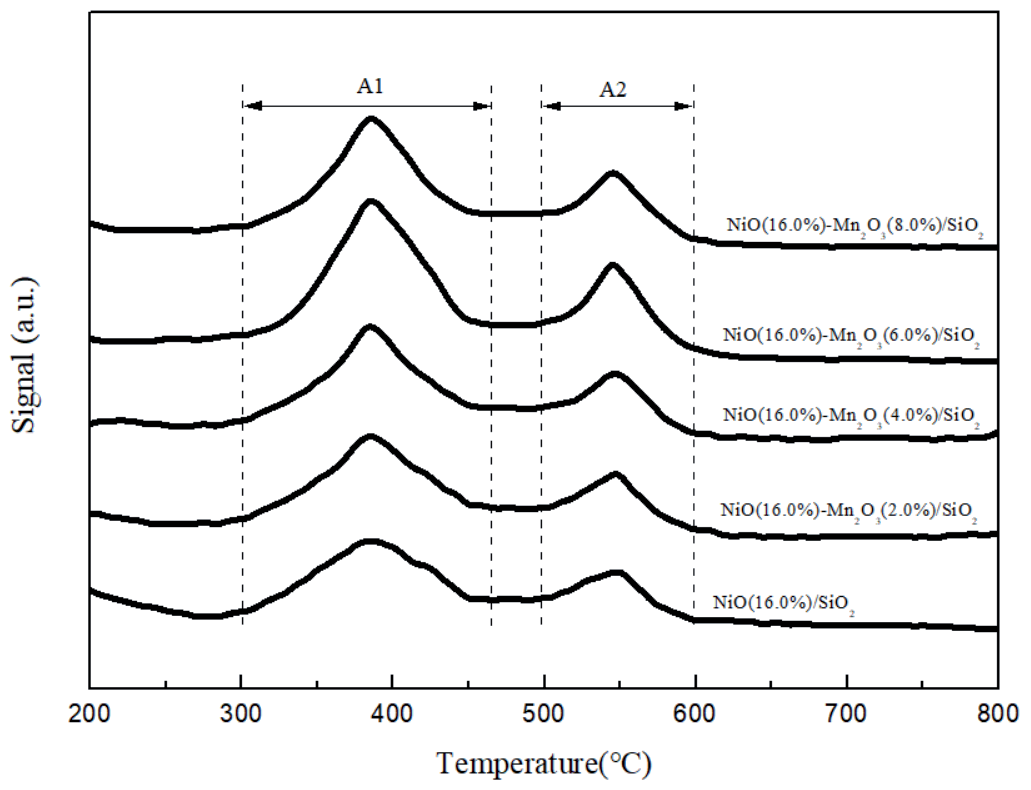
In order to investigate the ability of reduction for the prepared NiO-Mn2O3@SiO2 samples, H2-TPR performance performed on the prepared series of catalysts of NiO(16.0%)-Mn2O3(y%)/SiO2 was tested, and results were shown in Fig. 5, respectively. The results showed that there were mainly two H2-TPR hydrogen consumption peaks at approximately 300-470ºC and 510-620ºC for the catalysts of NiO(16.0%)-Mn2O3(y%)/SiO2 with different loadings, respectively. The hydrogen consumption peak at a low temperature of 300-470ºC could be attributed to the weak interaction between NiO and the support of SiO2 in the free state of NiO, while the hydrogen consumption peak at a high temperature of 510-620ºC could be attributed to the strong interaction between NiO and the support of SiO2, respectively [37].
The peak area related to the hydrogen consumption at low-temperature (300-470ºC) (A1) and high-temperature (510-620ºC) (A2) were calculated, respectively, by using Origin peak integration (Table 1). It showed that the peak area of hydrogen consumption (A1) and (A2) both increased with the increasing content of Mn2O3 with the loading of Mn2O3 (wt%)≤6.0%, indicating that the ability to reduce for the catalysts increased with the increasing content of Mn2O3. However, it showed that the peak area of hydrogen consumption (A1) and hydrogen consumption (A2) was actually decreased when the content of Mn2O3 (wt%) was higher than that of 6.0%, indicating that the ability to reduce for the catalyst was decreased with the further increasing the content of Mn2O3 when the content of Mn2O3 was higher than that of 6.0%. This implied that the sample of NiO(16.0%)-Mn2O3(6.0%)/SiO2 had the best ability of reduction for the prepared catalysts of NiO(16.0%)-Mn2O3(y%)/SiO2 under the experimental preparation conditions used. For N2O decomposition catalysts, research results have shown that the stronger the ability to reduce, the higher the catalytic decomposition activity of N2O under certain experimental conditions [19, 23].
Fig. 4.
XRD characterization results over NiO(16.0%)-Mn2O3/SiO2 samples with different Mn2O3 loadings.
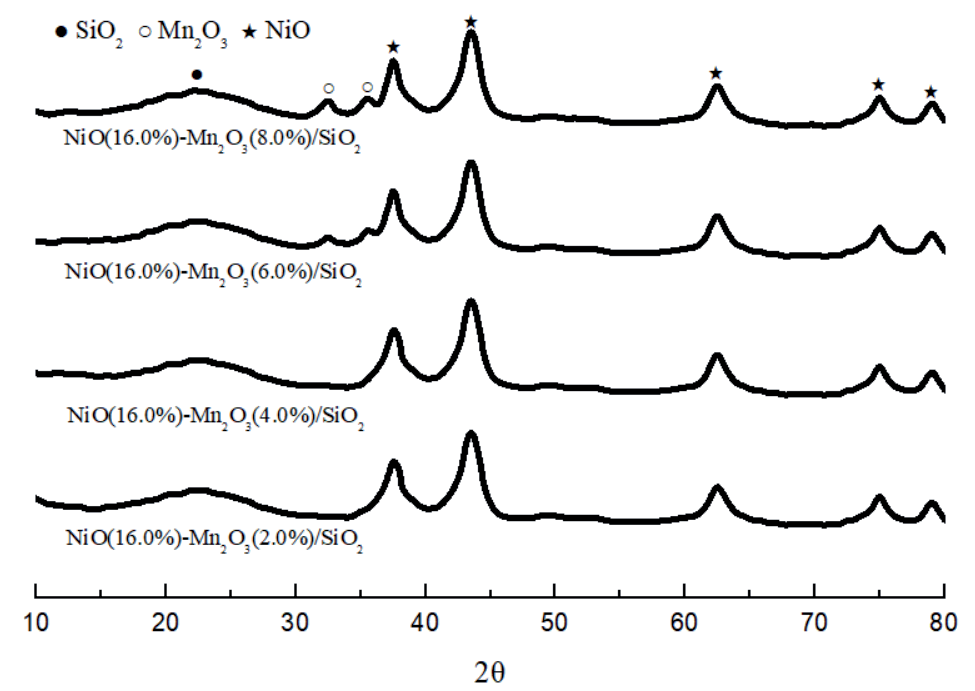
Table 1.
The peak area of hydrogen consumption for H2-TPR over NiO and NiO-Mn2O3@SiO2 catalysts.
Fig. 6 shows the experimental results of the N2O conversion over the prepared catalysts of NiO(16.0%)-Mn2O3(y%)/SiO2 as the function of reaction temperature. The experimental conditions are listed below: gas composition (v/v) 14.6% N2O+55.2% N2+30.2% O2, volume space velocity of 5000 h-1, and system pressure of 0.1 MPa, respectively. It indicated that the catalytic activity performing on N2O decomposition was improved to some degrees under experimental conditions for the supported catalysts of composite NiO-Mn2O3 metal oxides, NiO(16.0%)-Mn2O3(y%)/ SiO2 under experimental condition. Rational design of bimetallic catalysts has progressed in recent studies owing to the understanding of synergy and strong mutual interaction between metal oxide species [38]. The theoretical analysis results of the relationship between the ionization potential (ev) and the ratio of effective nuclear charge/ion radius for the representative oxides of transition and alkali metals indicated that NiO and Mn2O3 belong to alkaline oxides and amphoteric metal oxides, respectively [39]. Further research showed that the catalytic performance of composite metal oxides prepared by doping modification of alkaline metal oxides with amphoteric metal oxides was better than that of single alkaline metal oxides or amphoteric metal oxides [40, 41]. Meanwhile, according to the mechanism of N2O catalytic decomposition [42, 43], the desorption of O* on the active sites (*) from the catalyst surface would play an important role in the catalytic decomposition of N2O, while the surface of Mn2O3 metal oxide could provide abundant of O active sites. Therefore, the catalysts of NiO-Mn2O3/SiO2 prepared under experimental conditions would have better performance on N2O decomposition than that of NiO/ SiO2 catalysts, which was basically consistent with the experimental results (Fig. 6).
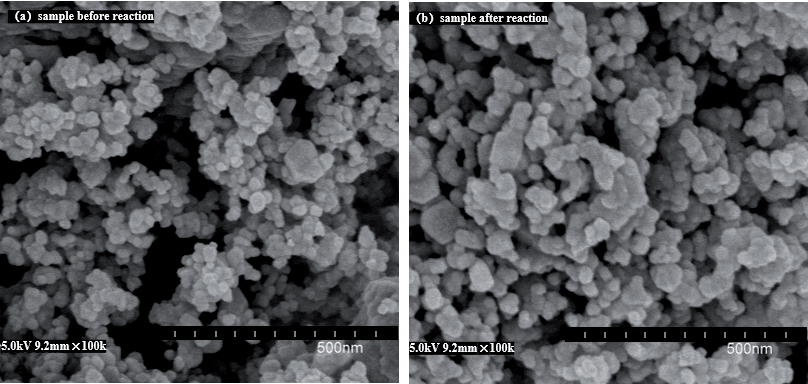
The experimental results in Fig. 6 also indicated that the activity of the prepared NiO(16.0%)-Mn2O3(y%)/ SiO2 catalyst performing on N2O decomposition was increased with the increasing of Mn2O3 content when the content of Mn2O3 was lower than that of 6.0 (wt%), while the activity of the prepared NiO(16.0%)-Mn2O3(y%)/ SiO2 catalyst performing on N2O decomposition was decreased with the increasing of Mn2O3 content when the content of Mn2O3 was higher than that of 6.0 (wt%), indicating that it existed an appropriate composition ratio for the synergistic catalytic function between the composite metal oxides of NiO-Mn2O3. Under the experimental preparation conditions, the catalyst prepared for NiO(16.0%)-Mn2O3(6.0%)/SiO2 showed the best activity in N2O decomposition. At the reaction temperature of 525ºC and other experimental conditions used, the conversion of N2O over the catalyst of NiO(16.0%)-Mn2O3(6.0%)/SiO2 was 100%, which was consistent with the H2-TPR characterization results. Under the same experimental conditions used, the conversion of N2O over the catalyst of NiO(16.0%)/SiO2 reached 100% at the reaction temperature of 550ºC. The stability test in the laboratory fixed bed reactor lasted for 100 hr under the following experimental conditions: gas composition (v/v) 14.6% N2O+55.2% N2+30.2% O2, volume space velocity of 5000 h-1, system pressure of 0.1 MPa, and reaction temperature of 525ºC. It showed that the NiO(16.0%)-Mn2O3 (6.0%)/ SiO2 catalyst had good stability for the N2O catalytic decomposition, and the conversion ratio of N2O was 100% under the experimental conditions used. Fig. 7 showed SEM characterization results of NiO(16.0%)-Mn2O3(6.0%)/SiO2 catalyst before and after the reaction lasted for 100 hours, which indicated that there was no significant variation regarding the surface morphology and particle size of the catalyst before and after the reaction, respectively, which also indicated that the prepared sample had good stability for the N2O catalytic decomposition and provided the basis for further relative research.
Fig. 5.
H2-TPR characterization results over NiO(16.0%)-Mn2O3/SiO2 samples with different Mn2O3 loadings.
Conclusions
The activity results performed on NiO(x%)/ SiO2 catalysts showed that under experimental conditions, when the content of NiO was 16.0 (wt%), NiO(16.0%)/SiO2 had good performance over N2O decomposition. Based on this basis, NiO(16.0%)-Mn2O3(x%)/SiO2 catalysts were prepared, respectively. H2-TPR characterization results showed that when the content of Mn2O3 content was 6.0 (wt%), NiO(16.0%)-Mn2O3(6.0%)/SiO2, it exhibited the best reduction performance through H2-TPR. It showed that the prepared catalyst of NiO(16.0%)-Mn2O3(6.0%)/SiO2 had the best activity in N2O decomposition among catalysts of NiO(16.0%)-Mn2O3(x%)/SiO2. At the reaction temperature of 525ºC and other experimental conditions used, the conversion of N2O reached 100% for the catalyst of NiO(16.0%)-Mn2O3(6.0%)/SiO2, which was consistent with the H2-TPR characterization results, while under same experimental conditions used, the conversion of N2O over the catalyst of NiO(16.0%)/ SiO2 reached 100% at the reaction temperature of 550ºC. The experimental results showed that the activity of the composite metal oxides of the NiO-Mn2O3/SiO2 catalyst was superior to that of the single component of the NiO/ SiO2 catalyst.

