

Introduction
Global warming caused by excessive carbon emissions is exerting all-round impacts on human life and has become one of the most severe challenges facing the development of human society at present [1]. Recognized as an important anti-climate change strategy by the world community, carbon trading policy plays a crucial role in both the environmental governance and economic green transition and is being implemented in a growing number of countries [2]. In the carbon market, similar to the role of prices in traditional financial markets, carbon allowance prices (CAP) also serve a basic market regulation function and make a significant influence on CO2 emissions by affecting the behavioral choices of market participants and energy consumption of the whole society [3-5].
The European carbon market, or what could also be called European carbon emissions trading system (EU-ETS), has become the world’s largest and most mature carbon trading market since it was established in 2005 [6-7], and the performance of CAP in the EU-ETS has long been a focus of scholarly research. Based on the analysis of the EU-ETS, available studies have explored the asset attributes of emission allowances [8] and found some obvious characteristics of emission allowance returns, such as skewness, excessive kurtosis, and fluctuation clusters [9-11]. Additionally, by extracting trading information in the EU-ETS, scholars have further revealed CAP changes’ correlation with trading activity of market participants [12] and possible spillover effects to other parties [13].
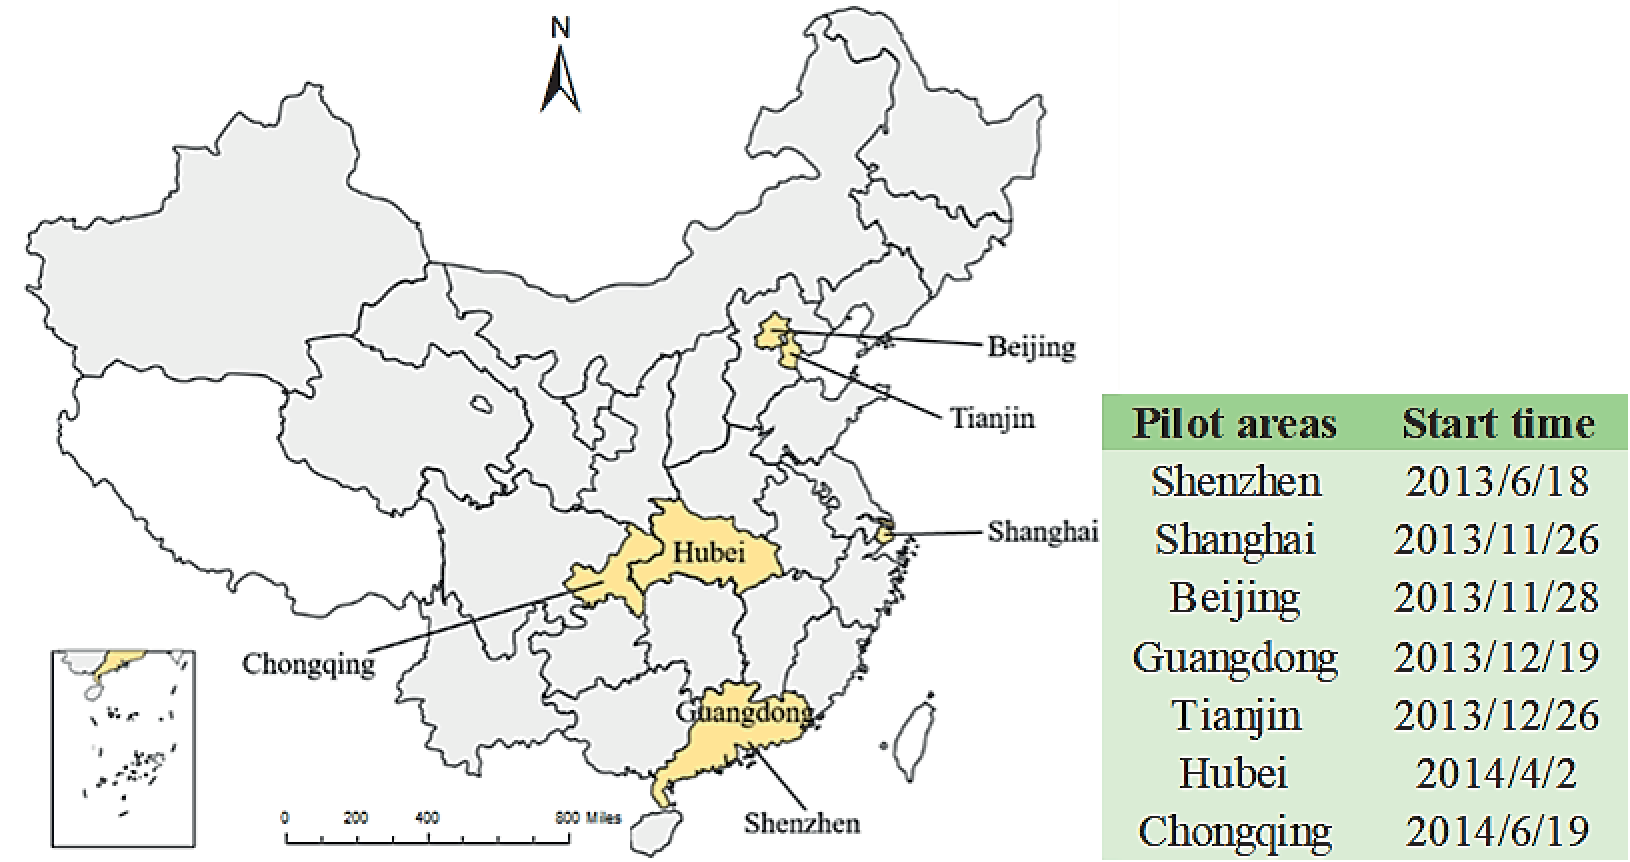
China, as the number one manufacturing country and the contributor of the most CO2 emissions on the planet [14], has attached great importance to global climate change and environmental governance in recent years [15]. As a part of the action plan to achieve peak carbon by 2030 and carbon neutrality by 2060 [16], the carbon emissions trading system (ETS) has been implemented in the first seven pilot regions in China since 2011 [17] (Yellow marked area in Fig. 1), and since then provinces such as Fujian and Sichuan have also been included in China’s carbon pilots over the following five years [18]. According to the distribution of the first batch of ETS pilot cities, it can be found that the selected cities have obvious regional specificities. As can be seen from Fig. 1, Beijing and Tianjin are the representative cities in North China, Guangdong and Shenzhen are the pioneers of carbon trading in South China, Shanghai accumulates experience for carbon trading in developed provinces in East China in the future, and Hubei and Chongqing are the pilots of ETS in central and western China.
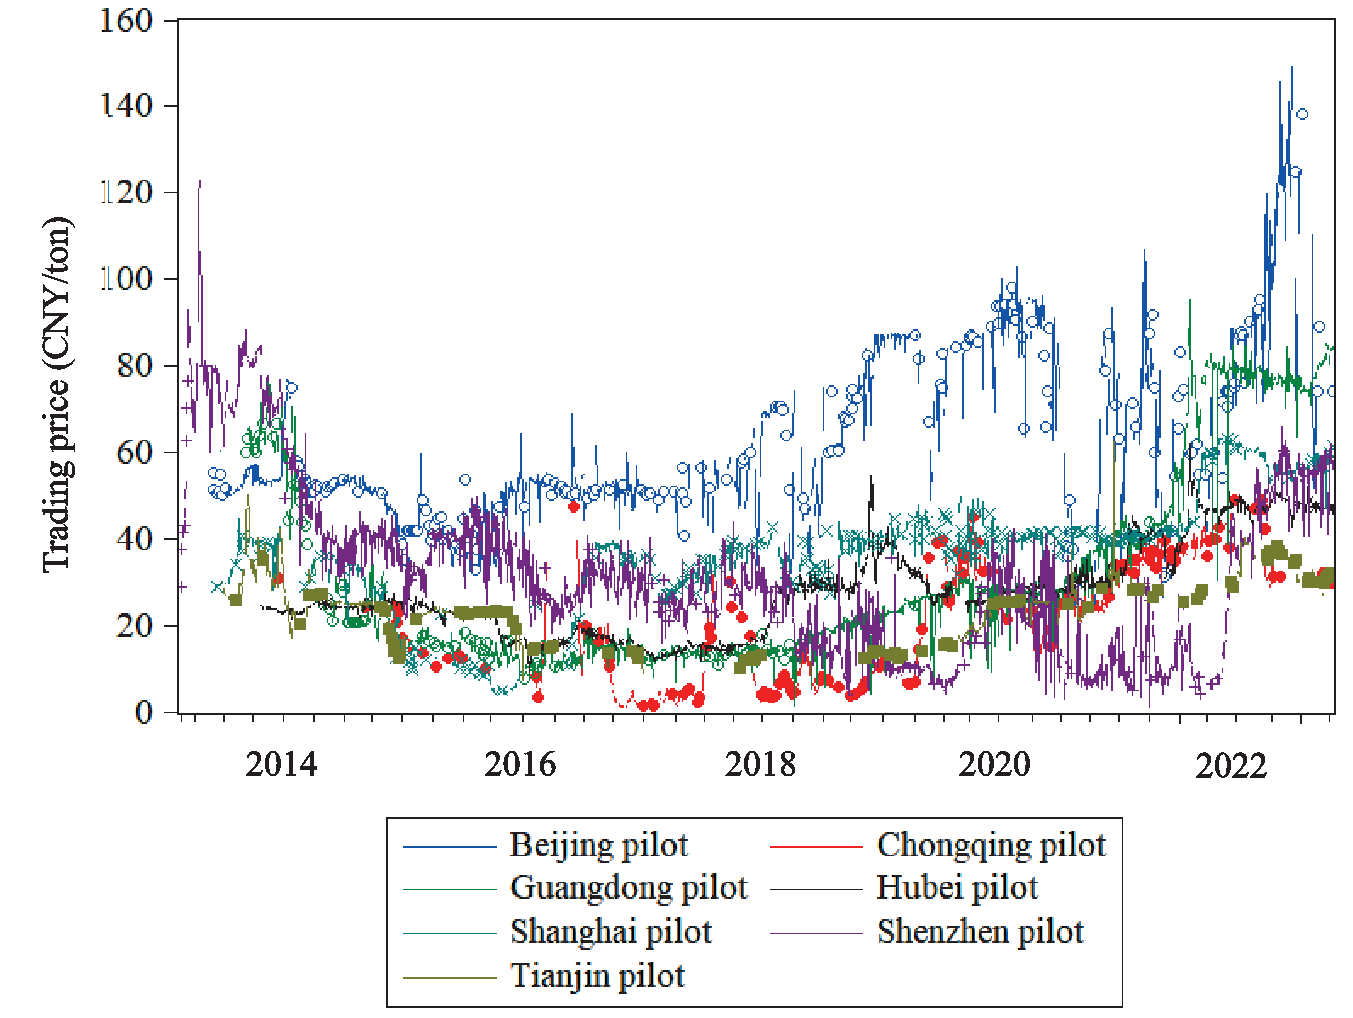
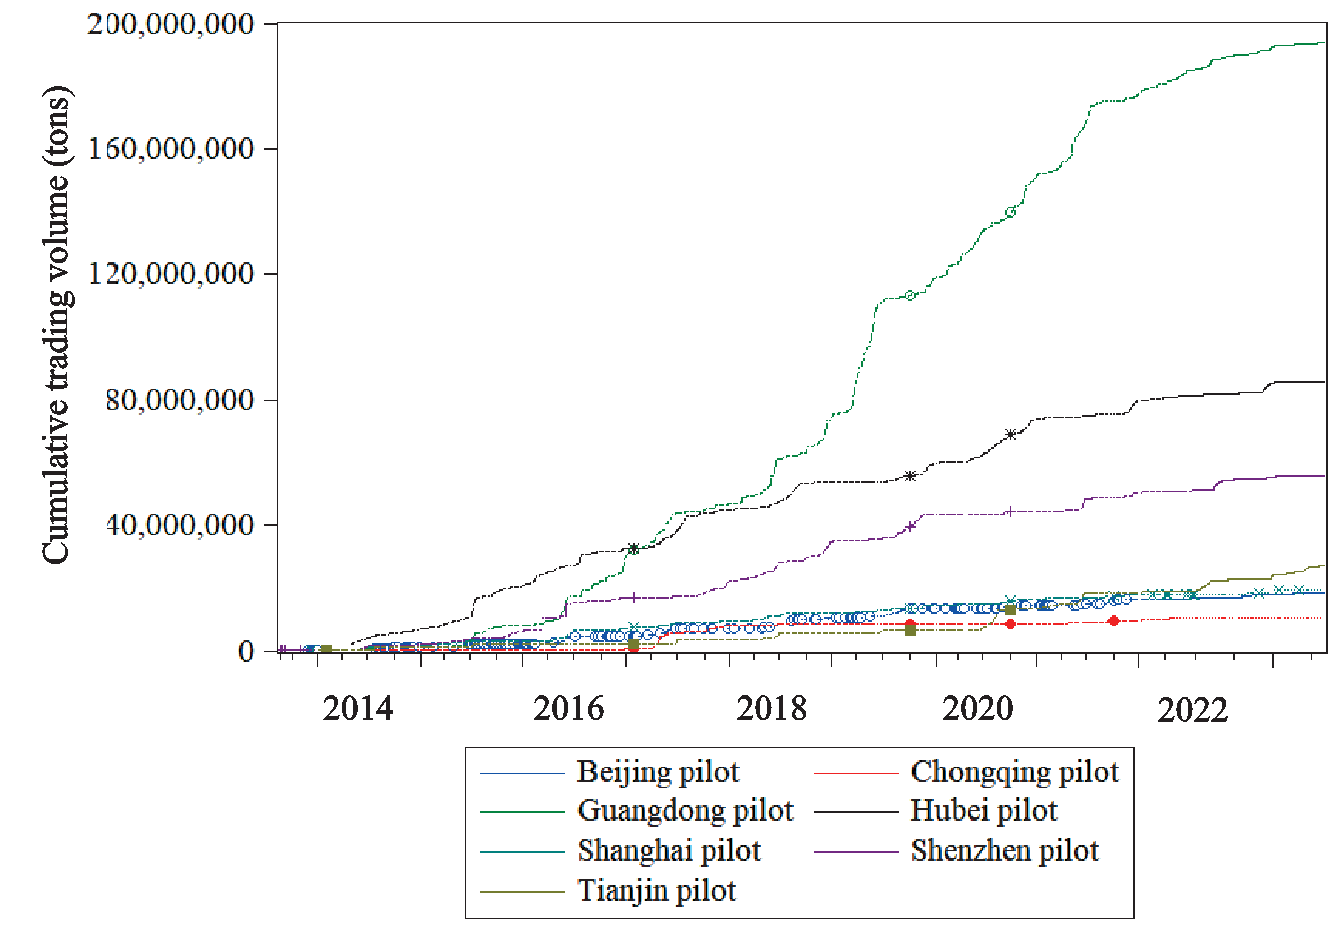
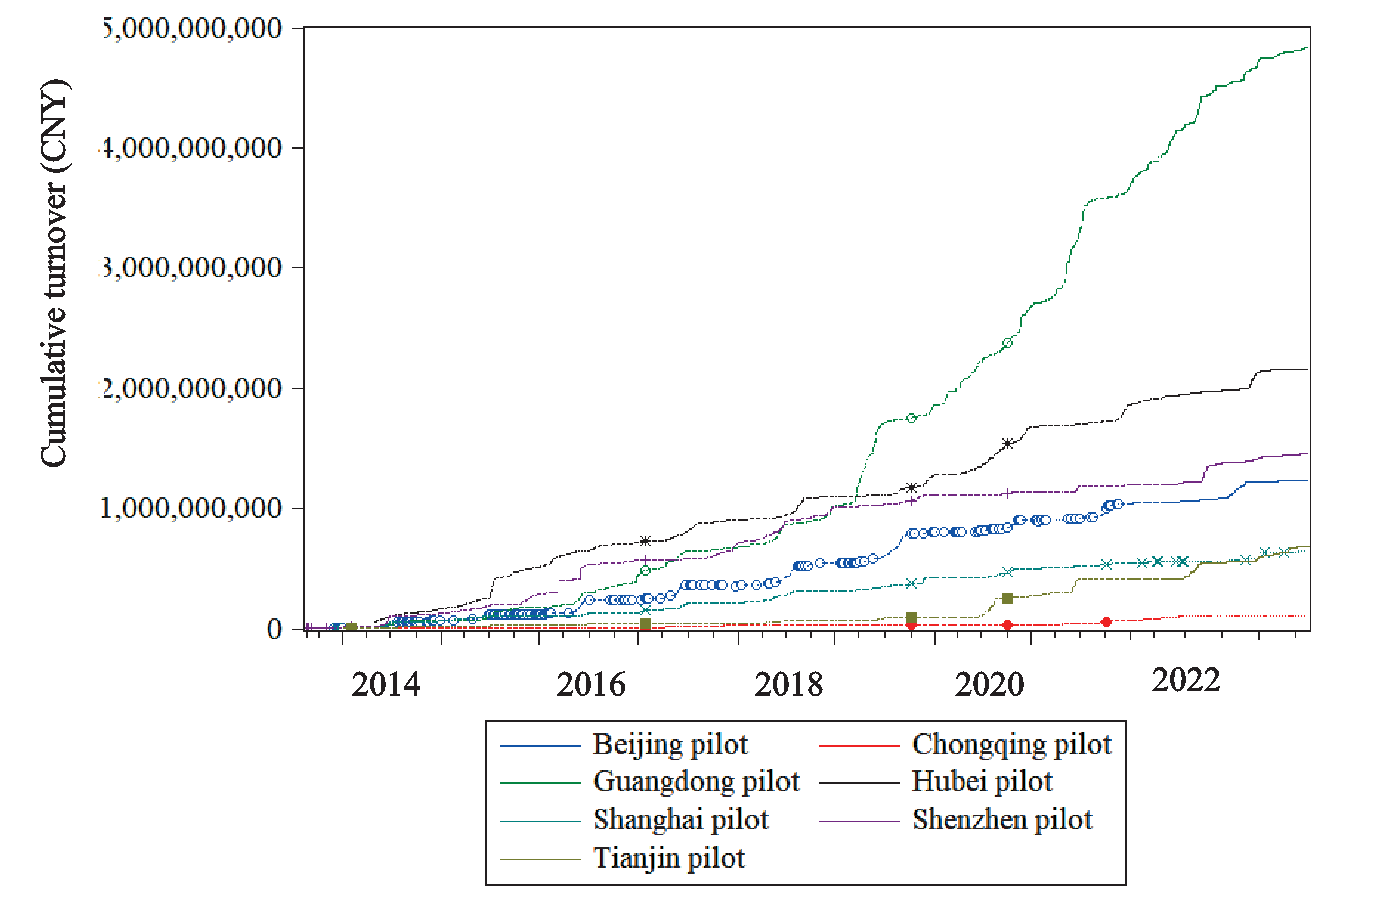
Different economic and social conditions in these pilot regions, such as CO2 emission intensity, level of economic development, industrial structure, etc., also contribute to the heterogeneity in the evolution of CAP in different markets [19]. At the same time, due to the short time of establishing ETS in China, the lack of experience in the pilot regions, the immaturity of the market mechanism and the strong policy dependency, the fluctuation of CAP is very frequent [20]. Figs 2, 3 and 4 respectively show the average price, cumulative trading volume and cumulative turnover of carbon allowances traded since the opening of each ETS pilot. In the trading price section, as shown in Fig. 2, CAP in the seven carbon trading markets roughly experienced three stages: fluctuating decline (2013-2016), low and stable operation (2016-2020) and fluctuating rise (2020-2023), showing non-stationary and non-linear characteristics similar to the traditional financial time series [21]. Further analysis of the trading situation of each ETS pilot shows that there are obvious differences in the operational status of different carbon trading markets. According to Fig. 3 and Fig. 4, the Guangdong, Hubei and Shenzhen pilots are at the top of the group both in terms of volume and turnover, pulling away from the lagging pilots, such as the Tianjin and Chongqing pilots, by a visible margin. The above results not only indicate the obvious differences in the activity and maturity of each pilot market, but also mean that the studies focusing only on individual markets may not be able to grasp the overall trends and characteristics of China’s ETS construction as a whole due to ignoring these gaps.
Fig. 3.
Carbon allowance cumulative trading volume in seven pilot carbon markets (2013/6/19- 2023/3/24).
In the current research on CAP of China, researchers have found the characteristics of kurtosis bias, fat tails, non-normal distribution, wave clustering and long memory in the sequence of CAP returns [22-24], as well as significant price volatility heterogeneity among different pilots [25-26]. In these pre-existing pilot markets, although CAP are generally stable and smoothly transmitted, there are clear price fragmentation between different markets, and fluctuations in a small number of CAP can control price transmission across the whole carbon market [27]. Compared with the carbon markets in the US and Europe, the problems of convergent trading decisions and limited inter-firm liquidity are more pronounced in the pilot carbon markets except Hubei, which is one of the reasons why the CAP volatility in the carbon market departs from the normal level [28]. In terms of external influences factors, the news, government policies, the development of clean energy, stock market, electricity prices and the COVID-19 outbreak have been shown to have a significant impact on CAP trend [29-31] and it is clear that the role of these influencing factors is heterogeneous in different carbon markets [32- 34]. Looking further at individual carbon markets, the researches on the Shenzhen and Hubei carbon markets is more abundant. For Shenzhen, it can be found that the price of carbon credits is more stable and lower, compared to EU-ETS [35]. The volatility of the yield gradually decreases and is negatively correlated with the expected risk [36]. After 2018, however, because of the recession and lack of market information, price volatility began to rise with an asymmetric trend and market trading risks are accumulating [37]. At the same time, there is an interactive correlation between the energy market and the Shenzhen’s carbon market with a multifractal character [38]. As for the Hubei carbon market, studies have revealed the existence of three periods of sharp fluctuations in Hubei’s CAP under the influence of government carbon emission policies and clean energy development policies as well as the outbreak of COVID-19 [39]. Meanwhile, the volatility of CAP returns in Hubei has a significant leverage effect, and negative news has a stronger impact on the market than positive news [40].
Through combing and analyzing the previous literature research results on CAP, it is found that previous studies have focused on mature carbon trading markets in the world, such as the European carbon trading system, or just on a particular carbon trading market in China. Only very few papers have studied multiple markets simultaneously or have used holistic data. From the current studies, there is still a lack of overall understanding of the volatility characteristics or the operation of CAP in China. In particular, there has been no progress in the study of the non-linear structure of CAP fluctuations and the mechanism of regime transition, which is crucial to the study of carbon market risk. The marginal contribution of this paper is to introduce non-linear models into the study of CAP in China's carbon market. The paper identifies the volatility characteristics of CAP by constructing a non-linear model, and conduct a deep excavation of the operation state and mechanism transformation of CAP by using a regime switching model. From a more realistic perspective, China's carbon market, after several years of construction and development, has now become one of the largest carbon markets on the planet, completing the last piece of the jigsaw puzzle in the world's carbon market. As we can see, China's success in carbon market construction not only marks another solid step in China's response to climate change, but also provides a huge boost to global climate governance and carbon emission reduction, and provides Chinese experience and solutions for other countries to achieve their own low-carbon development goals and build a reasonable and efficient carbon market system, which is also the practical significance of the study of China's carbon market for the world.
Materials and Methods
Empirical Model
Threshold Auto-regressive Model (TAR model)
As a type of nonlinear models, TAR model can explain the nonlinear characteristics in financial data, which was first proposed by Tong in 1980 [41]. TAR model sets a particular point in time where the motion of the time series jumps from one regime to another, while this jump is discrete. TAR model has better properties in fitting the actual data, compared with the linear regression model, due to its advantages in effectively identifying the nonlinear dynamic adjustment characteristics and regime transition of the time series [42]. The three-regime multi-order TAR model has the following form:
(1)
In formula (1), φ are autoregressive coefficients σ are standard deviations of noise r are threshold values ρ are lag orders of autoregressive variables and d is the lag order of the transformation variable.
Markov Regime Switching Model (MRS model)
Similar to TAR model, MRS model also has several different regimes, which relies on certain conditions to switch between regimes. Compared to MRS model, the transitions between the regimes of TAR model can be observed more easily and directly. By identifying the transition mechanisms through a simple division of thresholds, TAR model allows for a more intuitive form and structure of the model fit, but this also lacks the ability to capture the details of the dynamics of the transitions within the system. However, in MRS model, the actual state of each regime and the transition details can be observed through probabilistic inference, so it is able to capture the dynamic process of more subtle and complex mechanism transitions [43], which compensates for the inadequate mechanism identification of TAR model.
MRS model assumes that the state of fluctuations can be described by the state at moment t0, thus determining the regime state process of the system at moment t>t0. To obtain the relevant process, we then have to consider the price transformation state at moment t0 as a known price transformation state, i.e., assume that:
In Equation (2), {Xt, t∈T} is the stochastic process. Next, we introduce a random variable St into the system that represents the different regime states that the price is in. Assuming that the price state variable St can only take a positive integer value and the probability that St equals a certain value is only affected by the value of St–1 in the previous period, the distribution function of its price change becomes the following form:
Assuming that yt is the variable representing the price of carbon, the MRS model representing price fluctuations is as follows:
In Equation (4), μSt represents the mean of the series in the state at moment t; φSt represents the autoregressive coefficient at moment t; εt~N(0, σ2); St = 1, 2, ..., k, whose transfer probability can be described by the following transfer probability matrix P:
In Equation (5), 0≤pij≤1, ∑mj=1 pij; i = 1, 2, ..., n; j = 1, 2, ..., m.
The probability density of Xt in state St = i can be written in the following form:
It–1 denotes all the information available up to moment t-1; the vector of parameters to be estimated for the model is Θ, Θ = {μ(1), μ(2), ..., μ(k); σ}.
When the probability f(St = i|It–1) is known, then under the condition that It–1 is known, the probability density of yt takes the following form:
The total log-likelihood function is expressed in the following form:
The filtering probability of St is as follows:
The smoothing probability1 is calculated as follows:
There are three methods to estimate the parameters of MRA model: Hamilton’s maximum likelihood estimation [44], Hamilton’s EM algorithm [45], and Albert and Chib’s Gibbs sampling algorithm [46]. In general, the EM algorithm is difficult to implement when there is an AR term present in the model, while the Gibbs sampling algorithm requires a large number of operations. Therefore, the paper chooses the maximum likelihood algorithm to estimate the parameters of the model.
Data Source and Processing
In terms of data source, we consider that carbon trading activities are mainly carried out in pilot regions, and different carbon trading markets have different CAP. In order to reflect the overall performance of CAP in China’s carbon market, the paper selects the China’s Carbon Market Value Index (CCMVI), which is developed by Beijing Green Finance Association (BGFA) and published by China Beijing Green Exchange (CBGE), as a comprehensive indicator to reflect the dynamic changes of CAP in China’s carbon market. CCMVI is compiled by taking the average price of carbon emission allowances traded online in six carbon trading pilot regions, including Beijing, Tianjin, Shanghai, Guangdong, Hubei and Shenzhen, which are already traded in the market, as a sample to measure the changes of the overall CAP in the sample regions within a certain period2.
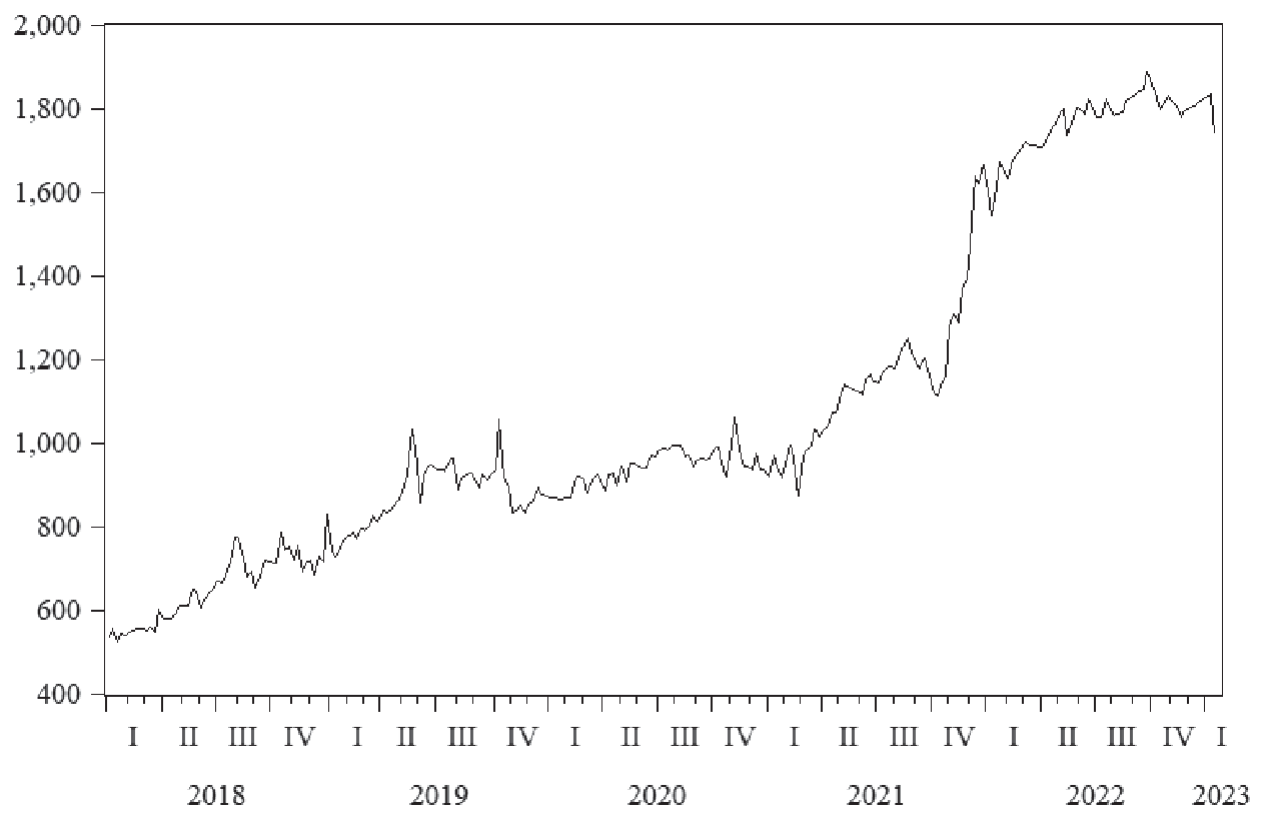
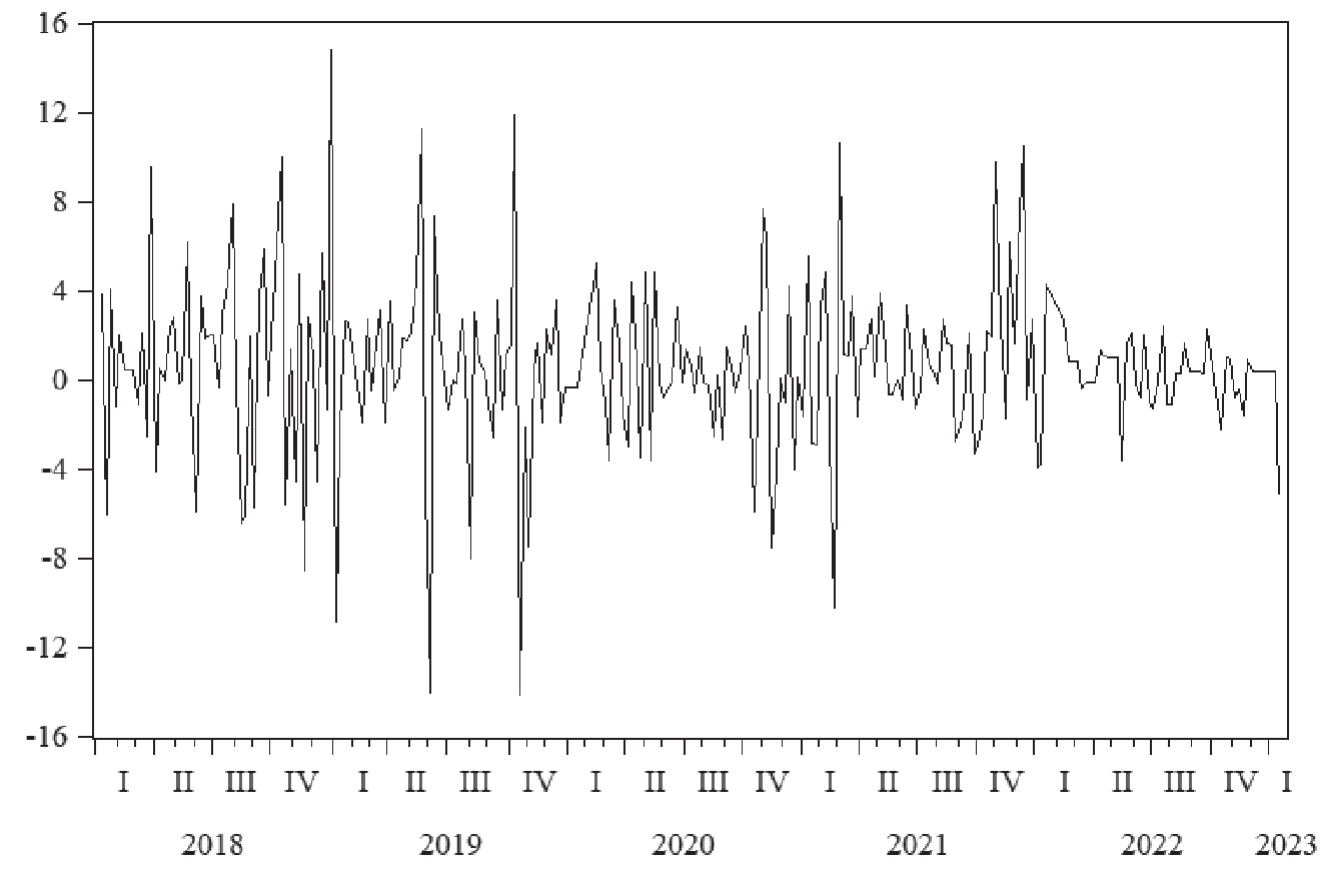
For data selection, the paper selects the weekly average index values of CCMVI from January 1, 2018 to January 22, 2023 (shown in Fig. 5) and take their log returns (shown in Fig. 6) as the data material for the model construction below. The reasons for doing so are as follows: first, as seen in Fig. 2, the prices of each pilot carbon trading market have entered a stable phase in 2018 with narrower volatility, indicating that China’s ETS is gradually maturing in terms of trading patterns and market norms after the initial market shocks at its establishment [47]. Second, China announced a moratorium on the acceptance of national certified voluntary emission reductions (CCERs) in 2017, leading to carbon allowances becoming the main source for companies to obtain carbon emission rights. In order to exclude that this external event leads to heterogeneous changes in the intrinsic structure of CAP movements, which has an impact on the study of CAP volatility mechanisms and makes the before and after results incomparable, this paper therefore selects data from 2017 onwards. The descriptive statistics and ADF tests of the data are shown in Table 1.
Results
Decomposition of the Switching Interval of CAP Based on the TAR Model
As shown in Table 1, the data satisfy the requirements of model fitting for stability. Table 2 shows the results of the Hansen test for the non-linear structure of the data and the number of intervals. In the test, the wald statistic contains redundant parameters that are not identified by the original hypothesis because the threshold is unknown in the usual case, resulting in the asymptotic distribution of the F statistic used to test the model fitness is not the standard χ2 distribution. Hansen (1996) derived the asymptotic distribution of this statistic and found that the critical value of this test statistic varies with the data process. Therefore, the paper borrows the method proposed by Hansen and uses Bootstrap to randomly sample 500 times to obtain the critical values of the approximate statistic, as shown in the fourth line of Table 2. Based on the results in Table 2, it can be seen that the values of the test statistics of TAR (2) and TAR (3) are both greater than the 95% critical value, rejecting the linearity hypothesis and indicating the existence of a nonlinear structure of the data, which confirms the conclusion of our analysis above. Also, since the SSR of TAR (3) was smaller than that of TAR (2), the TAR model with a two-threshold three-mechanism is finally selected.
According to the results in Table 3, the paper selects the maximum lag order of autoregressive variables as 3 and takes 1 as the lag order of the transformation variable, and according to the principle of minimum AIC, the TAR model is finally obtained as shown in Table 4. The fluctuation state of CAP is divided into three mechanisms of high, medium and low according to the threshold value, as shown in Fig. 7.
Based on the above empirical results, the following conclusions can be drawn: First, according to the proportion of intervals, CAP fluctuate mainly in the low and medium regimes most of the time, and the periods with a fluctuation of more than 3.9% accounted for only 15.81% of the total duration of the study, indicating that the risk of price bubbles in the carbon market is low in general and the market sentiment of overheated speculation has not yet appeared in the carbon market. Second, from the regression results of the TAR model, the coefficients of the lagged terms are negative in both the low and high regime models, which reflects the existence of a stabilization mechanism for CAP. When the price in the market is too low or appears to fall sharply, the coefficient with negative sign can significantly reverse the negative price fluctuation in the previous period into a positive price increase trend, thus making the price fluctuation into the medium regime or even the high regime and avoiding the market from falling into a depressed state for a long time. However, when there is an excessive price increase, a coefficient less than zero can again suppress overheating momentum in the market and bring prices back to the medium and low regime. At the same time, in terms of the process by which the stabilization mechanism works, when prices are in the low regime, the lagged one-period term can have a direct and significant effect on them, while when prices are in the high regime, it is the variables in lag two and lag three that have a significant effect on prices, which indicates that the price adjustment takes longer and the buffer process is slower compared to the low state. We can refer to this phenomenon as “strong lift and soft landing”. As for the source of this stabilization mechanism, considering that the carbon market is still a government-led policy market [48], the price stabilization mechanism similar to the traditional commodity market is not mature in the carbon market, so we consider that this stabilization mechanism is more likely to be the result of external government intervention, and that the equilibrium forces within the market due to the game between supply and demand may not be the main reason in the short term.
Table 1.
Descriptive statistics and ADF test of CCMVI.
| Descriptive statistics | Obs | Mean | Std. Dev. | Min | Max |
|---|---|---|---|---|---|
| 257 | 0.4591 | 3.7310 | -14.1539 | 14.7855 | |
| ADF test | t-Statistic | 1% level | 5% level | 10% level | AIC |
| -19.4371 | -3.4558 | -2.8726 | -2.5728 | 5.4436 |
Table 2.
Hansen test of fitting model.
Table 4.
TAR model test results.
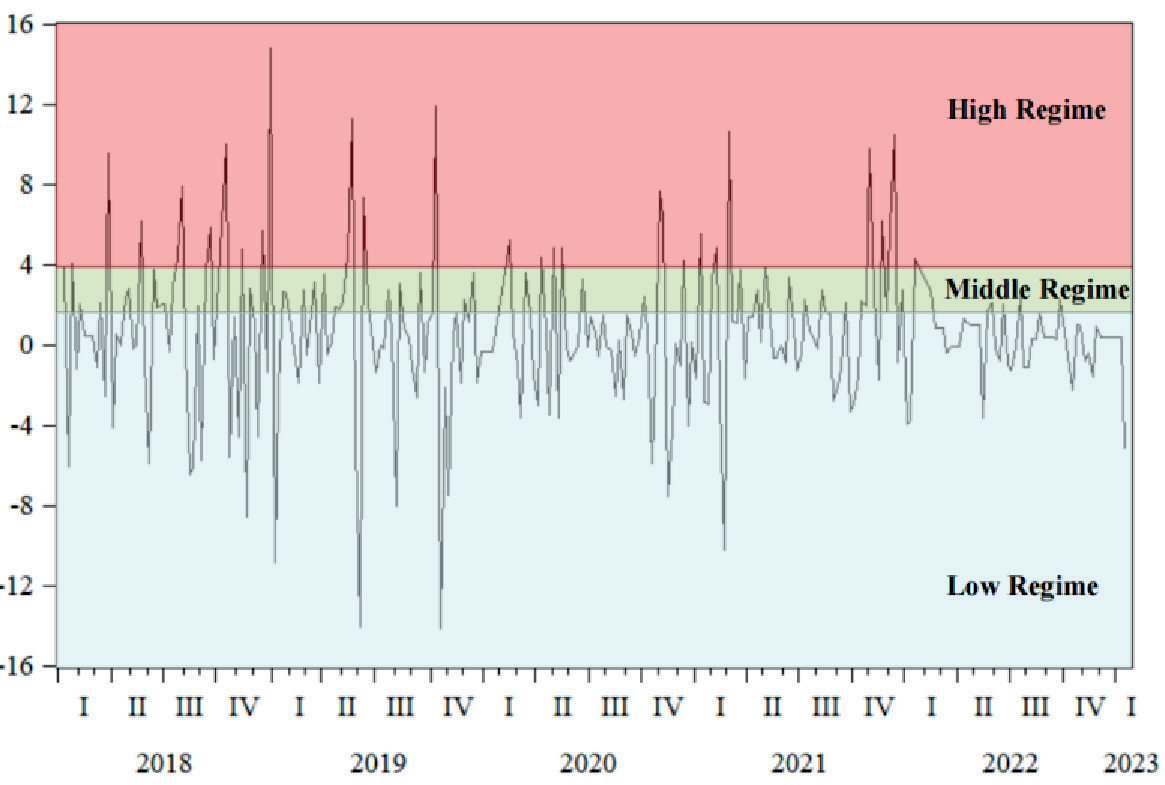
Table 5.
Estimation results of MRS model.
Table 6.
Correlogram of residual.
Analysis of the Switching Mechanism of CAP Based on the MRS Model
Through the threshold value division of TAR model, it can be clearly seen that there is an obvious regime conversion in the process of CAP fluctuations. Although above content has explained some properties and characteristics of this transformation to a certain extent in the above analysis, we still lack a grasp of the details of this dynamic transformation inside the system. MRS model can help us to better capture the more subtle and complex changes that exist in the process of regime switching.
According to the mathematical model in Section 2, the maximum likelihood estimation method is used to estimate MRS model’s parameters under various regimes. The results of the obtained parameters are shown in Table 5.
For the model fitting effect, first, the means (μ1, μ2 and μ3) obtained using MRS model for states 1, 2, and 3 are significant at the 1% level, and the values of the three means are highly differentiated in terms of sign and magnitude. Second, by correlation tests for the residual series after model fitting, it can be seen that there is no autocorrelation in the residual series (as shown in Table 6), which indicates that the model fits relatively well and the relevant information in the data has been fully extracted. From the empirical results of parameter estimation in Table 5, the parameters of CAP fluctuation model meet the significance requirement on the corresponding statistical indicators, which empirically confirms the existence of a relatively obvious three-regime transition in the dynamic process of CAP changes. Such results also suggest that CAP exist a structural transformation of the interval in the course of the change, revalidating the above conclusions.
From the empirical results in Table 5, it can be learned that there are three regimes in the operating process of CAP: (1) CAP rise significantly, with an average increase of 9.5% (smoothing probability is shown in Fig. 8); (2) CAP fall sharply, with an average decrease of 6.9% (smoothing probability is shown in Fig. 9); (3) CAP rise moderately, with an average increase of 0.5% (the smoothing probability is shown in Fig. 10). The three-regime average variance of the MRS model is 0.8, indicating that there is a certain degree of volatility uncertainty in the operation of CAP, while the overall risk of abnormal fluctuations is not high.
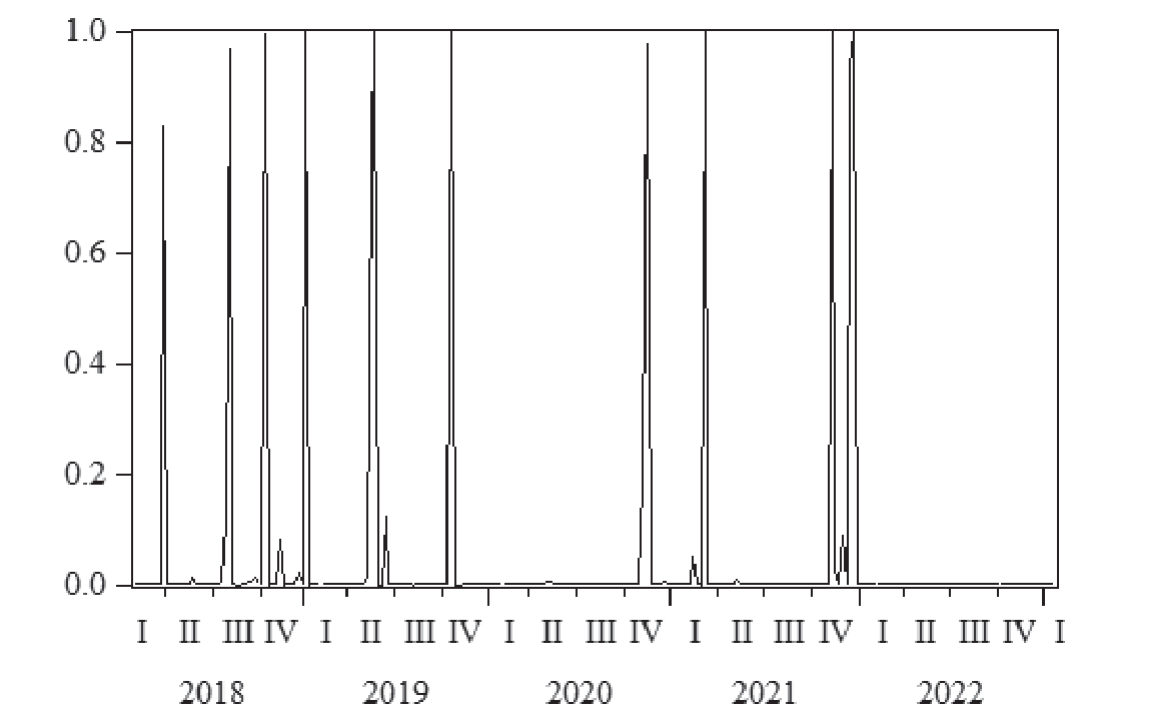
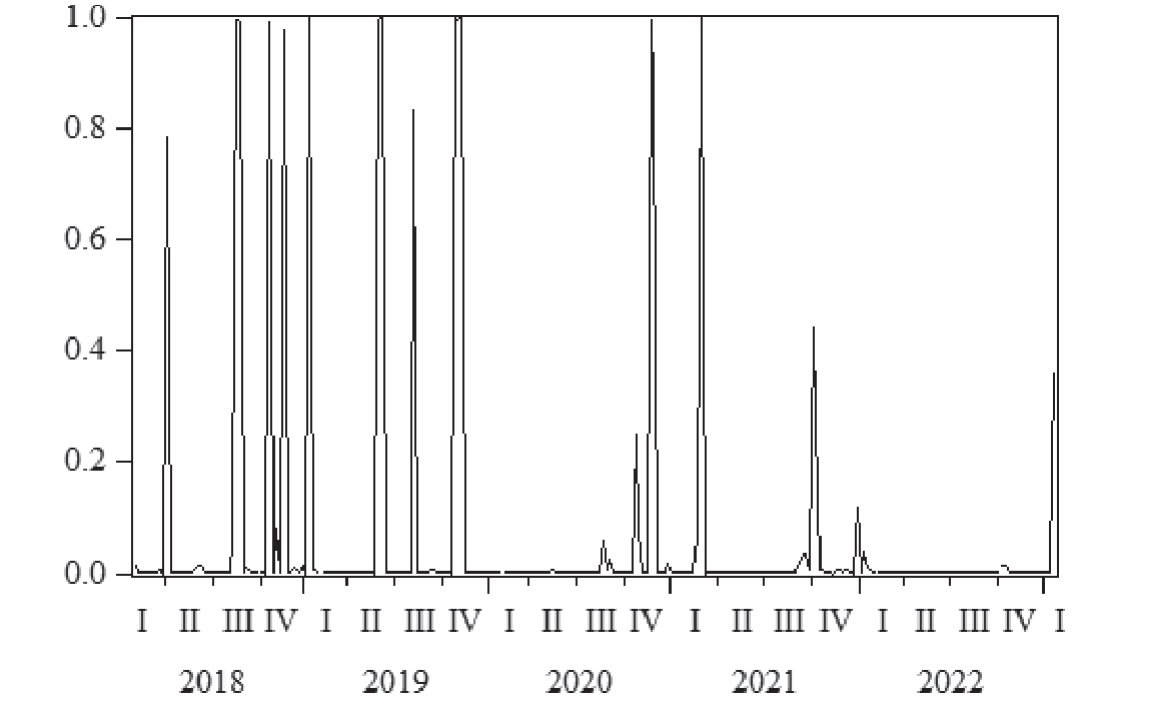
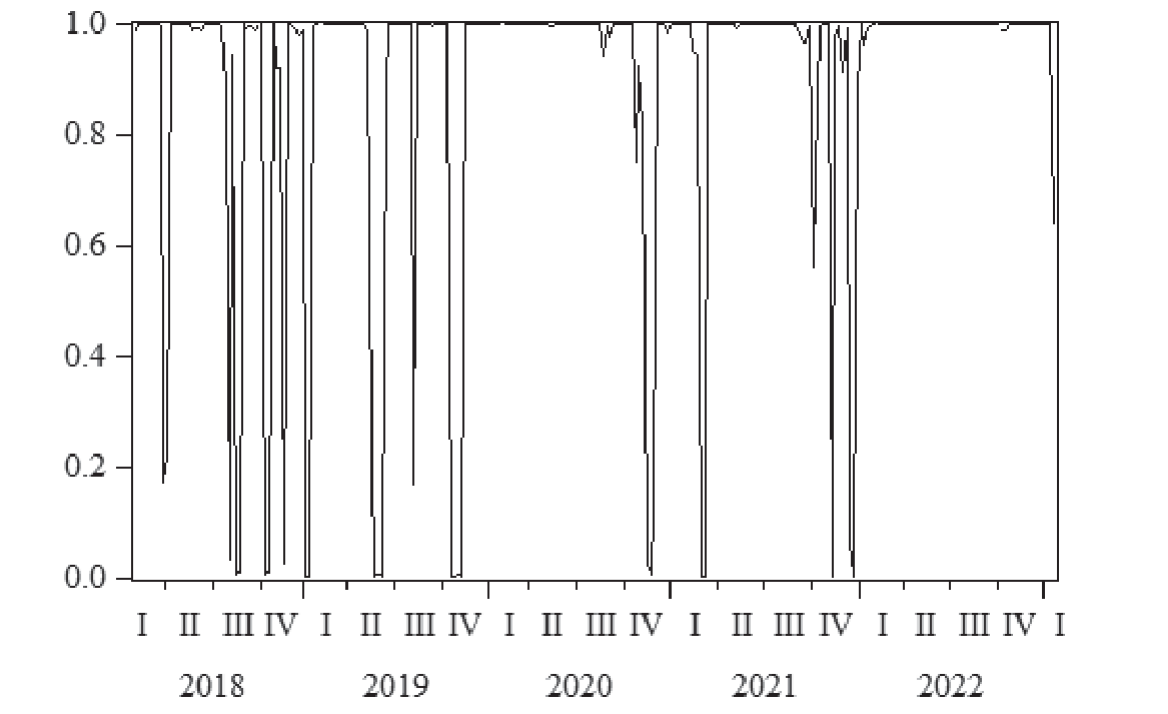
Table 7.
Switching probability matrix.
| P1 | P2 | P3 | |
|---|---|---|---|
| P1 | 0.1616 | 0.4995 | 0.3389 |
| P2 | 0.0819 | 0.3098 | 0.6083 |
| P3 | 0.0394 | 0.0234 | 0.9372 |
According to the transition probability matrix in Table 7, we can see that there are significant differences in the interconversion scenarios between the different states. Excluding the diagonal same-state probabilities, the maximum probability value in the matrix is P23 (60.83%), followed by P12 (49.95%) and then P13 (33.89%). High values of P23, P12 and P13 in the transition probability matrix indicate that cases of sharp declines followed by small increases, sharp increases followed by a fall in the rate of increase, and sharp increases followed by sharp declines are more likely to occur in CAP, and multiple trends of price changes are intertwined in the carbon market.
In essence, whether the price of carbon falls sharply and then rises sharply or rises sharply and then falls sharply or rises sharply and then rises sharply, these price fluctuations are normal market reflections and are the result of price stabilization mechanisms. However, for traders in the market, in addition to the need to be clear about the mechanism of price changes, but also the need to be clear about the duration of such price changes, so that the risks associated with price fluctuations can have a clearer understanding. From the smoothed probability graphs of the three regimes, it can be seen that compared to St = 1 and St = 2, the smoothed probability curve at St = 3 has a wider peak, the longest continuation and spans the most periods, which indicates that small increases are the main form of CAP fluctuations in the China’s carbon market. This can also be verified in Table 8.
In Table 8, the probability of P33 is up to 94%, with an average duration of nearly 16 weeks, again indicating that small increases are the most common, stable and persistent form of CAP volatility. In addition, the results in Fig. 8 to Fig. 10 show that state 1 and state 2 occur at similar points in time, often in tandem, and this important feature also points us to some special moments in which the carbon market is experiencing intense price shocks. According to the time points in the graph, the time points when CAP fluctuate drastically are mainly in the two years of 2018 and 2019, which indicates that some external or internal unstable factors could still have a significant impact on the normal operation of CAP during this period, and this is also an important symptom of the immaturity of the carbon market at the early stage of establishment. With the continuous improvement of the carbon market system and the gradual clarification of the carbon emission control targets, industry inclusion standards and market supervision tools by the local pilot carbon market regulators, especially in December 2020, China's Ministry of Ecology and Environment promulgated the Measures for the Administration of Carbon Emissions Trading (for Trial Implementation), which clarifies the offset mechanism, participation thresholds, allocation methods of allowances, registration system and penalty rules of the carbon trade, effectively contributing to the stable development of the carbon market, and the frequency of the dramatic CAP fluctuations has been reduced obviously after 2019.
Discussion
The models constructed in the above sections have provided an in-depth analysis of the volatility characteristics of CAP, especially in MRS model, which describes in detail the state persistence and transition characteristics of CAP in the process of operation from the perspective of regime transformation probabilities. It is important to note that in MRS model, different gain or loss scenarios correspond to different price states, and each state and the relationship between states can be represented by the corresponding transformation and persistence probabilities, so that gains and losses are linked to the probability of state transformation and persistence. For investors, the expected return under certain conditions can be obtained by combining the gains or losses in different situations with the corresponding probabilities. According to the conclusions obtained above, different states have different durations and there is a certain transition interval between states. The carbon market takes roughly 6 to 10 weeks to complete one regime transformation, roughly 40 to 60 weeks to complete two regime transformations, and longer to complete three transformations, with an average of 2 to 3 years. Table 9 shows the expected returns of the carbon market without state transitions and after one, two and three state transitions, respectively.
Table 8.
Same state maintenance probability and duration.
Table 9.
The expected rate of return of the carbon market under different state transition conditions.
| St0 | St1 | St2 | St3 | ER(%) | |
|---|---|---|---|---|---|
| No state transition | 1/2/3 | \ | \ | \ | -0.1292 |
| One state transition | 1/2/3 | 1/2/3 | \ | \ | 0.0388 |
| Two state transitions | 1/2/3 | 1/2/3 | 1/2/3 | \ | 0.4114 |
| Three state transitions | 1/2/3 | 1/2/3 | 1/2/3 | 1/2/3 | 0.5611 |
In Table 9, St0, St1, St2, and St3 denote the initial state, the state after one transformation, the state after two transformations, and the state after three transformations, respectively. From the results in Table 9, it can be seen that the negative expected return of investors when no state conversion occurs indicates that in the current China’s carbon market, the speculative behavior of achieving the purpose of short-term cash out for profit through rapid inflow and rapid outflow of capital is highly likely to bring losses to investors and should be used with caution by investors. However, what is of more concern is that the expected returns in the carbon market are gradually increasing as the duration increases. Such results suggest that investors may be wiser to invest in the carbon market for the long term, and China’s carbon market appears to be more welcoming to “patient” investors. But, the current worrisome situation is that the accumulation of uncertainties in the world economy, the increasing volatility of the macroeconomic environment, the sluggish growth and increased downward pressure on the economy of many countries, and the COVID-19 outbreak since 2020 have led investors to lower their confidence and expectations for the future, and thus the pool of “patient” investors has shrunk significantly [49], and the investors willing to take a long-term position in the carbon market may not be easy to find for a while. Nevertheless, considering that China’s ETS is a new type of market that is gradually being expanded from regional pilots to nationwide, its functions and roles are improving, and the Chinese government is showing great determination to achieve the “double carbon” goal, China’s ETS can therefore provide an ideal option for investors with confidence in the carbon market to invest for the long term.
In addition to the rate of return, investors also need to be alert to the risks associated with abnormal price fluctuations of traded goods in the carbon market. In financial markets, Value at Risk (VaR) is widely used to reveal the degree of risk of gain or loss from price fluctuations in investments, and this methodology can be applied to the carbon market as well. The standard deviation of the VaR values can be indicative of the market volatility of the exchanges, and the larger the standard deviation of VaR indicates the greater the volatility risk of the market [50]. Based on the calculations, we find that although the overall volatility risk of China’s carbon market is low, with a VaR standard deviation of only 2.8976, the calculation result of local pilot markets reminds us that there may be large risk deviation in individual markets due to the huge differences in different pilot markets. We measured the three pilot markets with the most active trading activities, Shenzhen, Guangdong and Hubei, and the results show that the VaR standard deviation of Guangdong carbon market is the smallest (0.6044), followed by Hubei (1.6781) and finally Shenzhen (24.6661), with clear differences in volatility risk among them. The above results reflect that, in addition to considering returns, it may be more prudent for investors to choose carbon markets such as Hubei or Guangdong if they are risk-averse in their analysis of CAP volatility. Our findings are consistent with those obtained from the empirical mode decomposition (EMD)-based multifractal depolymerization fluctuation analysis (MFDFA) [51] and are reliable.
Conclusions and Policy Implications
Based on the weekly average closing price of China’s carbon market value index from January 1, 2018 to January 22, 2023, this paper uses TAR model and MRS model to study the nonlinear fluctuation characteristics and regime transformation mechanism of China’s CAP, captures and describes the nonlinear threshold structure of China’s CAP fluctuation and the complex dynamic change process of multi-stage operation, and measures and analyzes the probability of the transformation between different regimes. Through identifying the nonlinear fluctuation structure and regime transition of the dynamic process of CAP operation during the study period, the final conclusions are as follows:
First, CAP during the study period show significant non-linear fluctuation characteristics. Using the threshold value to divide the range of price operation, three operating stages of high, medium and low are clearly shown in the results. CAP fluctuate mainly in the medium and low stages for most of the time, with fluctuations of more than 3.9% of the total time period studied accounting for only 15.8% of the total time period studied, indicating that overall risk of a price bubble in the China’s carbon market is low and that overheated market speculation has not yet occurred in the carbon market.
Second, there is a stabilization mechanism for CAP in their current operation. By estimating the regression coefficients in the model, it can be seen that when prices become imbalanced and enter the high or low mechanism, the stabilization mechanism can adequately regulate the trend of CAP fluctuation, so that it can eventually converge back to the normal state, instead of deviating more and more from the stable state after the imbalance. In terms of the process and time of adjustment, the adjustment is significantly faster when the price falls than when the price is too high, i.e., the so-called “strong lift and soft landing” phenomenon.
Thirdly, CAP fluctuations during the study period show a clear three-regime transformation process, including a moderate increase, a sharp increase and a sharp decrease. In China’s carbon market, the small increase is the most common, stable and persistent form of CAP volatility. Meanwhile, the three price transition situations of a sharp decline followed by a small increase, a sharp increase followed by a decrease in the rate of increase, and a sharp increase followed by a sharp decrease are the most likely to occur in CAP, showing the complexity of price operation in the carbon market. In addition, as a new type of market, on the one hand, ETS can also provide a good platform for investors to make long-term investments with the strong support and continuous construction of the Chinese government; but on the other hand, investors should not take lightly the risk of other possible states and abnormal CAP fluctuations. even though small increases are the main trend in CAP changes.
All of the above are studies and summaries of the past performance of CAP. By studying the performance of CAP, the above findings fully affirm the carbon market construction efforts over the past years. However, considering that China’s ETS is not yet truly mature, the future trend of CAP still needs to be closely watched, and the risk of large fluctuations in a short period of time that could affect the development of the carbon market cannot be ruled out. In order to achieve the long-term development of the carbon market, based on the ETS’s actual situation in China, we make the suggestions as follows:
First, building a nationwide carbon derivatives market. According to the experience of EU-ETS, in the face of irregular price fluctuations and abnormal risk shocks in the carbon market, carbon derivatives such as forwards, futures, options, etc. can not only provide good risk management tools for participants in carbon trading, but also provide pathways for liquidity enhancement and value discovery in carbon markets.
Second, improving the information disclosure system. The additional risks caused by abnormal price fluctuations are to a large extent due to opaque information disclosure and poor market liquidity. Although price fluctuations in China’s carbon market are currently more moderate, the possibility of drastic changes and the risks associated with abnormal fluctuations still exist, which actually increase the expenses of participating in carbon trading for both enterprises and investors, thus affecting the incentives of trading parties to participate in carbon allowance trading. Increasing market liquidity will help price signals to be transmitted quickly and effectively in the market. Adequate liquidity is the key to forming reasonable and real prices, which is the key to guiding participating entities to actively engage in carbon trading, offsets, or credits.
Third, improving relevant laws and regulations and system construction. Improving system construction is an effective measure to prevent the risk of overall CAP fluctuations and can provide a better environment for the development of the carbon market. At present, there are not enough laws and regulations for the secondary market of carbon trading, and the regulation and supervision system of carbon emission rights trading is missing. The competent departments, registries and exchanges should speed up the improvement of trading supervision details, establish a national unified management regulation of carbon emission rights trading, and provide standardized processes for participating entities to effectively prevent operational risks and ensure the normal operation of ETS.
Finally, improving the long-term stabilization mechanism of ETS. The long-term stabilization mechanism of ETS is an effective tool to prevent drastic price fluctuations and market failures in the carbon market, which has played a better role in stabilizing CAP and preventing volatility risks, such as the Market Stability Reserve Mechanism (MSR) proposed by the EU in 2015 [52]. At present, from the first compliance situation in China, the compliance rate has reached 99.5% [53], and carbon allowances are relatively sufficient. In order to ensure CAP stability, it is necessary to “reserve” excess carbon allowances, reduce the amount of carbon allowances circulating in the market, and stabilize the price of carbon by “releasing” previously stored allowances in the event of a strong increase in CAP and a shortage of allowances in the market. From the international experience, China can set up a long-term market stabilization mechanism to balance the market supply and demand, to prevent the risk of price fluctuation by relatively market-oriented means, and to solve the problem of short-term price fluctuation and long-term poor liquidity in the market.
At the end of the article, we need to point out that the market itself is always in the process of change and development as China’s carbon market is constantly being built and improved. The analysis of CAP in this paper is based on the past performance of CAP, which can effectively explain the past price fluctuations, but the prediction of future price fluctuations is not strong, and remains in a static analysis. Therefore, if external environmental variables can be incorporated into the analysis and prediction of CAP fluctuations, more realistic and apposite result may be obtained, especially for forecasting purposes.

