

Introduction
As an important issue of sustainable development, ecological issues have become a problem for developing countries at present, especially in China. The issues urgently need to be solved effectively and properly. It is necessary to improve ecological efficiency to alleviate ecological damage and environmental pollution.
Shirokikh et al. [1] have discussed main ecological factors including sea level, soil moisture and soil nitrogen which had a significant impact on ecological efficiency. As for the research of the total ecological efficiency in China, there are various mathematical models have been used, such as the super-efficient SBM metafrontier-Malmquist-Tobit model [2], bootstrap DEA method and the system GMM approach [3], the SBM-DEA model [4]. Some scholars have done lots of work on the research of ecological efficiency such as agro-ecological efficiency [5] and regional industrial ecological efficiency [6]. These researchers are mainly devoted to the total ecological efficiency, and the specific aspects of ecological efficiency such as atmosphere, water and soil are not much involved.
Water resources as strategic resources for the development of modern society are closely related to residents’ life, industrial and agricultural production. The Chinese National Water Resources Comprehensive Plan points out that the Chinese government must handle the relationship between economic and social development, water resources development, utilization and ecological environment protection correctly. So it shows that the Chinese government will be committed to the ecological efficiency of water resources and the sustainable use of water resources for a long time.
In the ecological efficiency of water resources research field, the ecological water resource footprint is an important view [7-8] and for the research of water resources management the most research was concentrated on the watershed scale [9-12].
According to previous studies of the ecological efficiency of water resources, it can be seen that the construction of evaluation indicators was not related to water resources closely and cannot reflect the eco-efficiency of water resources. As an important agricultural product base in China, Henan province crosses the Qinling-Huaihe River demarcation line between the north and the south of China. So it is of great importance to study the relationship between efficiency of water resources, consumption reduction and green sustainable development in Henan province. In this paper, the input-output super efficiency SBM model was employed to construct the water resource ecological efficiency index, evaluate the water resource ecological efficiency and analyzes its influencing factors in Henan Province.
Materials and Methods
Study Site Description
Henan Province is located in central and eastern China, spanning the Yangtze River, Yellow River, Huaihe River and Sea River basins. The water resources in Henan Province is of great seasonal and inter-annual differences because of its unique geographical conditions which result in insufficient innate water resources endowment. Henan Province has a large population. By the end of 2019 the permanent resident population in Henan reached 96,397,500, accounting for 6.9% of the total population in China, so the water consumption is large. The average annual water resources occupied by Henan Province only ranked 10th in China during the same period, with an average water resources occupied of about 440 m3, far below the basic requirements of the international per capita water resources of about 1000 m3.
Data Sources
In this paper, 18 municipalities in Henan Province were selected as the research object. Relevant data came from Henan Provincial Statistical Yearbook (2011-2020), municipal Statistical Yearbook (2011-2020), Henan Provincial Water Resources Bulletin (2011-2020) and Environmental Statistical Annual Report. Some missing data were supplemented by interpolation method.
Research Methods
This paper is based on the evaluation criteria of ecological benefits suggested by the Commission for Sustainable Development. In a specific SBM model containing unexpected output. The cost technical indicators are usually regarded as input indicators, the positive technical indicators are regarded as expected output and the technical indicators that have a negative impact on human production and life are regarded as unexpected output. Based on the practices of Yue Li et al. [13], Deng and Zhang [14], and combined with the availability and rationality data, the evaluation index system of ecological efficiency was established (Table 1).
In the study, the labor index is represented by the employees in the production and supply industry of the water which indicates the actual input of the labor force in the water resource industry. Water resources index is represented by the total water resources which shows the actual situation of water resources. The total investment of capital index can show the economic investment of water resources industry. The land index is expressed by the ratio of total land use water to total urban area. Output index includes expected outputs and non-expected output. The expected outputs are represented by gross regional product, average wage of water production and supply industry, per capita green area of park and the non-expected output is represented by the total amount of wastewater discharge.
Super efficient SBM model: the data envelopment analysis (DEA) was presented by Charnes and Cooper et al. [15] in 1978 which was a special tool for evaluating the relative effectiveness of the same type of organizations based on the linear programming. The traditional DEA model has many shortcomings. In order to make up the shortcomings of the traditional model that the DEA cannot be compared when the efficiency value is 1, the super-efficiency SBM model is employed in this paper. The basic principle as follows: supposing that there are n decision units, i input units and j output units, the formula for calculating the super efficiency value of the j0 decision units is:
Table 1.
The ecological efficiency evaluation index system table.
In the formula, θ represents the value of ecological efficiency, Si- and Sr+ are relaxation variables, Xij and Yhj respectively represent the input and output variables, λj represents the combination ratio of effective decision making unit(DMU), ∑λ>1, ∑λ<1 and ∑λ = 1 respectively represent increasing, decreasing and constant returns to scale, ε is the infinitesimal quantity of the Akimedean [16].
Malmquist index model: Malmquist index was put forward in 1953 which can measure the variation trend of efficiency value in time series. The Malmquist index formula is:
(3)
Where the x represents the input and y represents the output, TFPch represents the change degree of DMU, Dt(xt, yt) and Dt(xt+1, yt+1) respectively represent the input distance functions of DMU in t and t+1 phases when the technology in t phase is taken as reference. The principle of Dt+1(xt, yt) and Dt+1(xt+1, yt+1) is the same as above; CRS and VRS indicate that the distance function is invariant and variable based on the returns to scale [17].
Results and Analysis
Analysis of SBM-DEA Results
The year as the cross-sectional data are classified to analyze the spatio-temporal changes of efficiency of cities in Henan Province. The estimate results of comprehensive value of ecological benefit of water resources in Henan Province from the year 2010 to 2019 as Table 2.
From the perspective of time, it can be seen that after the year 2012, the mean value of water resource eco-efficiency showed a rebound trend which was influenced by the government’s positive response under the five development concepts, but then fluctuated. It is difficult to improve the ecological efficiency of water resources continuously because of the large population and poor economic foundation of Henan Province. After the year 2015, the average value of ecological efficiency is increasing which indicates that all cities in Henan Province pay much attention to ecological efficiency, but there is still a big gap between the ecological efficiency of each city. We can see that the value of ecological efficiency of water resources in Jiyuan city is the highest in Henan province from the Table 2. Jiyuan City has an excellent natural environment and has the reputation of „garden city”, so it can be effectively reflected in the ecological efficiency value of water resources. The Sanmenxia City ranked the second. In recent years, the Sanmenxia government had planned and implemented the construction of 9 demonstration bases of resource conservation and environmental protection in combination with the urban development status and leading industries, so its environmental quality was firmly in the forefront of Henan Province. Pingdingshan and Xinxiang city were the lowest, followed by Anyang City. The ecological efficiency of water resources in Pingdingshan city is not high because of the enterprises with high energy consumption and high pollution. The gross regional product is not high and the average wage level of water conservancy industry is low. Xinxiang City wastewater discharge is serious and the green area is not high.
Table 2.
Ecological efficiency values of 18 cities in Henan Province.
The ecological efficiency value of Pingdingshan City and Shangqiu City showed a jump in 2019 because of the environmental quality of Pingdingshan city improved significantly in 2019, PM2.5 and PM10 emissions decreased and emissions of the heavy metal achieved zero growth. Despite the shortcomings of human and water resources, Shangqiu actively implements pollution prevention and control measures to deal with the relationship between environment and economic development. So Shangqiu’s GDP has been at the forefront and its ecological efficiency has achieved a substantial increase in 2019.
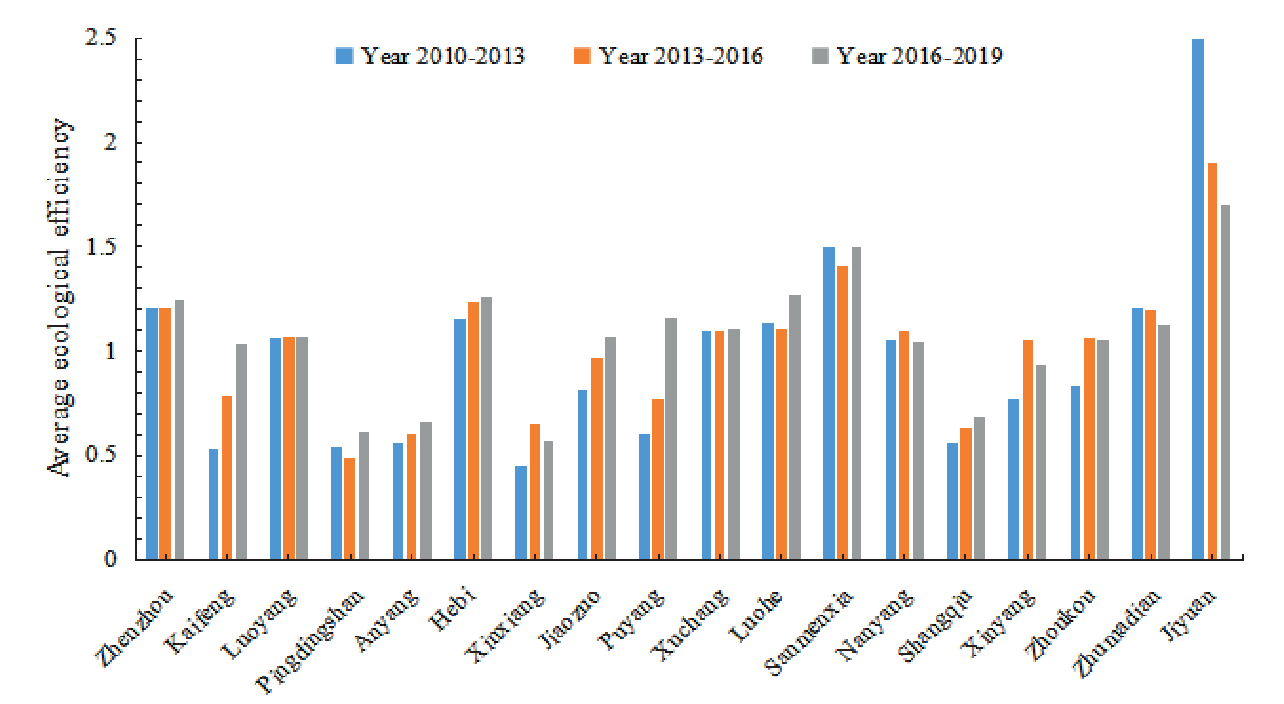
The mean values of ecological efficiency of each city during 2010-2013, 2013-2016 and 2016-2019 were calculated and was drawn as Fig.1. From the perspective of space, the mean values of ecological efficiency of 18 cities were significantly different. The fluctuation of ecological efficiency of water resources in Zhengzhou, Luoyang, Hebi, Xuchang and Luohe is small, but and the level of ecological efficiency is high which indicates that the development of these regions is sustainable and healthy and the utilization of water resources is more reasonable. The ecological efficiency value increased gradually over time for most cities, but Zhumadian and Jiyuan city showed a downward trend although the ecological efficiency value was effective every year. The reason was that Jiyuan paid much attention to the investment in water conservancy but did not achieve better results. Although the total amount of water resources in Zhumadian City had increased, but it was not well used, so the ecological efficiency of water resources was not continuously improved.
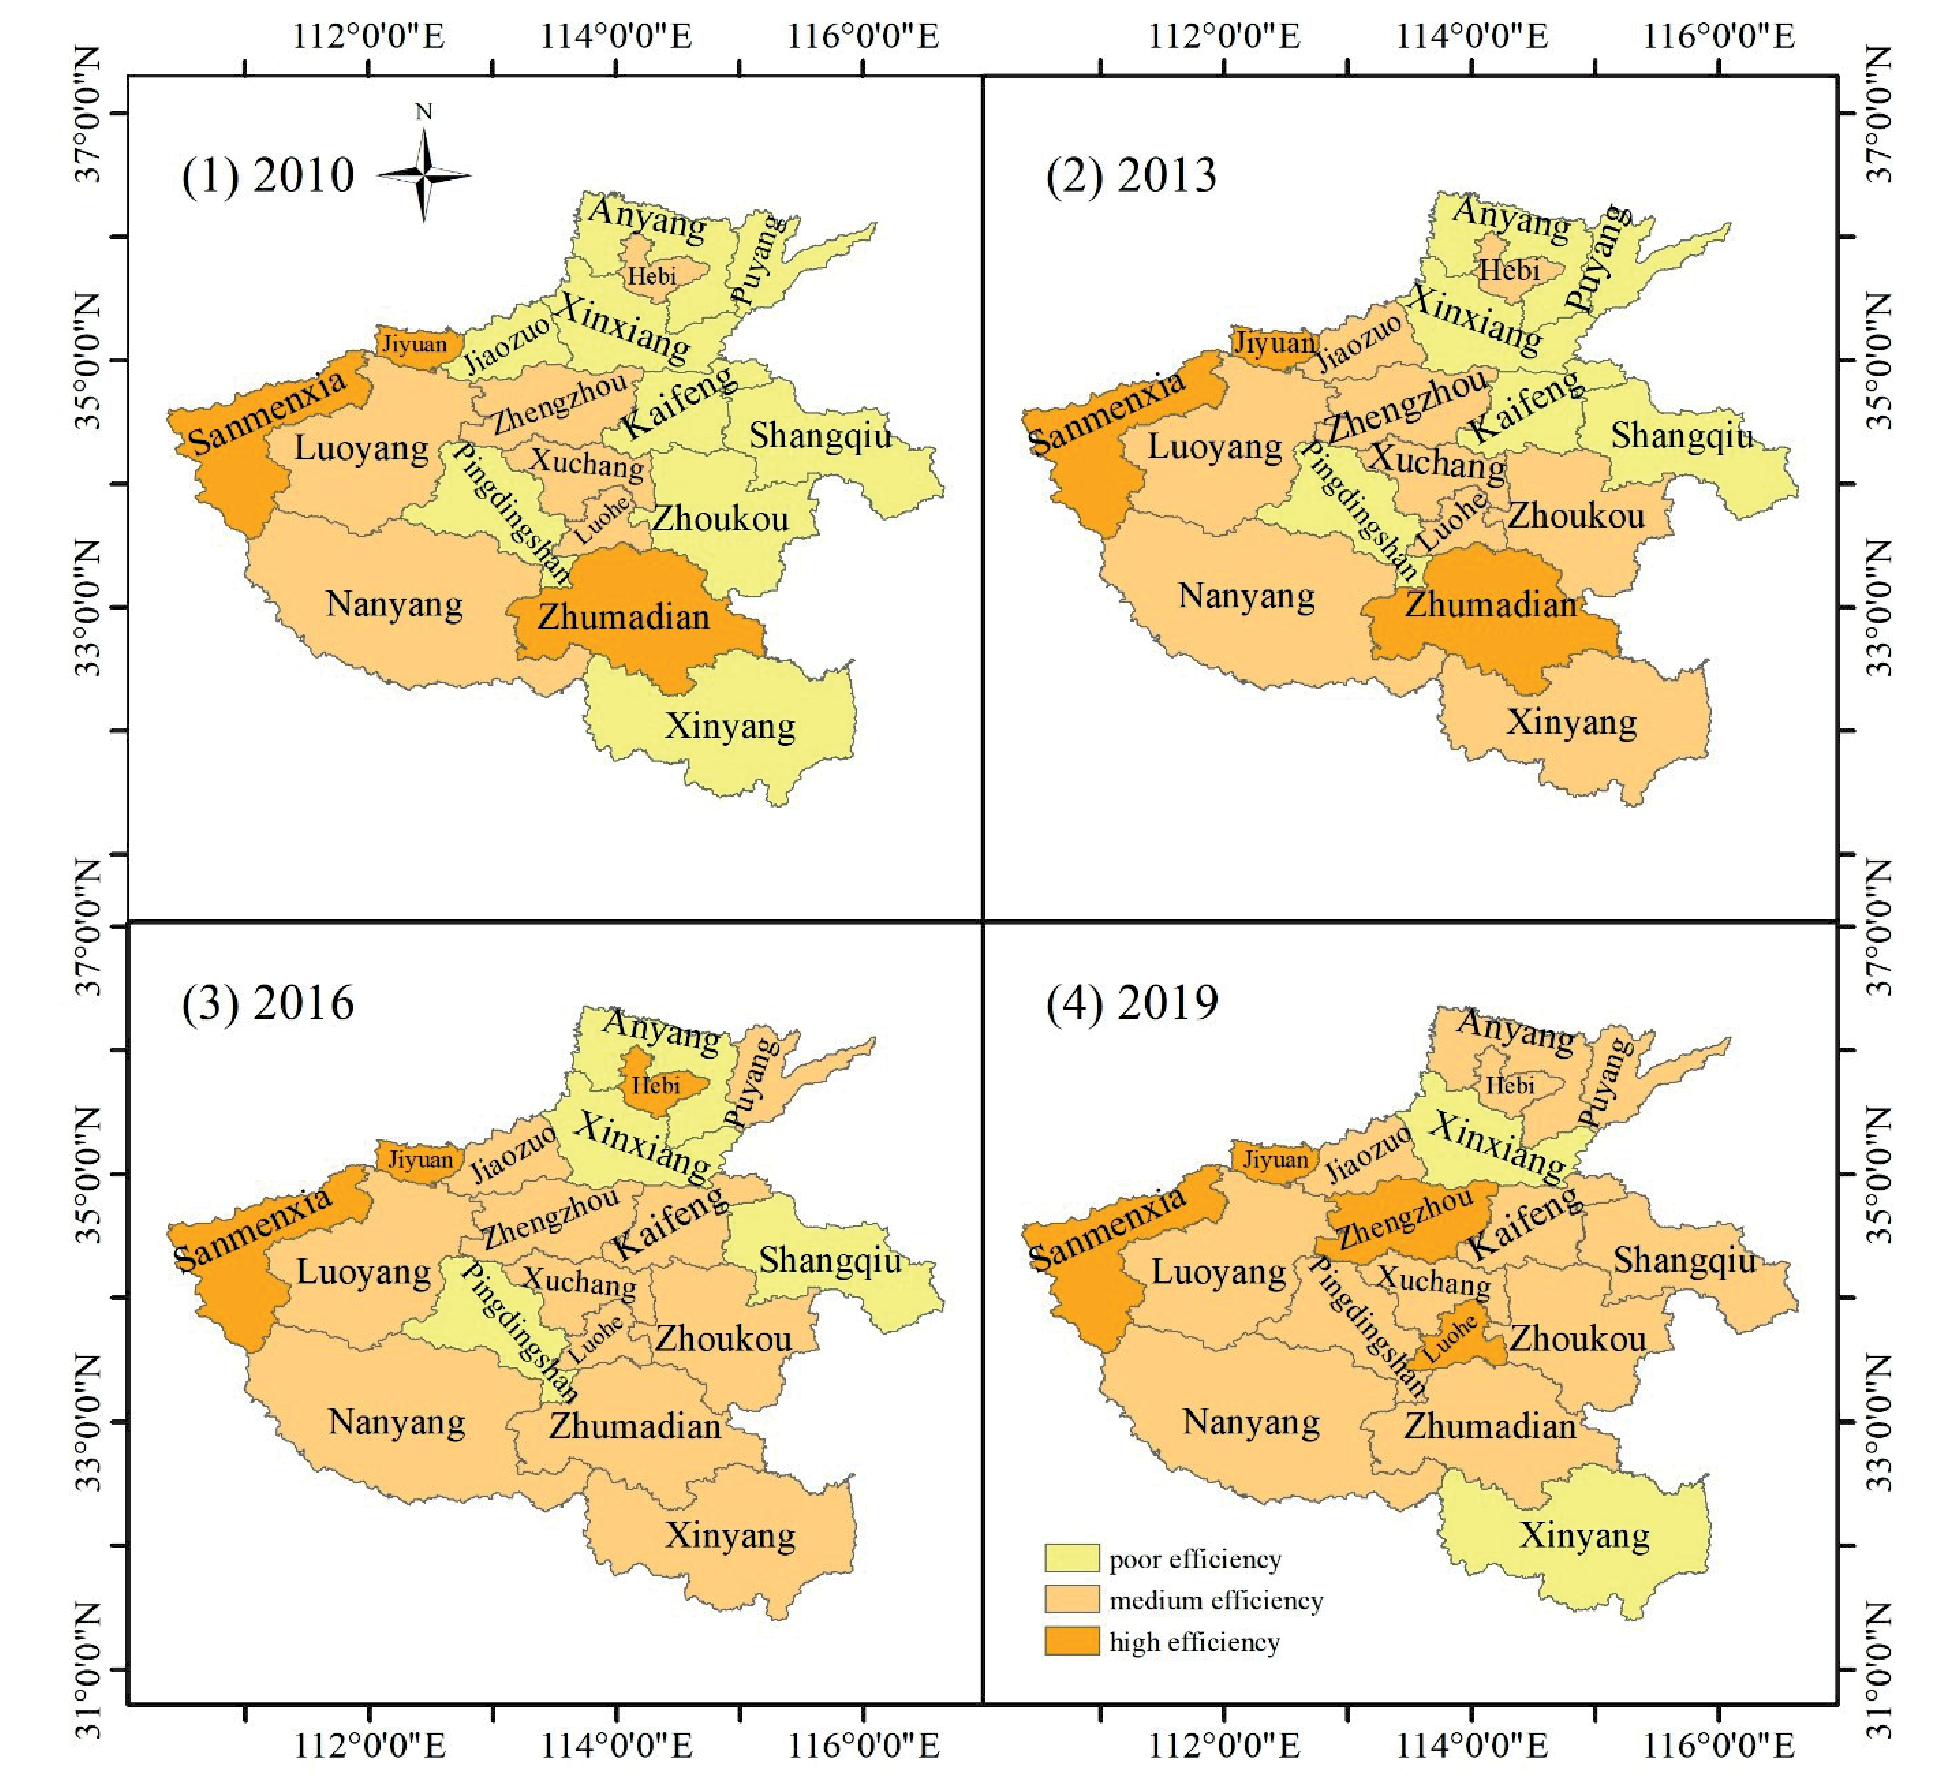
In order to avoid the influence of outliers of some results on the overall results [18], we arrange the ecological efficiency values of the18 cities in 2010, 2013, 2016 and 2019 in descending order and draws the scatter plots in Excel. The abrupt inflection points 0.65, 1.23 and 1.62 were selected as the classification thresholds, and the ecological efficiency levels were divided into low, medium and high efficiency which could reflect the spatial distribution degree of ecological efficiency.
It can be seen from the Fig. 2. that the ecological efficiency of all cities in Henan Province has generally increased over time. In 2019, Zhengzhou and Luohe changed from medium efficiency to high efficiency, and Pingdingshan, Anyang and Shangqiu changed from low efficiency to medium efficiency. Hebi and Xinyang City in 2016 showed great growth, but it recovered to the original situation in 2019 which indicated that these two areas had development potential, but it still needs to spend time and energy to stabilize the ecological efficiency. The ecological efficiency value of most regions can reach the effective state, and the ecological efficiency of the central region is better, realizing the coordination between economic development and water resources protection.
Malmquist Index Analysis
In order to analyze the change degree of efficiency value and obtain the annual Malmquist index and its decomposition of each city in Henan Province during 2010-2019, the Malmquist index analysis was employed by using the time series panel data.
Based on the decomposition of Malmquist index, the results are drawn (Fig. 3). It can be seen that the total factor productivity of each city in Henan Province presents the fluctuations with obvious differences among cities and the total factor productivity of each city has great synergy with technological progress. The total factor productivity of Kaifeng is the lowest.
The main reason is that the technological progress, the technical level of different cities is different, so we should learn from the high-level city in order to improve the technical level and to promote technological innovation and progress. Zhengzhou has good environmental governance effect, high level of economic development and technological innovation, and its economic development can drive the development of surrounding areas and enable surrounding cities to improve the ecological efficiency of water resources by relying on technological progress. Luoyang is the second largest city in Henan province with a high gross regional product and significant total factor productivity due to technological progress, while attention should also be paid to the improvement of scale efficiency and pure technical efficiency. The fluctuation of pure technical efficiency and scale efficiency is not obvious which shows that they have little influence on different regions.
The decomposition index of each city during 2010-2013, 2013-2013 and 2016-2019 are summed and divided into five levels for visual analysis (Fig. 4-7). It can be seen that the index is in an increasing trend over time, but from 2013 to 2016, the total factor productivity of Jiaozuo, Sanmenxia, Xinyang, Zhoukou and other cities declines due to technological progress while technological progress in Hebi was in a downward trend. Technology level has a great impact on the total factor productivity, so it is necessary to promote technological innovation and technological progress, appropriately raise the wages of workers in the technical sector and attract innovative talents.
In addition, scale efficiency is significantly lower than pure technical efficiency. In the future, cities should pay attention to the impact of scale efficiency, such as expanding the scale of water supply, water resources utilization market scale to improve the sense of scale and avoid the state of diseconomies of scale. According to the differences between different cities, different schemes should be formulated to make the efficiency increase. With the deepening of the concept of high-quality development, in order to ensure the sustainable utilization of water resources, more and more industries are using clean energy, promoting water saving and efficiency, water saving and emission reduction, and so on. However, it is necessary to actively promote the use of new technologies, new materials and new processes to avoid the influence brought by technical means. Therefore, the Henan Province should pay more attention to increase the input of agricultural science and technology, improve the treatment and utilization technology of industrial wastewater and promote the clean and sustainable use of agricultural natural resources and environment. At the same time scale efficiency and technological progress should be improved. Resource potential should be tapped under the current technological level and the government guidance should be strengthened to improve the ecological efficiency of water resources through scientific and technological innovation and technological progress.
Table 3 shows the dynamic changes of index decomposition in Henan Province during 2010-2019. From the perspective of time series, the change of technical efficiency decreased significantly during 2017-2018, when the scale efficiency was the lowest. The lowest total factor productivity was in 2014-2015, and technological progress also declined at this time which indicated that the technological progress was still the main reason restricting the ecological efficiency of water resources. In the past, the development of Chinese industrial enterprises has been supported by the input of resources which resulted in the reduction of resources and environmental pollution and reduced the level of ecological efficiency. In the future, technological innovation and industrial structure optimization should be promoted to reduce the energy consumption and improve ecological efficiency on the whole.
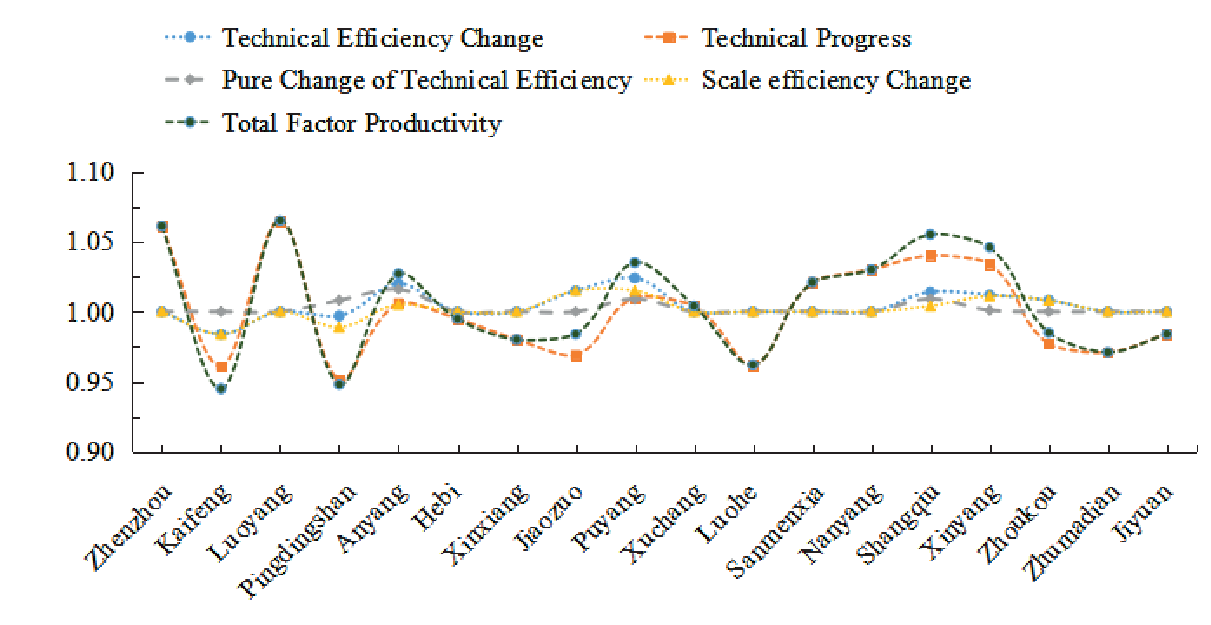
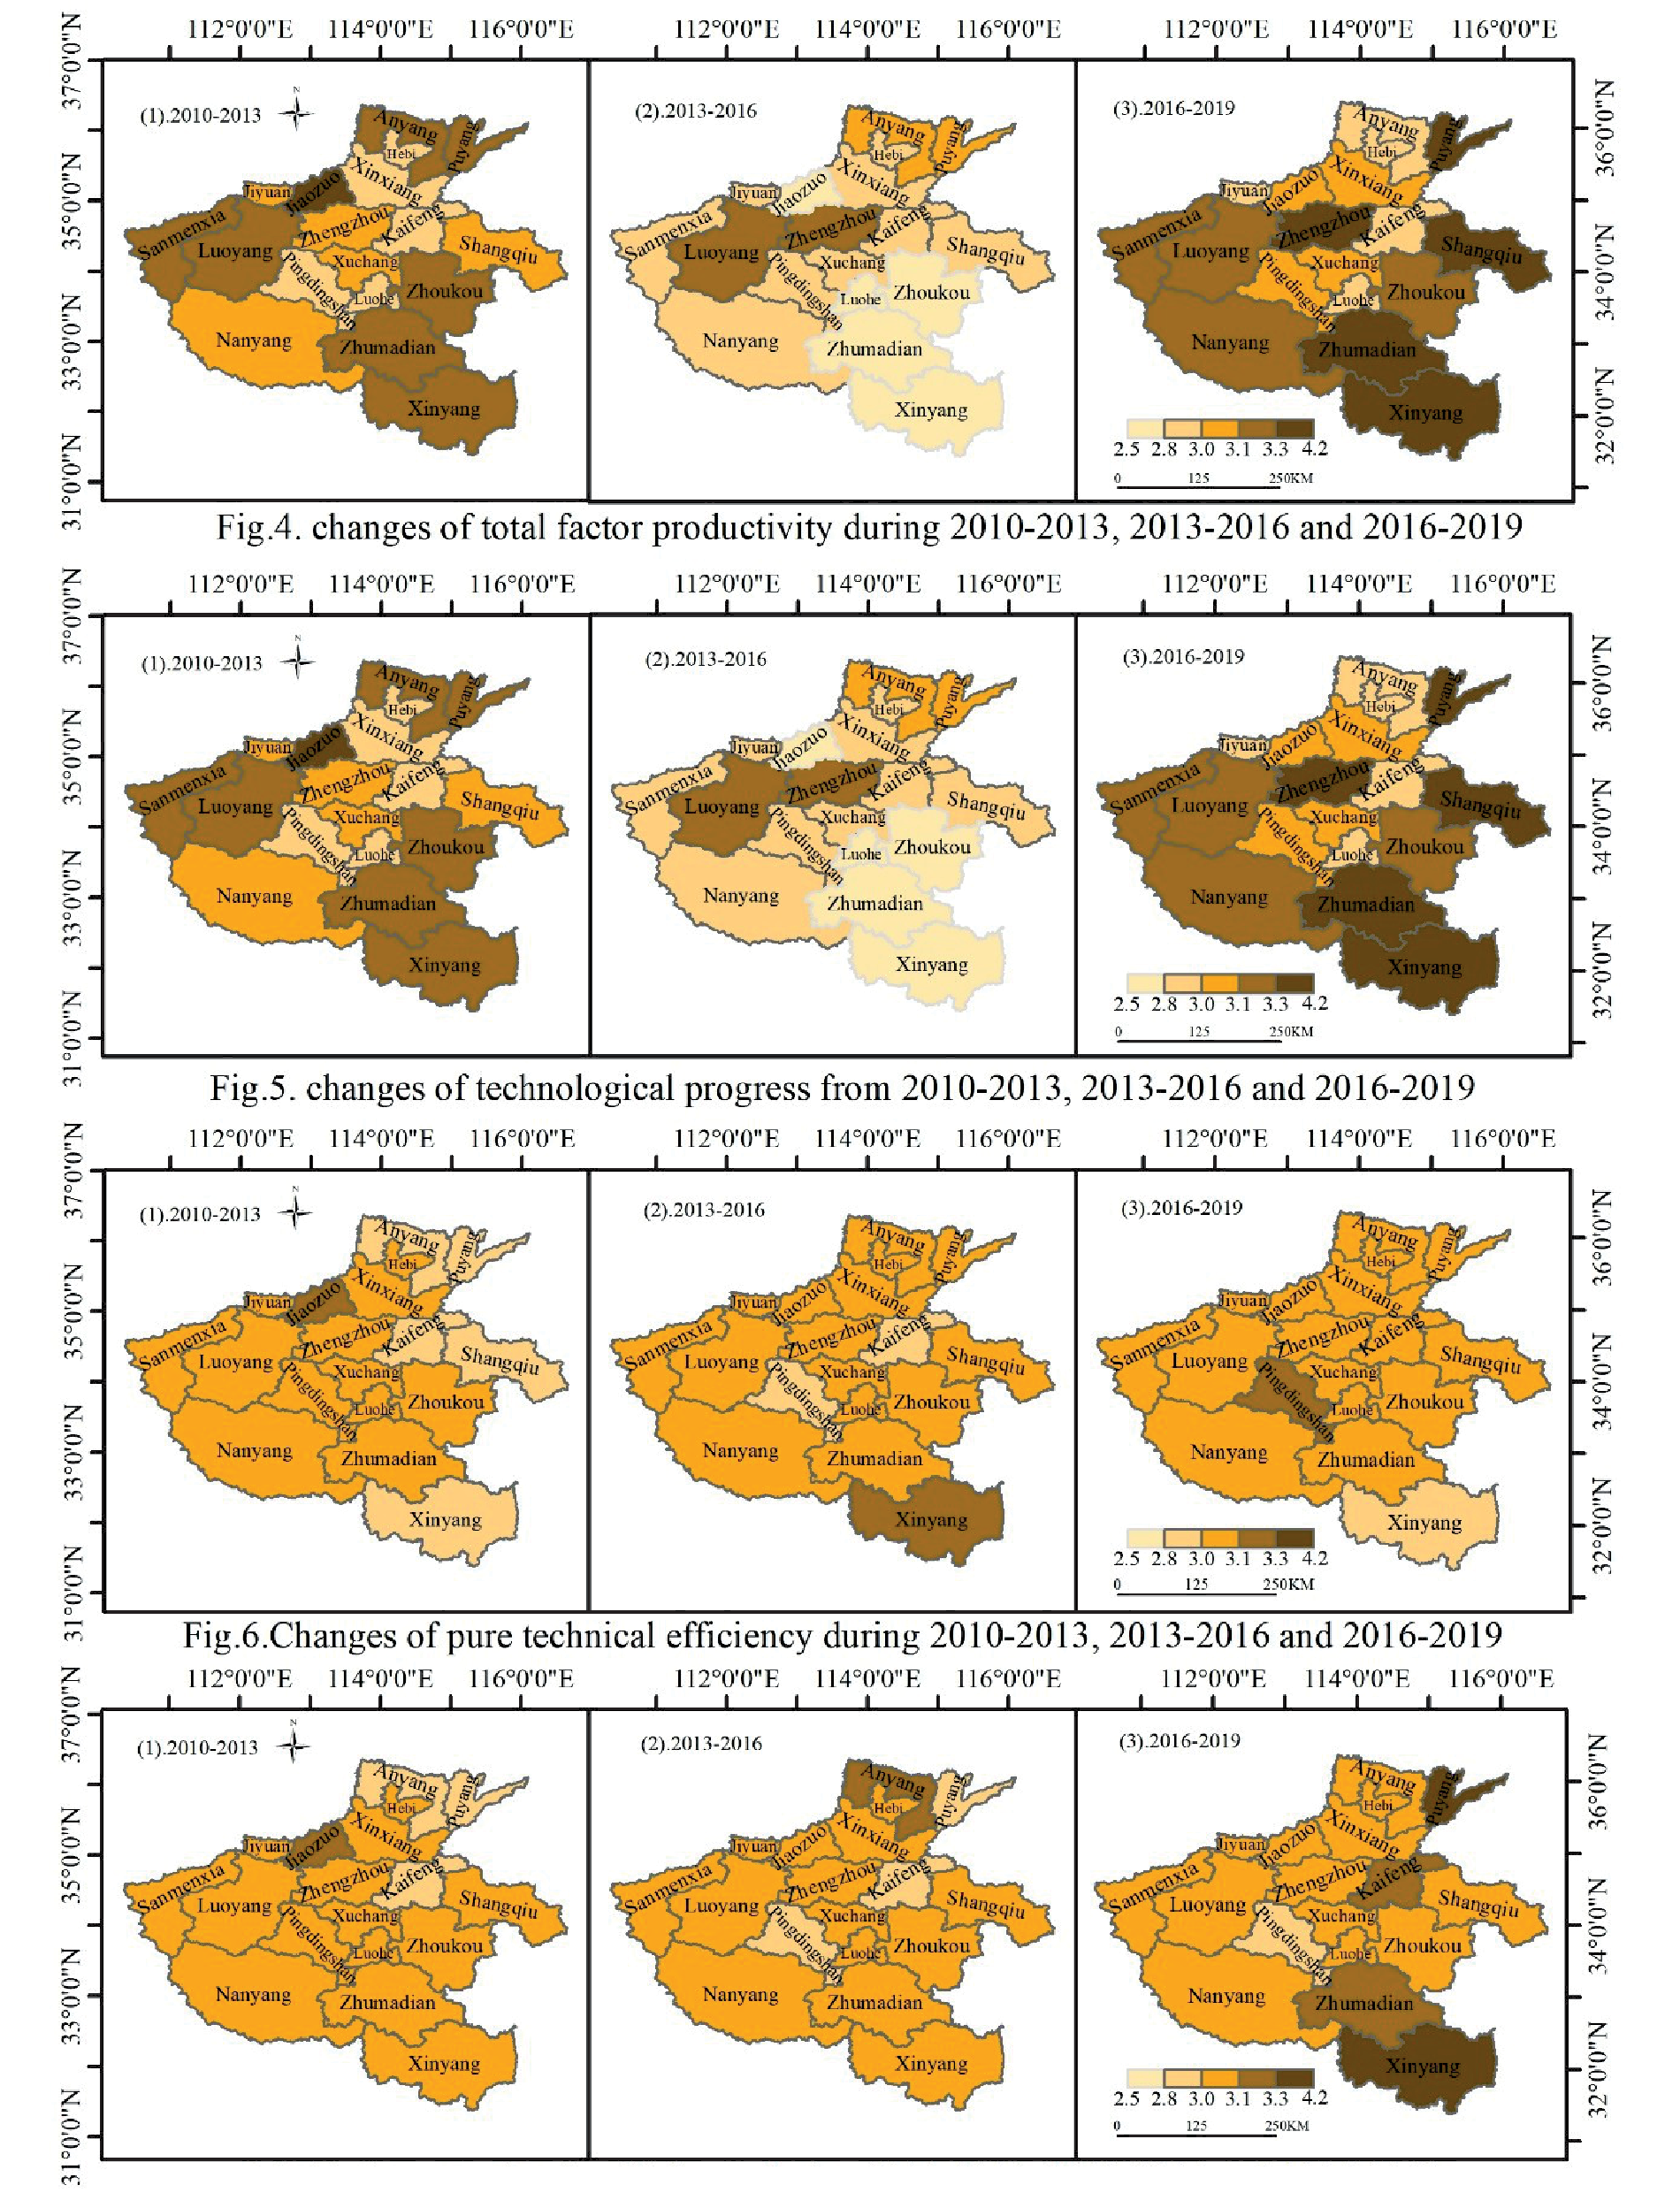
Table 3.
Decomposition results of annual Malmquist index of water resources ecological efficiency.
Conclusions
In this study, we used super efficiency SBM and Malmquist index model to evaluate ecological efficiency of water resources in Henan Province, which is a key
agricultural product base in China. The result showed
that water resources ecological efficiency of each city in Henan Province varied greatly, and the average ecological efficiency was effective only after 2015. Jiyuan City was the region with the highest ecological efficiency value of water resources in Henan Province, while the ecological efficiency values of Pingdingshan and Xinxiang were always ineffective because of the geographical location and resource endowment. The results of Malmquist index show that total factor productivity are always in fluctuating state, and the scale efficiency is always lower than the pure technical efficiency.
The study finds that the area with good economic development can drive the development of the surrounding areas. The cities such as Zhumadian, Jiaozuo and Pingdingshan should coordinate with each other in future. A few urban cities such as Xinxiang, Nanyang, Shangqiu should expand the green area and strengthen the organization to narrow the gap with other cities and pay attention to the balance between the environment and economy at the same time. Historical resources, economic development level and technological progress all have an impact on the eco-efficiency of water resources, we must promote the development of green enterprises, explore new industrial development models under the ecological background, use clean production processes, promote clean fuels, improve energy efficiency, and promote high quality development while promoting economic efficiency.

