

Introduction
Water resources are indeed a vital component of our natural environment, serving as the lifeblood of ecosystems and playing a pivotal role in the economic development of societies worldwide [1-3]. With our planet experiencing increasingly rapid global environmental changes and robust economic growth, the need for effective management and sustainable use of water resources has become an urgent, borderless, and culture-spanning challenge [4-6]. Nowhere is this more evident than in China, where issues of unequal distribution and escalating pollution of water resources have created an urgent need for innovative solutions that can enhance efficiency and promote environmentally friendly management practices [7-9].
One such innovative concept gaining prominence in addressing these challenges is Green Total Factor Productivity (GTFP). This concept builds upon the traditional economic metric of Total Factor Productivity (TFP), which represents the portion of economic output not accounted for by labor and capital inputs, typically attributed to technological advancements [10- 13]. However, conventional TFP metrics have their limitations, especially when it comes to evaluating the complex interplay between economic development and environmental resources. In China, where the scarcity of water resources and pollution levels have reached critical levels, GTFP has emerged as an alternative and more comprehensive measure. GTFP goes beyond the traditional TFP by considering not only technological advancements but also resource utilization and the environment’s capacity to absorb pollutants. This holistic approach provides a more accurate and nuanced assessment of economic and technological progress while taking into account the sustainability of these advancements [14-16]. When it comes to measuring TFP, researchers typically employ two main approaches: parametric and non-parametric methods. Parametric methods require subjective judgments to determine production functions for parameter estimation, which can introduce significant subjectivity into the analysis. In contrast, non-parametric methods, such as Data Envelopment Analysis (DEA), have gained favor for their ability to provide credible and robust measurements without the need for subjective assumptions [17-20].
Traditionally, DEA models like CCR and BCC have been used for TFP calculations. However, Tone’s enhancements to DEA led to the development of the SBM model, which accounts for undesirable outputs, making it particularly relevant in the context of water resource utilization efficiency assessment. Moreover, in response to the growing severity of water scarcity and pollution, researchers have increasingly applied DEA methods to measure water resource utilization efficiency [21-23]. This approach allows for a more comprehensive evaluation of the efficiency with which water resources are being used while considering environmental sustainability. To analyze GTFP dynamics, many scholars have turned to the Malmquist index decomposition method. This method breaks down GTFP into technical efficiency, technological progress, and scale effects, providing a more detailed understanding of the factors driving changes in productivity [24-27].
In this study, the Shifted Boundary Method (SBM)-Malmquist model was employed, taking into account factors such as economic development, natural water resource endowment, and water pollution levels [28-30]. Through the development of a comprehensive evaluation index for water resource GTFP, this research intends to illuminate the green utilization of water resources and examine the developmental trends in regional water resource utilization efficiency in Anhui Province between 2010 and 2018. The findings are intended to provide theoretical support to the Anhui provincial government in formulating effective water resource management policies and actionable plans for building a water-saving and green society that can serve as a model for sustainable development. In the face of the ever-pressing challenges posed by water scarcity and pollution, innovative approaches like GTFP analysis offer a beacon of hope for a more sustainable and prosperous future.
Experimental
Model Selection
In practical calculations, the production technology and scale of decision-making units are not static; therefore, it is crucial to analyze the impact of time series trend changes on the efficiency of these units. While the SBM model is suitable for static analysis, it does not adequately capture dynamic trends. To address this limitation, related scholars have extended the SBM model by proposing a decomposition based on the Malmquist index model, which is designed to analyze the dynamic changes over time. This approach assumes the Malmquist index for periods t to t+1 and thus enables a more comprehensive understanding of efficiency changes in decision-making units (DMU) over time. The variables "x" and "y" represent the input and output vectors, respectively, for each DMU under assessment. In the context of the SBM model, 'x' typically includes quantifiable resources consumed by the DMU, such as labor, capital, and materials."y", on the other hand, includes the desirable outputs produced, such as goods and services. The choice of inputs and outputs is context-specific and should reflect the operational realities of the DMU being studied. The efficiency score in the SBM model ranges from 0 to 1, with 1 indicating a fully efficient DMU that is on the production frontier. Scores below 1 indicate a level of inefficiency, with a distance from 1 providing a measure of the degree of inefficiency. The further the score is from 1, the greater the inefficiency [31]:
Additionally, the Total Factor Productivity Change (TFPC) is decomposed into a Technical Efficiency Change (EFFC) and a Technical Change (TEC). Furthermore, the Technical Efficiency Change (EFFC) is further subdivided into a Pure Technical Efficiency Change (PEC) and a Scale Efficiency Change (SEC).
The Total Factor Productivity Change (TFPC) is a comprehensive metric for evaluating changes in productivity within an economy or production process over time. It encompasses not only the effects of capital and labor inputs but also the efficiency with which these inputs are converted into outputs, as well as the technological progress occurring within the production system. The Efficiency Change (EFFC) component reflects the improvement or decline in the efficiency of input utilization without any technological advancement. It is further disaggregated into two subcomponents: Pure Efficiency Change (PEC), which quantifies changes in efficiency due to improvements in managerial skills or organizational practices, assuming constant returns to scale; and Scale Efficiency Change (SEC), which accounts for efficiency variations arising from changes in the scale of operation, signaling whether the production is experiencing increasing, constant, or decreasing returns to scale. Lastly, Technological Change (TEC) measures the temporal shifts in the production frontier, symbolizing innovation or technological progress that allows for the production of greater output from the same quantity of inputs.
Water Resource Total Factor Productivity Measurement
X1 labor input: The total number of employees in tertiary industries is used to reflect the actual utilization of all labor resources. X2: Natural Endowment of Water Resources: Per capita water resources are selected to represent the natural endowment of water resources. X3 Capital Input: Capital stock is chosen to reflect the existing scale and technological level of enterprises. Referring to the perpetual inventory method, the capital stock of 16 cities is calculated with 2008 as the base year [32]. The principle is as follows:
Capital stock for the current period (Kt) is derived from the previous period’s capital stock (Kt-1), adjusted for depreciation (δ) and price index (Pt), using a depreciation rate of 9.6% as given in the literature [30]. The chosen output indicator is GDP, the final outcome of the production activities of all resident units in a country or region within a certain period, calculated at market prices. Z1-3, These three indicators collectively consider the environmental pollution resulting from industrial development.
Data Source
Water resources, labor, and capital input were chosen as input indicators, GDP was chosen as the expected output, and total industrial wastewater discharge, total industrial exhaust emissions, and general industrial solid waste generation were chosen as unanticipated outputs [33-36]. Data for Anhui Province and its counties and cities from 2010 to 2018 were selected from the “Anhui Statistical Yearbook”, “China City Statistical Yearbook”, and “China Statistical Yearbook” [37-39].
Overview of Water Resource Utilization in Anhui Province
Anhui Province, located between 114°54’-119°37’E and 29°25’-34°38’N, covers an area of 139,400 km². Situated in the East China region and part of the Yangtze River Delta, Anhui is divided into three regions by the Yangtze and Huai rivers: Northern Anhui, Southern Anhui, and Central Anhui. As of the end of 2022, Anhui had a permanent population of 61.27 million, a total GDP of 450.45 billion yuan, and a per capita GDP equivalent to 10,949 USD [40-42]. This places Anhui slightly behind in the “three provinces and one city” economic circle of the Yangtze River Delta and at a medium development level in the Yangtze River Economic Belt. Geographical and water resource endowments contribute to the significant north-south regional economic disparities within the province. In 2021, Anhui Province’s annual industrial wastewater discharge was 404.48 million tons, and urban wastewater discharge was 228.288 million cubic meters. The per capita water resource was 1,446.12 million cubic meters, higher than the national average, indicating abundant water resources and an improving provincial water resource carrying capacity [43-46].
Table 1.
Input-output indicators.
Absolute β Convergence Model Analysis
The model for absolute β convergence is as follows:
In this model, WGTFP represents the Green Total Factor Productivity of water resources, i represents the city, and t represents the reporting period. The constant term is α, and t represents the year. β is the parameter to be estimated, while μ and η respectively represent city fixed effects and time fixed effects; ε is the random error term. When β<0, it indicates that cities with higher green total factor productivity of water resources in the base period converge more slowly in their development process. This implies that the gap in total factor productivity of water resources between cities is narrowing; conversely, a positive β suggests that the disparity is widening. Additionally, the absolute value of β represents the speed at which cities with lower green total factor productivity of water resources are catching up to more developed cities. A larger absolute value indicates a faster catch-up speed.
Results and Discussion
Trends and Determinants of Efficiency Indices in Anhui's Cities from 2010 to 2018
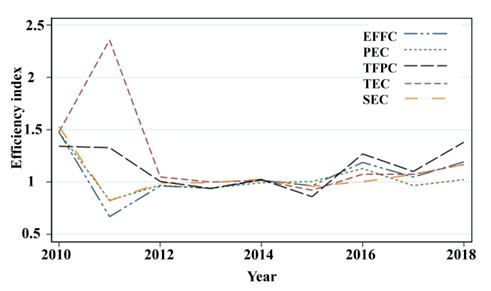
Fig. 1 depicts the trends of different efficiency indices over a period from 2010 to 2018, with various line styles to represent each index. All indices show some level of decline between 2010 and 2012. There is a peak in most indices around 2011, followed by a drop in 2012, suggesting a possible common factor affecting all indices around these years. From 2013 onwards, all indices seem to stabilize without any significant peaks or troughs, which might indicate that the factors influencing these indices have reached some equilibrium or the changes made have had a lasting effect. Overall, despite significant fluctuations, the TFPC of the 16 cities in Anhui Province has generally been above 0.86 in the past nine years, with an annual average of 1.14. Analyzing the decomposed indices, the TEC underwent significant changes from 2010 to 2012, indicating breakthrough developments in technology. Since 2012, TEC has been greater than 1, indicating a steady expansion of the production frontier each year. The PEC has been stable, with a PEC average of about 1, signifying full utilization of technology and management in recent years. The SEC has fluctuated slightly around 1 since 2012, with an annual average of 1.06. An SEC greater than 1 indicates an overall improvement in scale efficiency in these cities. PEC and SEC together affect EFFC. Over the analyzed nine years, the SEC had a more significant impact on EFFC, with an annual average EFFC of about 1.05, indicating that the cities’ technical level and capabilities are continuously narrowing the gap with the frontier. The nine-year data changes for the 16 cities show that EFFC changes and SEC changes jointly affect TFPC, with TEC having a greater contribution to TFPC, mirroring the trend of TFPC. Future development in these 16 cities should increase investment in scientific and technological innovation and vigorously promote technical-level progress and innovation.
Analysis of Regional Heterogeneity in Water Resource Utilization Efficiency in Anhui Province
Based on the geographical location of each city relative to the Yangtze and Huai Rivers, Anhui Province is divided into three major regions: Southern Anhui, Central Anhui, and Northern Anhui. As shown in Fig. 2, from 2010 to 2018, the total factor productivity in the three major geographical divisions of Anhui generally showed a trend of initially decreasing and then increasing, with the average values all exceeding 1. This indicates that the overall trend of water resource utilization efficiency in these three regions of Anhui Province is positive. Comparing the average total factor productivity over nine years from 2010 to 2018 in the three regions, the average in Northern Anhui is 1.075, in Southern Anhui is 1.089, and in Central Anhui is 1.306, with the total factor productivity being Central Anhui > Southern Anhui > Northern Anhui, reflecting that the water resource utilization efficiency is best in Central Anhui and worst in Northern Anhui. Comparing the fluctuations in total factor productivity each year in the three regions, Northern Anhui and Southern Anhui have smaller fluctuations, with the total factor productivity in Southern Anhui fluctuating within the range of 0.962 to 1.402 and in Central Anhui fluctuating within the range of 0.891 to 1.350. The patterns of change in the two regions are largely consistent, displaying a relatively stable average level of total factor productivity. Nonetheless, Southern Anhui exhibits marginally superior total factor productivity compared to Northern Anhui. Conversely, Central Anhui experiences a more pronounced fluctuation range in total factor productivity, varying from 0.858 to 2.161, which is notably wider than the ranges observed in the other two regions.
From 2010 to 2015, the total factor productivity in Southern Anhui, Northern Anhui, and Central Anhui all showed a downward trend, indicating significant issues in the input-output structure of water resource utilization in these regions (Table 2). In 2015, the trend of total factor productivity changed in all three regions, shifting from a decline to an increase, and achieved progress from less than 1 to greater than 1 in 2016- 2017. Especially in Central Anhui, there were significant increases in 2015 and 2017, suggesting improvements in technology or scale in those years. The sharp drop in total factor productivity in 2016 indicates that the technical efficiency or scale efficiency was not stable, but the overall development trend is positive. Although the total factor productivity efficiency in Southern Anhui and Northern Anhui after 2015 was lower than in Central Anhui, it has been steadily increasing, indicating that the input-output structure in Southern Anhui and Northern Anhui is more reasonable, resource allocation is relatively efficient, and the future development trend is stable and positive.
Convergence Test of Total Factor Productivity of Water Resources in Anhui Province
Under the framework of neoclassical economic theory, absolute β convergence refers to the process where the Green Total Factor Productivity of water resources (WGTFP) in the cities of Anhui Province gradually converges to the same level [47-50]. This is characterized by growth along the same trajectory, ultimately reaching the same equilibrium state. In the case of absolute convergence, regions with lower green total factor productivity of water resources have a significant “late-development advantage”, as their rate of convergence in green total factor productivity is faster than that of regions with higher green total factor productivity.
After regression analysis using Stata 16.0, the results show that the regression coefficient β value for the entire province is -0.854, significant at the 1% confidence level (Table 3). This indicates a significant absolute β convergence trend in the overall green total factor productivity of water resources among the cities in Anhui Province, with disparities gradually decreasing and a trend toward convergence. The β values for the three regions of Northern Anhui, Southern Anhui, and Central Anhui are -0.757, -1.055, and -0.771, respectively, all significant at the 1% level. This suggests that water resource utilization efficiency within these three regions also exhibits an absolute convergence trend, with the speed of convergence being Southern Anhui > Central Anhui > Northern Anhui.
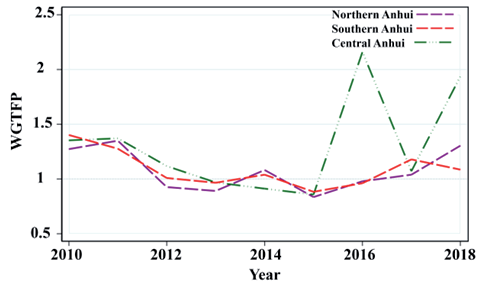
Table 2.
Changes in the Malmquist Index of Cities in Anhui.
Table 3.
Regression Results of the Overall Green Total Factor Productivity of Water Resources Among Cities in Anhui Province.
Conclusions
This study focuses on the three major geographical regions of Anhui Province as the research subjects, measuring the water resource utilization efficiency from 2010 to 2018. With the aid of the Malmquist index model, this study further analyzes the factors affecting water resource utilization efficiency, arriving at the following main conclusions: (1) In terms of the factors affecting water resource utilization efficiency in Anhui Province, changes in technical efficiency and scale efficiency both influence the total factor productivity, and both have a positive effect. Specifically, technological progress is nearly consistent with the trend of total factor productivity and has a significant impact. (2) From 2010 to 2018, the water resource utilization rates in the central, southern, and northern regions of Anhui showed a trend of first declining and then increasing. The average total factor productivity was highest in Central Anhui, followed by Southern Anhui, and then Northern Anhui. (3) There is a significant absolute β convergence trend in the green total factor productivity of water resources among various cities within Anhui Province, indicating a gradual convergence in the green total factor productivity of water resources across these cities. The efficiency of resource utilization in Northern Anhui, Southern Anhui, and Central Anhui is exhibiting a trend of absolute convergence, with Southern Anhui leading in convergence rate, followed by Central Anhui, and then Northern Anhui. Strengthening technological innovation and regional coordination, combined with water situation reforms, implementing intensive and economical water resource utilization, and promoting a water-saving production and lifestyle, will help enhance water resource utilization efficiency, thereby facilitating the green transformation of industries and the construction of a water-saving society.

