

Introduction
In recent years, China’s fisheries have been developing in a positive direction, with the scale of fishery production gradually expanding and the total output value of fisheries increasing year by year [1]. However, driven by economic benefits, the aquaculture industry adopts an extensive aquaculture model. In order to obtain higher economic benefits, this aquaculture model invests a large number of seedlings in limited aquaculture areas and obtains as many fish products as possible through fertilization or bait feeding. At the same time, the production of residual bait, debris, fish excrement, and applied fertilizer drugs decompose and consume dissolved oxygen in water bodies, causing a decrease in dissolved oxygen and an increase in ammonia nitrogen in aquaculture water, leading to a deterioration of water quality. Additionally, aquaculture wastewater is discharged outward, causing damage to the surrounding environment. These sewage discharges flow into the river, causing various toxins to be produced in the water flow, polluting the water, soil, and air [2]. To cope with the impact of sewage discharge on the environment, the tail water is treated. However, the sewage treatment process is actually a process of carbon emissions, where carbon dioxide mainly comes from the energy consumption process of sewage treatment facilities [3]. At the same time, fishery production is also one of the sources of carbon emissions. In addition to the carbon released by the growth and metabolism of aquatic organisms themselves, energy consumption, such as fuel for motorized fishing vessels and electricity for aquaculture equipment is the main source of carbon emissions in the aquaculture and fishing industry. The greenhouse gases generated by the combustion of fossil fuels are the main source of carbon emissions from marine fishing [4]. Based on this, the green and sustainable development of the fishery economy with the goal of decoupling sewage discharge, carbon emissions, and fishery economic growth has attracted much attention.
Exploring the relationship between carbon emissions, sewage discharge, and fishery economic growth is particularly important, as it can be said to be a prerequisite for green and sustainable development of fisheries. At present, more and more scholars are focusing on studying the relationship between economic growth and carbon emissions [5-9], the relationship between agricultural production and carbon emissions [10-14], and the relationship between economic growth, energy consumption, and carbon emissions [15-20]. But, very few scholars closely pay attention to the relationship between fisheries production and the environment, and even when considering carbon emissions from fisheries production, they are limited to the relationship between marine fisheries and carbon emissions [22-25]. In fact, there are sewage and carbon emissions in fishery production and aquaculture, and the pollution to the environment cannot be ignored.
Therefore, existing research results provide meaningful theoretical basis and reference for this study, but there are also issues that need further research. This article uses decoupling theory to analyze the relationship between sewage discharge, carbon emissions, and fishery economic growth and categorizes and summarizes the development between fisheries and the environment based on the decoupling status between the three. At the same time, in order to make China’s fishery development take the path of green, healthy, and sustainable development, relevant policy recommendations for fishery economic development are proposed.
Material and Methods
Indicator Selection
Development of Fishery Industry in China
Fishery industry is an important part of agriculture in China. After decades of rapid development, the Chinese fishery production scales has increased significantly. China becomes the main fish producer and largest exporter in the world [26]. Fisheries and aquaculture remain important sources of food, nutrition, income and livelihoods for hundreds of millions of people in China, the aquatic products per capital consumption in 2021 has reach to 14.2 kg, an increase of 2.6% year-on-year [27]. This significant growth in fish consumption has enhanced people’s diets through diversified and nutritious food.
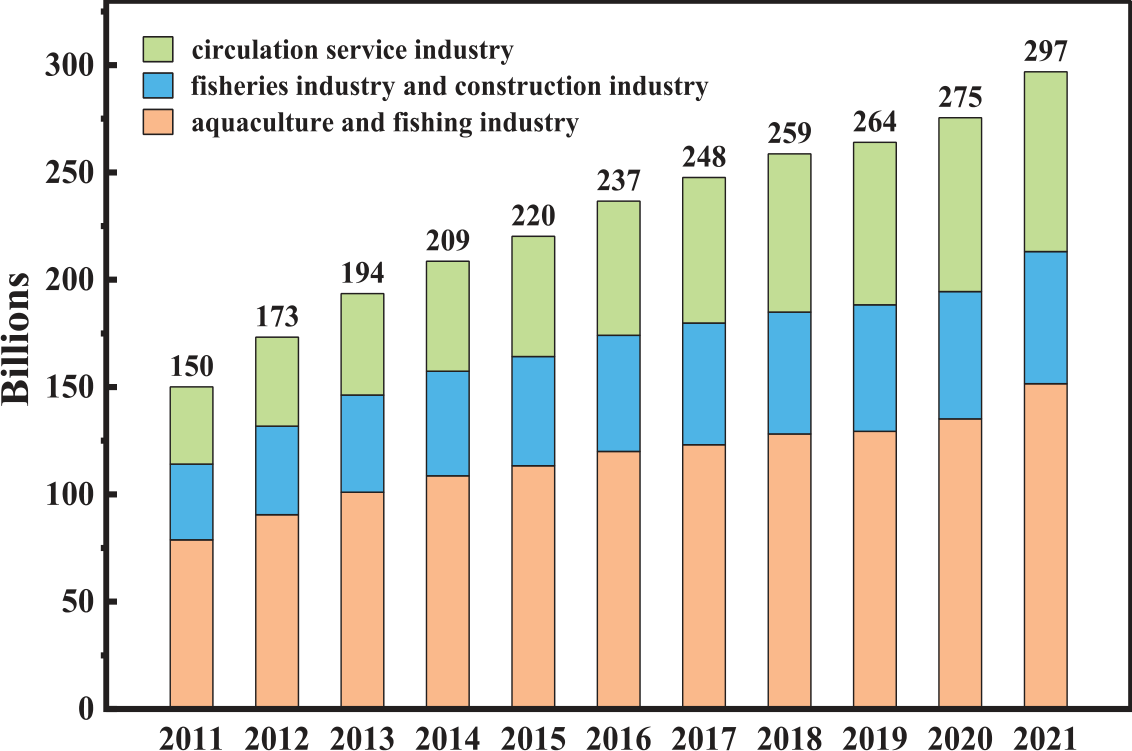
In 2021, Chinese fishery output value reached to 296.90 billion yuan. It has formed aquaculture and fishing industry, fisheries industry and construction industry and circulation service industry. The fishery industrial structure is increasingly reasonable. Fig. 1 have shown the situation of fishery industry structure from 2011 to 2021. In 2011 fishery output was 150.05 billion yuan, the proportion of three fishery industries were 52.5%, 23.5% and 24.0% respectively. In 2021 the fishery output had reached to 296.90 billion yuan, the aquaculture and fishing industry output value was consistently one half of it. And the proportion of fishery-processing industry and circulation service industry had reached to 20.7.% and 28.2%. In the past decade, the value of fishery industry structure close to the ratio of 2:1:1.
Waste Water Discharged in China
As a result of the limitation of fishery production by fishery waters, coastal area has become the major force in fishery production because of the geographical advantages. In the mean while coastal economically developed areas are both the densely populated and highly industrialized accompanied by a large number of industrial wastewater and sewage discharge which seriously impeded the aquaculture industry development. Changes in ecosystems include the extraction of mineral resources, pollution from vessel traffic, and construction of infrastructure for oil development [28]. This land-based activities make the eutrophic wastewater cannot self-purification, it will destroy the environment of inland waters and the sea water. It modify or destroy natural habitats, cause runoff of sediments, nutrients, toxins, and pollutants [29].
The main pollutant emissions in waste water and the national sewage emissions, total sewage discharged and total Nitrogen increased during Twelfth in the past decade (Table 1). Nevertheless Ammonia Nitrogen and Petroleum decreased in this period. The COD and Total Phosphorus showed U shape tendency. According to the latest "Report on the Ecological Environment of China's Fisheries", the marine ecological environment in China will steadily improve in 2021, including continuous improvement in overall seawater quality and overall good environmental quality in major sea use areas. However, the overall water quality of rivers entering the sea is slightly polluted, and the eco-environment quality of some coastal areas needs to be improved.
Carbon Emission in China
China’s economic growth rate has always been maintained at a high level, and the total carbon emissions of various industries in the country are still rising, which will pose significant challenges to the green development of the ecological environment and human survival and reproduction. As the world’s largest economic power in terms of total carbon emissions, while developing its own economy, China is also an important task that cannot be ignored in further reducing carbon emissions [30]. In order to solve the problem of carbon emissions, China has put forward the goals of “carbon peaking” and “carbon neutrality”, that is, China’s total CO2 emissions should reach the peak by 2030 and reach carbon neutrality by 2060. Reducing carbon emissions is the key to continuously promoting ecological civilization construction and achieving sustainable development of green economy in China.
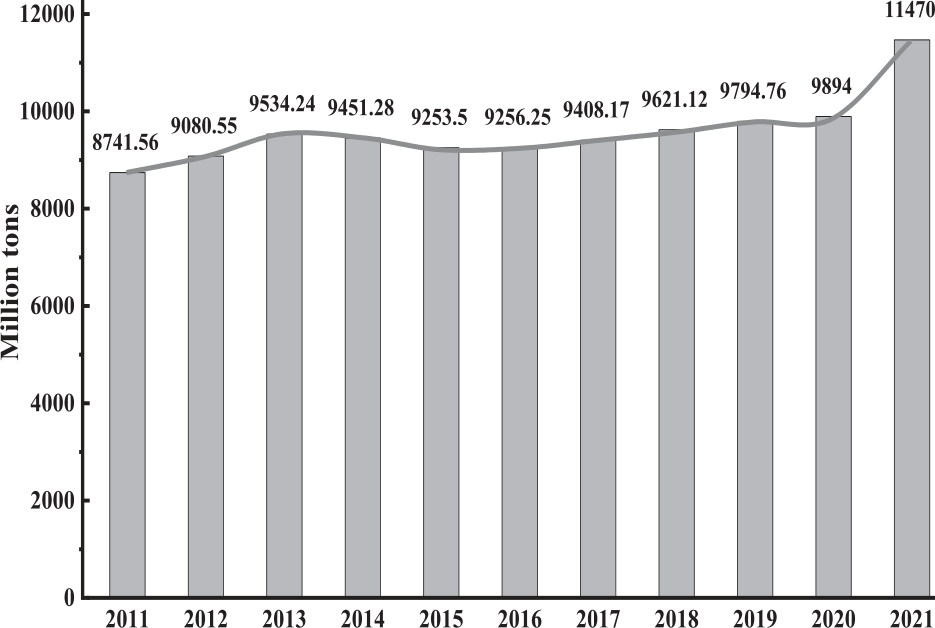
It can be seen from Fig. 2 that China’s total carbon emissions and its proportion in global carbon emissions from 2012 to 2021. During the research period, China’s carbon emissions continued to grow, reaching 11.47 billion tons by 2021, but their growth rate has decreased, with an average annual growth rate of 2.86%. At the same time, China’s carbon emissions have always maintained a relatively stable proportion in the world, which is in line with the development of China’s economy.
Table 1.
Main pollutant Emission in waste water and the total sewage emissions.
The Theoretical Framework
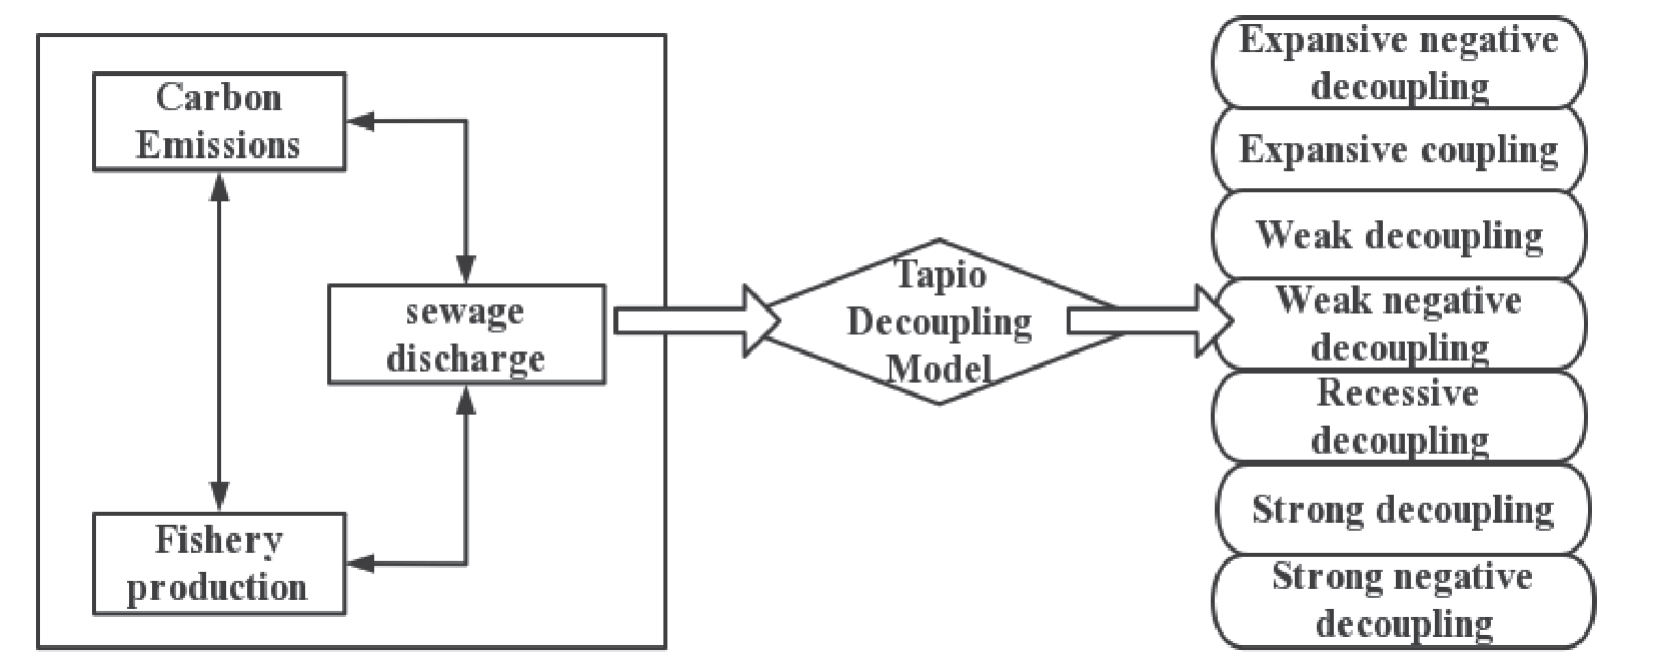
To clarify the relationship between carbon emissions, sewage discharge, and fishery production, it is necessary to study and construct an econometric model for decoupling relationships. So far, there are two methods to analyze the decoupling effect: the OECD decoupling model [31] and the Tapio decoupling model [32]. The OECD decoupling method calculates the decoupling value based on a fixed base period. When the base period changes the results will change accordingly, which are not stable, especially when the sample period selected in the time series has a large span. The Tapio model takes into account two indicators: relative quantity change and total quantity change, and uses an elastic analysis method on a time scale to reflect the decoupling relationship between variables. This overcomes the difficulty in selecting the base period for the OECD decoupling model and further improves the objectivity and accuracy of decoupling measurement. At the same time, the Tapio decoupling indicator contains 8 decoupling states, which can more accurately reflect the decoupling relationship between carbon emissions, sewage emissions, and fishery production in different situations.
Therefore, this paper uses the Tapio decoupling elastic analysis method to analyze the decoupling relationship between carbon emissions, sewage discharged and fishery production in China (Fig. 3).
Decoupling Coupling Model
The traditional decoupling theory can be used to obtain the change process from coupling to decoupling between economic growth and the environment [33], such as formula:
According to the formula (1), the modified decoupling index model can evaluate the coupling relationship between fishery production, sewage discharge, and carbon emissions, and the formula has been designed as follows:
The expression of the emission reduction elasticity between carbon emissions and sewage discharged is (2):
The expression of the emission reduction elasticity between carbon emissions and fishery industry is (3):
The expression of the elasticity between sewage discharged and fishery industry is formulated as (4):
Among them: Ci is the carbon emissions; Wi is the sewage discharge; Fi is the economic output value of marine fisheries; Tia is the carbon emissions growth elasticity of sewage discharge; Tib is the economic growth elasticity of the carbon emissions; Tic is the economic growth elasticity of the sewage discharge.
Assessment of the Decoupling States
Each decoupling state has a different meaning, and the characteristics of each state are also different. Tapio divides the decoupling state of economic growth and environmental pressure into three states: decoupling, negative decoupling, and coupling. Decoupling refers to a relatively ideal state where the speed of economic growth is relatively higher than the speed of environmental pressure increase, negative decoupling refers to a state where the speed of economic growth is relatively lower than the speed of environmental pressure increase, and coupling refers to a state where the speed of economic growth and environmental pressure increase are relatively synchronous. Evaluation criteria for coupling relationship based on indicator values and their economic significance. There are eight states of decoupling elasticity indices, as shown in Table 2.
Results and Discussion
Using the revised formula (2-4), calculate the coupling index between sewage discharge environmental indicators, carbon emissions, and fishery production development during the research period and determine the decoupling state.
Sewage Discharge and Fishery Production
From Table 3, it can be seen that the decoupling states between the three environmental indicators and fishery production are mainly concentrated in strong decoupling, weak decoupling, and expansive negative decoupling. Evaluate the relationship between these three environmental indicators and fishery production based on their decoupling states:
Firstly, the decoupling state between sewage discharge and fishery production can be divided into three stages. The first stage is from 2012 to 2017, where there is a weak decoupling between the overall sewage discharge and fishery production. As the fishery economy grows, the amount of sewage discharge also increases, but at a slower pace. The second stage is from 2018 to 2019, where the two are in an expansion negative decoupling. During this period, the fishery economy and sewage discharge continue to show an upward trend, but the growth rate of sewage discharge is greater than the speed of economic growth. The third stage is from 2020 to 2021, and the decoupling state between fishery economic production and sewage discharge tends to be ideal.
Secondly, there has been a strong decoupling between COD emissions and fishery production, which means that the development of the fishery economy has not caused any interference in the management of COD emissions. Until 2018, the COD emissions in wastewater nationwide began to increase, and the growth rate was much faster than the economic growth rate. By 2021, COD emissions have slowly decreased compared to the previous year, and the state between the two has also begun to return to a strong decoupling state.
Thirdly, the degree of decoupling between Ammonia Nitrogen and fishery production growth between 2012 and 2021 is extremely high. Except for a brief weak decoupling state in 2020, all other years are in a strong decoupling state, and the fishery economy and Ammonia Nitrogen control are highly synchronized.
Carbon Emissions and Fishery Production
According to Table 4, it can be found that during the research period, the decoupling relationship between carbon emissions and fishery production growth in China was not stable, and in most years, both were in a weak decoupling state; In 2014 and 2015, it was in the strong decoupling state, indicating an increase in fishery output value but a decrease in carbon emissions; The decoupling state in 2021 is the least ideal, with a expansive negative decoupling state, indicating that with the increase in fishery output value, carbon emissions are also significantly increasing. At the same time, from the perspective of elastic values, the decoupling state of the two has developed from positive to negative, indicating that although China's fishery output has increased in recent years, carbon emissions have also significantly increased.
Table 2.
Decoupling indicator grade and elasticity value.
Table 3.
Elastic index of sewage discharge and fishery production.
Carbon Emissions and Sewage Discharge
According to research on carbon emissions and sewage discharge, the main pollutants in wastewater discharge have minimal impact on carbon emissions, and the main contributor is the carbon emissions generated during the overall sewage discharge treatment process. Therefore, the decoupling relationship between the overall sewage discharge and carbon emissions is evaluated by removing the main pollutant indicators. Table 5 shows that from 2014 to 2020, China’s sewage discharge and carbon emissions were in a good decoupling state, with strong decoupling in 2014 and 2015, indicating that China’s sewage discharge has increased in the past two years, but the effectiveness of sewage treatment has been remarkable, and carbon emissions have decreased; The remaining 5 years are in a weak decoupling state, indicating that the growth rate of carbon emissions slows down as sewage emissions increase. In addition, in 2013 and 2021, sewage discharge increased and carbon emissions accelerated, indicating expansive negative decoupling.
Fishery Production, Carbon Emissions and Sewage Discharge
In the study of decoupling in fishery production, carbon emissions, and sewage discharge, four main decoupling states were found, namely: strong decoupling, weak decoupling, expansive coupling and expansive negative decoupling. In order to better analyze the decoupling relationship among the three, the calculated elastic coefficients were plotted a three-dimensional graph (Fig. 4).
Table 4.
Elastic index of carbon emissions and fishery production.
Table 5.
Elastic index of carbon emissions and sewage discharge.
Fig. 4.
A three-dimensional graph of the elasticity index of sewage discharge, carbon emissions and fishery production from 2012 to 2021.
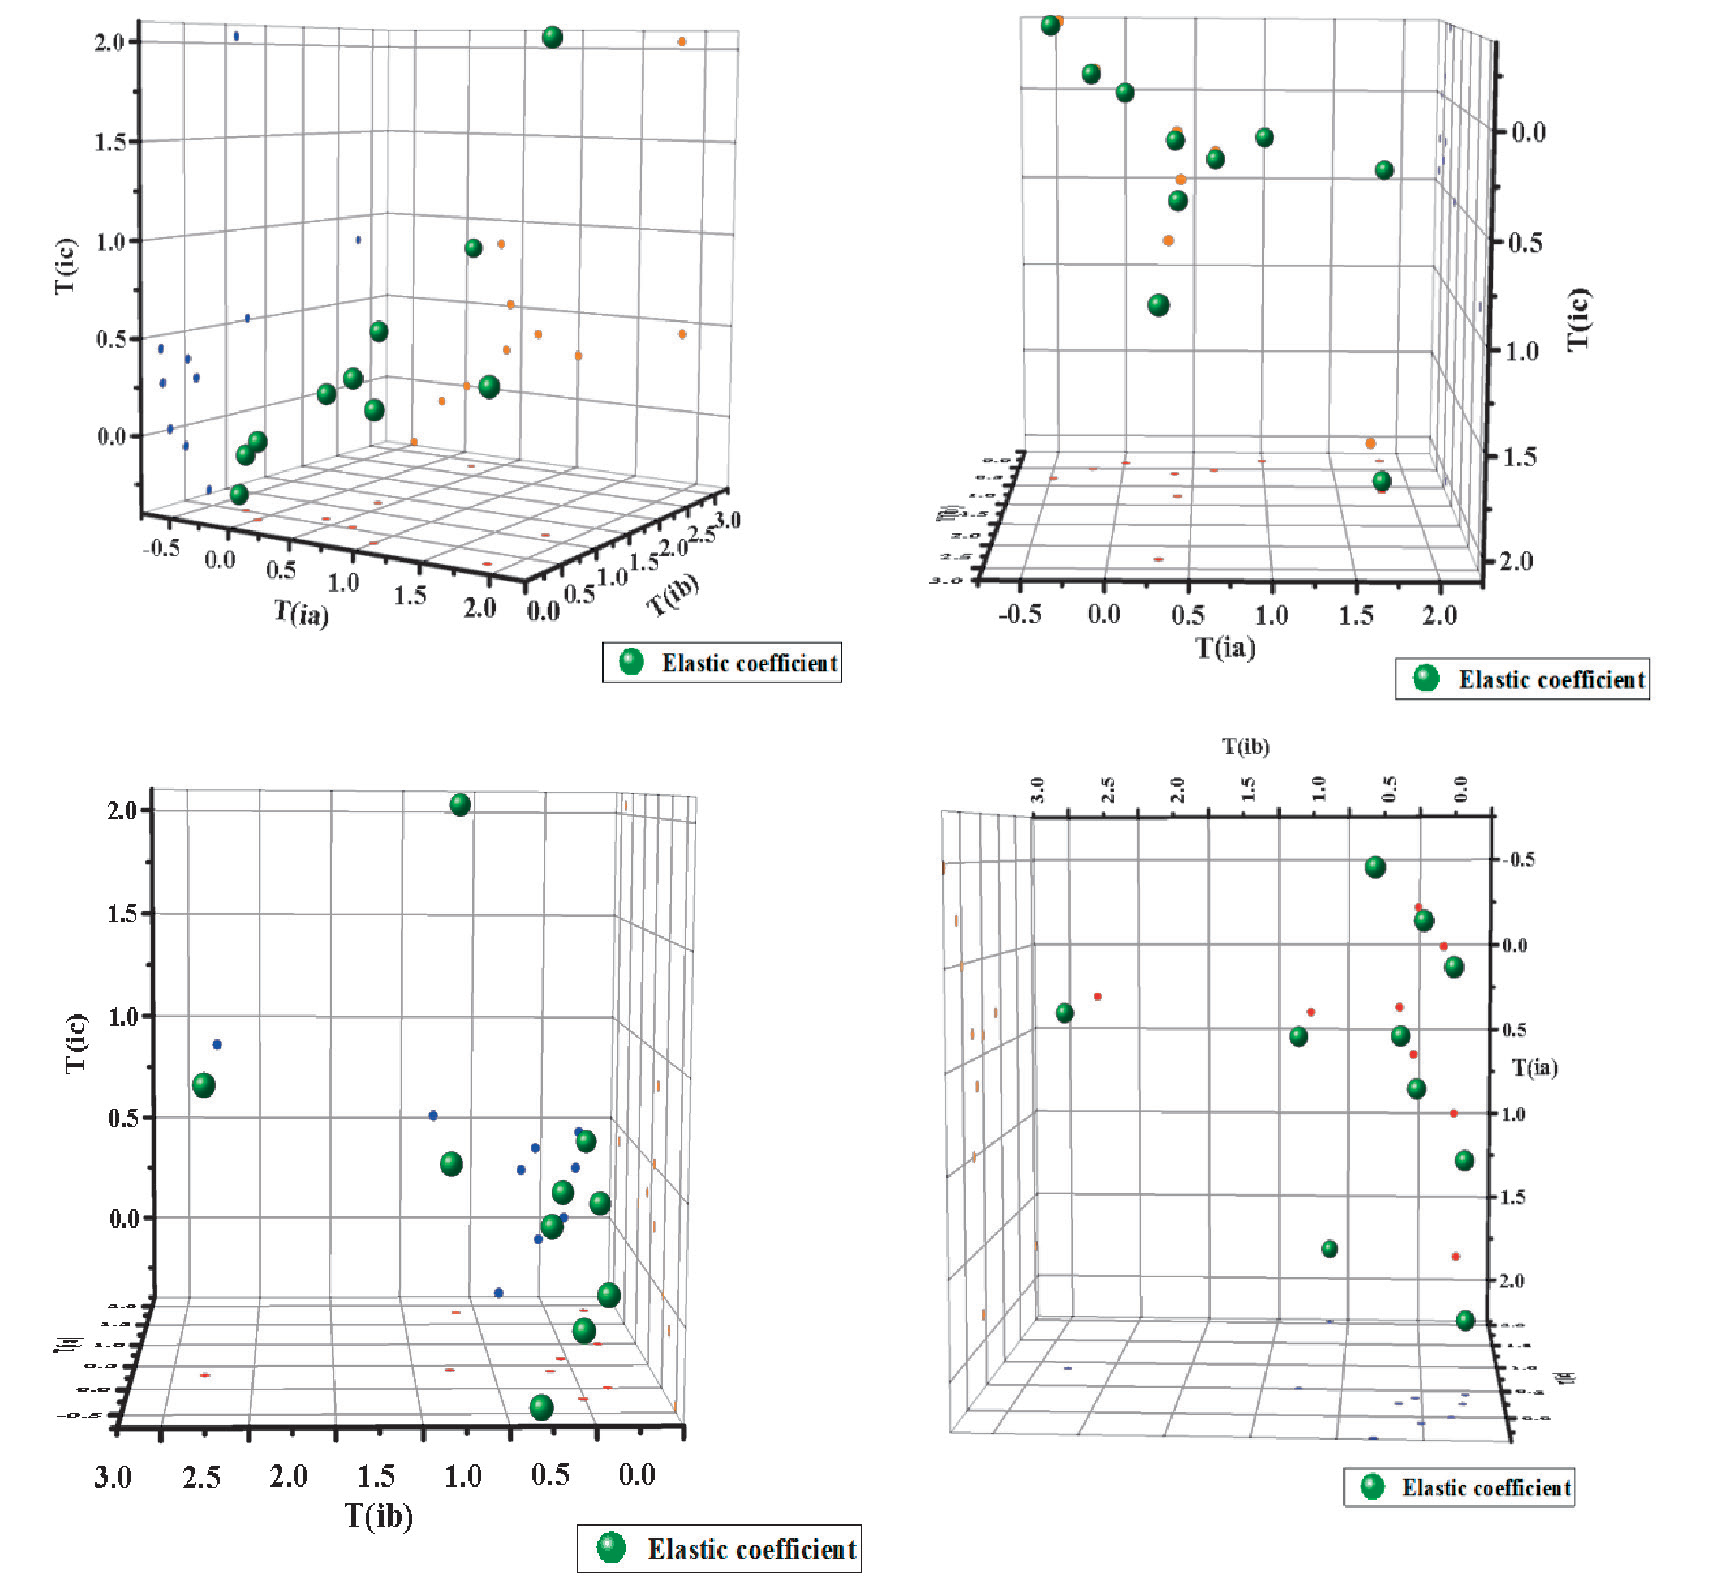
Fig. 5.
Elasticity index of China’s sewage discharge, carbon emissions and fishery production from 2012 to 2021.
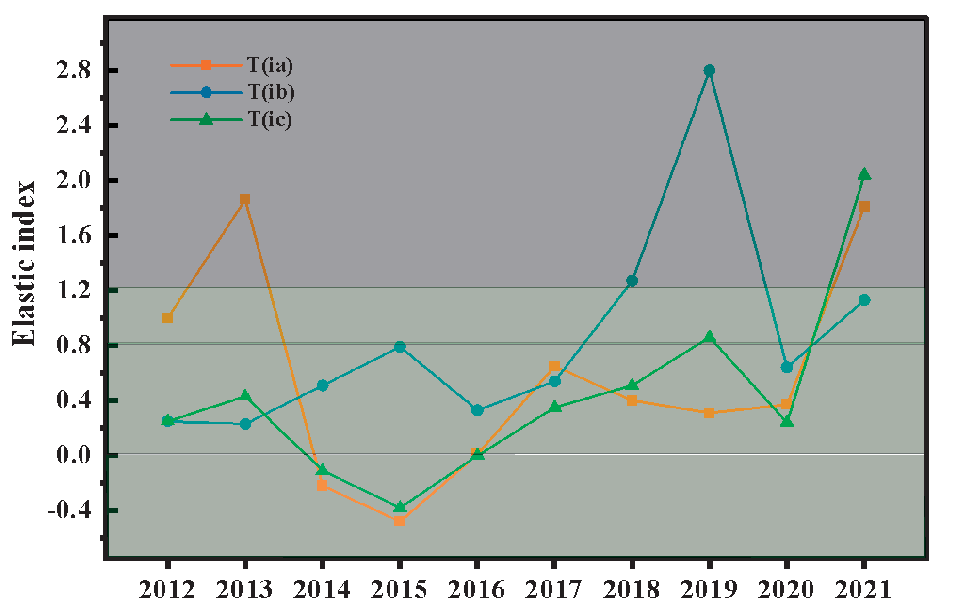
At the same time, draw a line in Fig. 5, and divide it into four areas based on the decoupling coefficient, of which less than 0 is strong decoupling, 0-0.8 is weak decoupling, 0.8-1.2 is expansive coupling , and more than 1.2 is expansive negative decoupling.
According to the economic significance of the decoupling model, the decoupling relationship between, carbon emissions, sewage discharge and fishery production from 2012 to 2021 can be divided into three types: environmentally friendly, conventional, and polluting.
The first type is environmentally friendly, mainly occurring in 2014 and 2015. Carbon emissions showed a downward trend, corresponding to effective treatment of sewage discharge. The fishery production showed an overall upward trend, and carbon emissions were strong decoupling from the other two. At the same time, the growth rate of sewage discharge during this period was slower than the speed of economic growth. This means that the connection between the three is no longer close, and carbon emissions, sewage emissions and fishery production do not interfere with each other and develop independently. The overall relationship between fishery production and the environment is moving towards an environmentally friendly direction.
The second type is the conventional type, which generally exists between the three relationships. In this type, the relationship between the three is mainly characterized by weak decoupling and expansive coupling. In 2016 and 2017, the three showed a weak decoupling state, with prominent independence and weakened dependence. This indicates that the accelerated development of the fishery production has not accelerated the discharge of sewage and carbon, and the impact of sewage and carbon emissions on the development of the fishery production is relatively small. In 2012, the decoupling elasticity coefficient between sewage and carbon emissions reached 1, indicating that the growth rate of sewage and carbon emissions was almost the same. Moreover, the growth rate of the fishery economy during the same period was relatively higher compared to sewage and carbon emissions. This means that the development of fishery production accelerated, while the speed of carbon and sewage emissions slowed down, showing weak independence between the three.
The third type is pollution type. In order to more intuitively analyze the decoupling status between the three during the research period, pollution types are further divided into mild pollution type and severe pollution type. The mild pollution type mainly manifests as a state of negative decoupling between certain two, including 2013, 2018, 2019, and 2020. From 2018 to 2020, there was a weak decoupling between sewage discharge and carbon discharge, while there was a negative decoupling between sewage discharge and fishery product. This indicates that sewage discharge and fishery economy grow simultaneously, and the growth rate of sewage discharge is faster. In these three years, there has only been a weak decoupling or expansive coupling between carbon emissions and the fishing economy, and carbon emissions continue to increase with the growth of the fishing economy. The independence of carbon emissions, sewage discharge, and fishery production is weak, and there is a dependency between their development, which hinders the coordinated development of economy and environment. Therefore, we classify them as mild pollution type. The severe pollution during the research period was only manifested in 2021, with carbon emissions, sewage discharge, and fishery production showing expansive negative decoupling. This indicates a strong dependence among the three, and the failure to achieve green and sustainable development between fishery economy development and the environment.
Conclusion
From 2012 to 2021, there were four stages of decoupling between sewage discharge, carbon emissions, and fishery production growth: weak decoupling, strong decoupling, weak decoupling, and decoupling. The relationship between sewage discharge, carbon emissions, and fishery production was in a conventional state between 2012 and 2016 to 2017, and showed a strong decoupling between 2014 and 2015, in an environmentally friendly state, It was in a polluting state between 2013 and 2018 to 2021. Based on the decoupling status and decoupling coefficient of the three in the past decade, it can be seen that the decoupling status between sewage discharge, carbon discharge and fishery production growth is becoming increasingly weak, and the negative impact of the fishery economy on the environment is increasing. Moreover, sewage discharge and carbon emissions also hinder the development of the fishery economy, leading to the failure to achieve green and sustainable development between the fishery economy and the environment.
Recommendations
Through the analysis of the decoupling relationship mentioned above, we know that the decoupling between fisheries and the environment is in a disadvantageous state. In order to achieve sustainable development of fisheries, we propose the following recommendations:
1. Optimize the aquaculture mode. Reasonable control of aquaculture density, standardized transformation of aquaculture ponds, improvement of inlet and outlet facilities, and provision of water quality purification and environmental protection equipment; Promote the use of efficient formula feed and reduce the feeding of fresh and miscellaneous fish; Vigorously develop aquaculture of shellfish and algae, as well as comprehensive aquaculture with multiple nutrient levels, improve the ecological environment of aquaculture, and purify the water environment; Promote circular water aquaculture and comprehensive rice farming techniques to improve water resource utilization efficiency.
2. Strengthen technological innovation and promotion of new technologies. Conduct energy-saving technological transformation on fishing vessels, develop and design energy-saving and environmentally friendly fishing vessels and standardized fishing vessels; Promote the application of new energy fishing vessels and gradually phase out old and wooden fishing vessels that consume high energy. Emphasize the comprehensive utilization of aquatic product processing, improve the processing rate of aquatic products, and produce more small packaged products; Utilize processing waste as resources to reduce carbon emissions during the processing process. At the same time, effective biological treatment technologies are adopted in the treatment of aquaculture wastewater. This treatment technology can not only smoothly purify aquaculture wastewater, but also reduce the impact on the ecological environment.
3. Strengthen government supervision, management, and policy support. Establish and improve the management regulations on the discharge of waste gas, waste water and waste residue generated in the process of aquaculture, establish the water resource fee collection policy, carry out the assessment of clean production in aquaculture, restrict extensive production methods, and force the industry to implement the transformation of production mode. On the other hand, active funding support policies should be formulated, and special support projects should be established to promote the transformation and upgrading of the modern fishery industry, such as improving pond facilities, upgrading the infrastructure of the circulating water aquaculture system, and providing subsidies for the purchase of water quality control equipment. Advanced equipment and production methods should be strongly encouraged to help aquaculture embark on a path of healthy development.

