

Introduction
Since the signing of the United Nations Framework Convention on Climate Change in 1992, we have been concerned about whether implementing policies can solve the problem of environmental pollution [1]. Countries have proposed a series of governance methods for energy saving and emission reduction, hoping to realize this vision through technological interventions [2, 3] or policy interventions [4, 5] in industry [6], agriculture [7], and other fields.
The global sports market reached $388.28 billion in 2020 and is expected to reach $599.9 billion by 2025, with a CAGR of 8% [8]. This shows that the sports market still has a large potential for development and occupies an important position in the international economy. FIFA estimates the global fan base to be 4 billion people, accounting for about half of the world’s population. Other sports, such as basketball and tennis, also have large audiences. At the same time, it promotes the generation of sports fan culture [9, 10], increasing the public’s willingness to watch sports events. Current research on sports events focuses on enhancing economic benefits [11], promoting local tourism [12], creating fan culture [13], etc., and there is relatively little research on the sports environment.
As sports events are held more frequently and on a larger scale, the negative impacts of sports events on the climate and the environment are becoming greater, especially the carbon emissions and the total carbon footprint of sports events [14]. Gradually, the public found that organizing sports events will affect carbon emissions, which in turn will affect the environment and climate, and the environment and climate will also affect the development of sports events, which will eventually form a mutual influence mechanism [15, 16]. Along with the IOC’s emphasis on climate, the Brisbane 2032 Olympic and Paralympic Games in Australia will be the first games to be required to actively address climate change through a combination of two levers to achieve emission reduction measures and carbon offsets [17]. The largest international sporting event will lead other sporting events to embrace the concept of energy-saving and emission-reduction events to reduce the problem of increased carbon emissions caused by sporting events. According to the existing research results, it is believed that there is a great correlation between sports and ecology, which gradually derives the concept of sports ecology, an emerging sub-discipline in sports management [18]. Sport ecology is a bidirectional relationship between sport, the natural environment, and the two, focusing on the bidirectional mechanism of action between sports activities and the ecological environment and emphasizing the sustainability of sport. It can be seen that in the field of sports, ecological pollution has become one of the more urgent problems that to be solved.
Environmental management of sports events has received significant attention in recent years. This is because the environment is an important factor affecting athletes’ health and competition performance [19], and using energy at sporting events is one of the major causes of greenhouse gas emissions, which in turn creates a mechanism of mutual influence. Green stadiums are also a key argument, with the International Federation of Association Football (FIFA) introducing mandatory green building certification in 2018 [20], setting out the basic green building requirements for subsequent sporting events hosted by them. The 2022 FIFA World Cup in Qatar is expected to have a carbon footprint of around 3.6 million tons, with stadiums in the build-ready phase accounting for an estimated 72% of these greenhouse gas emissions. Therefore, the concept of “green stadiums” needs to be implemented throughout the stadium’s lifecycle to minimize the stadium’s GHG emissions [21].
Research on the interactions between sports events and climate, ecology, and carbon emissions has increased in the last five years. Based on the analysis of the literature on similar topics, it is found that the main focus is on 1) the impact of climate change on athletes [22], 2) the selection of more appropriate sports event organizers based on environmental factors [23], 3) the impact of environmental change on some sports [24], and 4) the environmental legacy of sports events [25]. Based on the preliminary analysis, it is found that the current research lacks a systematic review of the carbon emissions from sports events, and in the past five years, sports event organizers and relevant international sports organizations have paid more and more attention to the issue of carbon emissions. Therefore, this paper will focus on the connection between the holding of sports events and carbon emissions, which is one of the innovative points of our review.
At present, the carbon emission detection of sports events is still mainly fixed-point detection at different times. For example, at different times during the Olympic Games, carbon concentration monitoring equipment is used to monitor the point. There are also scholars conducting research on urban areas for landscape planning and design spatial and temporal variations in chromium (Cr) concentrations in Picea Orientalis L. Determination for the suitable biomonitors to be used in monitoring the change for reducing the concentration of V in areas with high-level emissions [26]. At present, the monitoring methods of carbon emissions have also been optimized to improve detection accuracy through direct or indirect detection.
Although the carbon emissions from sporting events are not significant and are not comparable to those of other sectors, such as energy [27], agriculture [28], and manufacturing [29, 30], we believe that this aspect of the study deserves attention. Because the number of people participating in sporting events is increasing [31], the frequency of sporting events is increasing, and sporting events are a source of carbon emissions, either directly or indirectly. Therefore, we need to understand the sources of carbon emissions during sports events and study the existing management methods. According to the United Nations Framework Convention on Climate Change, we should not ignore all areas that may affect carbon emissions.
Materials and Methods
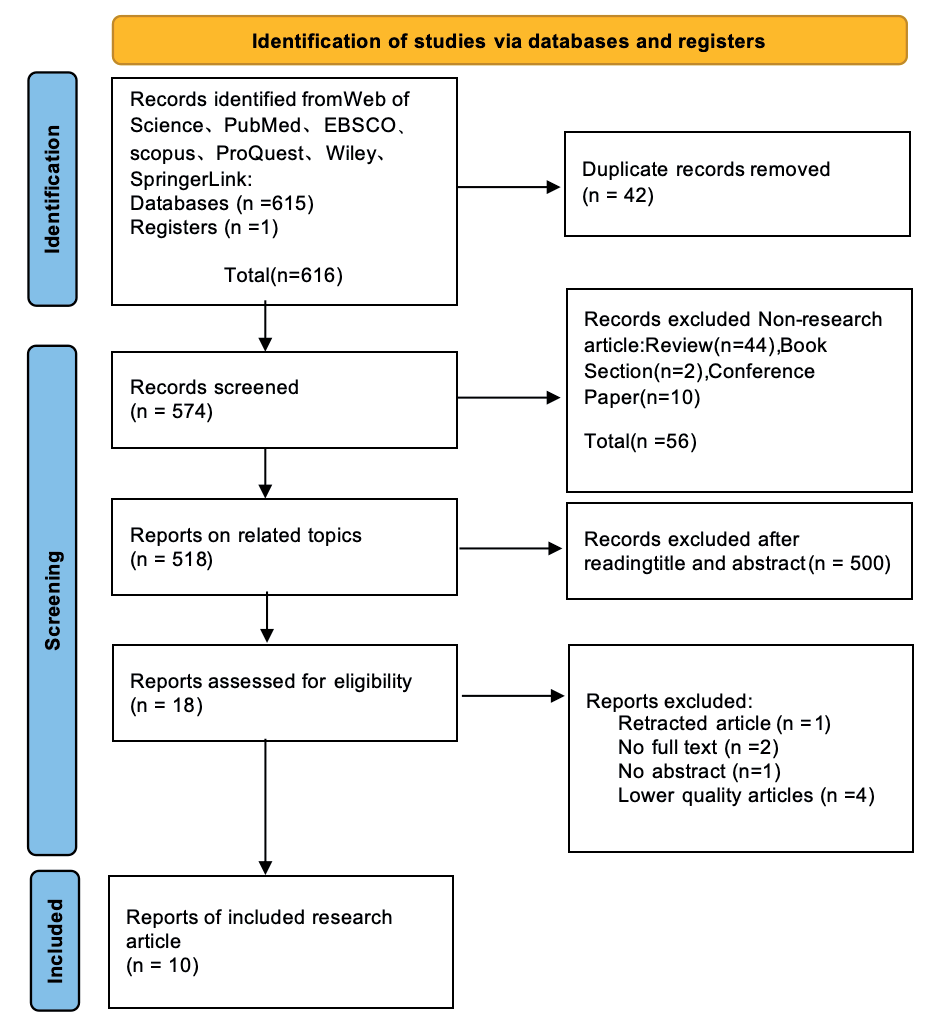
We used a five-step approach for literature screening to get the literature and evidence we needed (Fig. 1). The five steps are as follows:
1) Framing the research question.
2) Specifying the literature inclusion criteria.
3) Determining the search time and search terms.
4) Removing irrelevant literature and screening.
5) Inclusion of literature.
Step 1: Framing the research question
RQ1: What is the evidence on the impact of sporting event hosting on gas emission-related impacts?
RQ2: What initiatives have been taken by sporting events to address carbon emissions, and how effective are they? What is the evidence?
Step 2: Specifying the literature inclusion criteria
Our search process mainly covered sports events and related activities (i.e., tournaments, leagues), where sports events were not required and could accommodate both major and university sports events (minor sports events). During the search process, there was a preference for searching directly for literature with the title or including “sporting events” directly in the abstract section, thus excluding literature on a broader range of studies. For carbon emissions, we focused on the main greenhouse gases, mainly “carbon dioxide”.
Step 3: Determining the search time and search terms
Because the literature requires that the selected articles be relatively new, we limit the search time to 2019-01-01 - 2024-10-11. Other times in the literature are not included, so the time to determine the time of each database search shall prevail, respectively, in Web of Science, PubMed, EBSCO, Scopus, ProQuest, Wiley, and SpringerLink databases. We applied the Boolean search approach [32] and uniformly specified the search formula as (“sports events” OR “sports game” OR “match sports” OR “competition”) AND (“carbon emission” OR “carbon”), including as far as possible all relevant literature.
Step 4: Removing irrelevant literature and screening
Because a variety of databases are used, duplicate records will inevitably appear in them. For the first time, all the literature involved was imported into EndNote20 software, and the first work of deleting duplicate records was carried out using the self-checking function. Afterward, Jing-Xuan Zhou and Qi-Fei Xia performed manual checking to avoid the appearance of literature not checked by the software.
In this review, in order to ensure that the studies included in the literature are all available literature, we deleted the Review, Book Section, and Conference Paper. All included literature must be published in English. In the collation of literature, it should be guaranteed that the literature is related to “sports events” and “carbon”, so Jing-Xuan Zhou, Qi-Fei Xia, and Yi-Ning Qin screened all the included literature to ensure the reliability of the literature. In addition, retracted articles and articles without full text were excluded.
Step 5: Inclusion of literature
The quality of the literature included was assessed for the final inclusion of the literature. The introduction of CASP Check (Critical Appraisal Skills Program Checklist), a set of tools to evaluate the quality of research developed by the non-profit organization Critical Appraisal Skills Program (CASP), is generally described from the perspectives of: Are the results valid? What are the results? Will the results help locally? We chose this quality testing method because the CASP Check is more systematic, the criteria are open and transparent, and it is more widely applicable. The form consists of 10 questions, and Jing-Xuan Zhou and Qi-Fei Xia, who are more familiar with the field, were chosen to assess the quality of the included literature. It will be divided into High, Moderate, and Low according to the quality of the article.
Results
A search was conducted in the Web of Science, PubMed, EBSCO, Scopus, ProQuest, Wiley, and SpringerLink databases, respectively. The search time was controlled to a range of “2019-01-01 - 2024-10- 11”. 615 relevant documents were retrieved, in addition to 1 document that was manually collected, for a total of 616 relevant documents. The relative simplicity of the search terms also made the subsequent screening of the literature more difficult, but it also ensured the comprehensiveness of the literature as much as possible.
The screening process was carried out in two phases. In the first phase, 36 documents were deleted by Endnote’s own screening function, and in the second phase, based on the first phase, Jing-Xuan Zhou and Qi-Fei Xia manually screened and deleted 6 documents. A total of 42 documents were deleted. The total number of documents after screening was 574.
Reviews, Book Sections, and Conference Papers were excluded to ensure the scientific nature of the research and other forms of literature. This systematic review mainly focuses on research articles and ensures the rigor of the research to the greatest extent possible. In the end, 44 Review articles, 2 Book Section articles, and 10 Conference Paper articles were excluded, for a total of 56 removed articles. The total number of literature after screening is 518.
The literature screening flowchart omitted the process of screening English publications. Because of searching databases or other factors, this literature search was all published in English. This screening process did not exclude any literature.
This step was a waste of the researcher’s time and experience because of the simple search formula, resulting in less literature on the research objectives and questions. Jing-Xuan Zhou, Qi-Fei Xia, and Yi-Ning Qin screened this step three times. Literature with slightly different screening results was discussed together until the results were unified. A total of 500 papers were excluded. A total of 18 papers were screened.
The 18 articles were summarized and sorted out, and one article was found to be withdrawn, two articles had no full text, and one article had no abstract, so four articles were excluded again. According to the CASP Check’s scoring criteria [33], we excluded four papers with low ratings. A total of 8 pieces of literature were finally excluded. 10 pieces of literature were included.
Table 1 summarizes the key features of the 10 selected articles, including Title, Authors, Year of Publication, Method, and Appraised quality.
These 10 selected articles cover sports events in China, Finland, Austria, Turkey, and Italy. These studies span from 2019-2024 and do not include literature from 2020. Some selected articles use a team, a certain match, a certain home stadium, etc., as the research object to track the carbon footprint or construct an evaluation model. We conducted a comprehensive search of the 10 selected articles to explore the impact of sports events on carbon emissions and solutions. In recent years, there has been relatively more research on carbon emissions but significantly less on sporting events. In this systematic review, we have included as many articles as possible related to sports events and carbon emissions, most of which have been studied with greenhouse gases such as CO2 as the main target. As sporting events are held more frequently and at a higher level, the relationship between them and carbon emissions is becoming stronger and stronger. There are still significant gaps in this research, and in this regard, we have selected relevant studies from the last five years, distinguishing them from the traditional areas of research on carbon emissions from industry and agriculture.
Discussion
Impact of Sports Events on Carbon Emissions
Major Emissions from the Organization of Sporting Events
Sporting events result in a higher carbon footprint per spectator (see Table 2). David M. Herold et al. [34] used Austrian team Rapid Vienna’s home events as a case study and found that each home event produced an average of 99,548 kg CO2e emissions per event, i.e., 6.0 kg per spectator. Dalia Perkumien˙e et al. [37] conducted a carbon footprint emission study for the men’s Final Four Euroleague Basketball tournament in 2023 and found that fans had an average carbon footprint of 3.003 kg CO2e per person. Lidia Piccerillo et al. [39] found that the per capita carbon footprints for the 75th Italian National University Championships study found a per capita carbon footprint of 63 kg CO2e. The overall result is that each spectator increases their carbon footprint, but there is a large variation in the per capita carbon footprint; firstly, because of the different time spans of the measurements and different choices of sporting event cycles, it will lead to changes in the total amount of carbon footprint. The second is the difference in the equipment and location of the measurements, which makes it difficult to measure accurately and judge only the approximate carbon footprint.
Table 1.
The Main Characteristics of the Selected Articles: Title, Authors, Year of Publication, Method, and Appraised Quality.
Table 2.
Sample country, sporting event, test gas, sample time, conclusion, intervention.
Sporting events do not greatly affect PM2.5 and CO. Tara Kuhn et al. [42] studied gas monitoring before, during, and after the Commonwealth Games 2018 cycle using low-cost air quality sensor monitors known as KOALAs placed at nine locations. They found little change in PM2.5 and CO on the Gold Coast, further demonstrating that sporting events do not greatly affect PM2.5 and CO.
Main Sources of Carbon Emissions from the Organization of Sports Events
The issue of the sources of carbon footprints of sports events encompasses three areas (see Fig. 2). David M. Herold et al., Dalia Perkumien˙e et al., Milita Vienažindienė et al., Stavros Triantafyllidis and Harry Davakos et al. The study concluded that carbon emissions are mainly due to transport, such as aircraft and vehicles, leading to carbon footprint emissions.
David M. Herold et al. [34] selected Rapid Vienna, Austria’s largest football club, and administered questionnaires to spectators at three home matches in order to derive distance traveled and carbon emissions. It was found that 42.4% of the spectators arrived by private car, generating 71.6% of the GHG emissions, while 52.8% of the spectators who used public transport generated only 27.1% of the GHG emissions, to conclude that private cars emit more carbon and are more polluting to the environment.
Dalia Perkumien˙e et al. [37] selected the Final Four Euroleague Men’s Basketball Tournament 2023 as the study object and calculated the carbon footprint of the teams and the fans through a mixed research method, followed by semi-structured interviews with the team managers. The study found that: 1) The total carbon footprint of the four participating teams was 4560.325 kg, with an average carbon footprint of 189.74 kg per person. 2) The total carbon footprint of the fans of the four teams was 4065.686 kg, with an average carbon footprint of 3.003 kg per person. 3) The total carbon footprint of the fans of the four teams was 4,065.686 kg, with an average carbon footprint of 3.003 kg per person. One of the main sources of carbon footprint is the selection of team and fan transport: airplanes and cars.
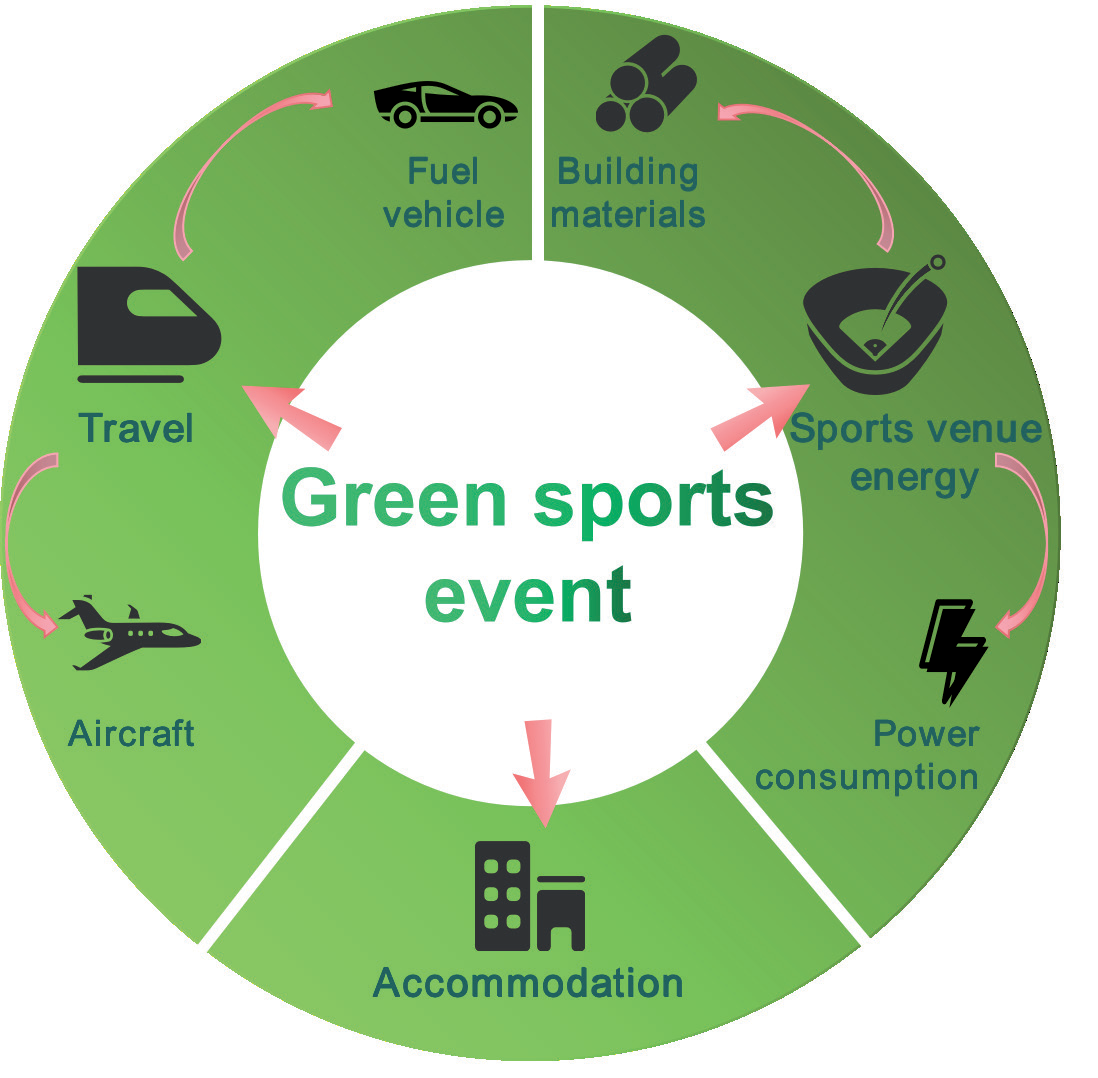
Milita Vienažindienė et al. [38] selected the basketball leagues in Turkey and Lithuania for the 2021- 2022 season and calculated the carbon footprint by using the fixtures and then extrapolating the journeys of each team. It was found that the total carbon footprint of the basketball leagues of Turkey and Lithuania was 53,029 tons. The main source of the carbon footprint is the issue of air travel, and the Lithuanian Basketball League’s total carbon footprint is lower than that of the Turkish Basketball League, mainly because Lithuania is a smaller country and the use of airplanes as a means of transport is relatively low.
Stavros Triantafyllidis and Harry Davakos. [43] selected an annual running event in South Carolina, USA, and surveyed 34,924 runners through a web-based survey and found that in order to participate in the running event, the participants individually generated 338 million kilograms of CO2 emissions. Traveling across distances by car, plane, and other behaviors became a significant factor.
In addition, it has been suggested that venue energy consumption is also an important source of carbon footprint. Ville Uusitalo et al. [36] studied greenhouse gases by examining the popular professional ice hockey game in Finland, which is one of the existing articles that specifically includes the study of sporting events on greenhouse gas emissions. It found that the venue is more energy intensive because of the presence of ice halls, the ice surface based on electricity, and the presence of refrigerant and waste. In this regard, it is argued that venue energy consumption can also be a major carbon dioxide source for sports events requiring special temperatures and venues.
Lidia Piccerillo et al. [39] identified accommodation as an important source of carbon emissions in addition to transport. His study of the 75th Italian National University Championships found that 27,360 kg CO2e were attributed to transport and 13,191 kg CO2e to accommodation. Particular attention was paid to the impact of accommodation on local carbon emissions.
Initiatives to Address Increased Carbon Emissions from Sporting Events
Increase the Use of Public Transport
David M. Herold et al. [34] suggest that because 40% of spectators who choose to travel by private car produce 70% of GHGs, it is recommended to increase the use of public transport and improve the level of transport services. Hongyan Wang et al. [35] take the carbon footprint of the cycle of sports events as the object of their study and, in particular, suggest that reducing the transport process of sports building materials can also reduce carbon emissions. Ville Uusitalo et al. [36] study concluded that teams should reduce the carbon emissions caused by the traveling of their players, especially by high energy-consuming means of transport such as airplanes. In addition, most other researchers also favor the view that replacing airplanes and private cars with public transport will reduce carbon emissions and thus ensure that the carbon footprint is within a certain limit. It is also mentioned that replacing fuel vehicles with new energy vehicles can also reduce carbon emissions, further reducing the problem of rising carbon emissions from sporting events.
Use of Low-Carbon Materials and Energy Sources
In the study by Hongyan Wang et al. [35], carbon emissions during the preparation phase, organization phase, and end phase of a sporting event were highlighted. It has been found that the construction process of new venues in the preparation stage is an important source of carbon emissions, so it is recommended that they adopt a low-carbon performance design, select low-carbon building materials, and strengthen low-carbon management during the construction process. Ville Uusitalo et al. [36] conducted a systematic study on ice hockey as a case study and ultimately found that this sport requires special venues and venue maintenance, and stadiums will increase carbon emissions significantly. In this regard, it is recommended that emissions be reduced by improving energy efficiency, optimizing energy usage, and improving energy production methods during operation. Perkumiene et al. [37] also cited the direction of dedicated renewable and clean energy sources as an important step toward reducing carbon emissions.
Improvement of Education on Environmental Concepts among the Stakeholders of Sports Events
Milita Vienažindienė et al. [38] argued that club managers and event organizers should implement environmentally friendly concepts, and based on the basketball leagues in Turkey and Lithuania, it was argued that the education of environmental concepts should be strengthened at the level of the club managers and then put into practice to reduce the carbon emissions during the sports events. et al. [39] studied the carbon emissions of university sports events by taking sports events held at the Italian National University as the object of the study. The study concluded that the conceptual level should be strengthened in order to reduce the emission of greenhouse gases such as carbon dioxide.
More Accurate Measurement of Carbon Emissions
The measurement of carbon emissions is closely related to the prevention and control of carbon emissions. Currently, carbon emissions are measured by carbon footprinting or monitoring some of the locations around sporting events. Both of these methods lead to predictions of carbon emissions, and in doing so, the carbon emissions of different types of cars and airplanes need to be taken into account, as well as the energy consumption of the venue. In this regard, Eiji Ito and James Higham [41] measured the carbon emissions of the Japan 2019 Rugby World Cup, with the intention of distinguishing between domestic and international spectators with different itineraries, and successfully implemented a three-hub model, which was verified to accurately measure the impacts of the sporting event. This carbon emission measurement will also provide more accurate raw data for subsequent carbon emission management.
Conclusions
According to the Discussion section, sports events drive intercity and intercountry mobility [44]. The means of transport used become a major source of carbon emissions [45], especially the large-scale concentrated use of fuel private cars [46] and airplanes [47], which will lead to a surge in the total amount of carbon emissions. Some researchers believe that sports venues and buildings [48] are another key factor leading to increased carbon emissions, especially during the building construction phase. For sports events that require special venues, such as ice hockey and skiing [49], sports facilities are also one of the important origins of carbon emissions. Among them, most of the carbon footprints of sports facilities in hockey rinks come from energy consumption, such as electricity, and 86% of the carbon footprints of skiing facilities are due to electricity consumption. In addition, the emissions of sports events are also closely related to the event cycle, event scale, and event impact. In addition, our research also has some shortcomings. The comprehensiveness of the included literature needs to be strengthened, and the inclusion of literature other than English is insufficient, especially the inclusion of some high-level literature.
Despite the abundance of research on sports events and carbon emissions, some results and progress have been achieved. However, based on the above review and assessment of the relevant literature, it is believed that the current research is still deficient in some aspects. Subsequent studies should be more systematic from the following perspectives.
1) The main reason sporting events lead to carbon emissions is because of the means of traveling, and it is seldom pointed out here that electric cars will help reduce carbon emissions [50]. Future research could consciously differentiate between the types of transport chosen by spectators to attend sporting events, particularly the proportion of electric and fuel vehicles used and their impact on carbon emissions [51]. However, in the use of electric vehicles, the focus should be on the production of batteries and other materials to make electric vehicles, which may increase emissions and pollution outside of electric vehicles [52-54] and the carbon emissions from the production process should be divided according to the average life cycle of electric vehicles. Ultimately, the carbon emissions from sporting events contain the sum of actual carbon emissions and carbon emissions from the production process.
2) The current study did not consider the influence of season on carbon emissions during sports events. Whether different sports events in different seasons result in more/less carbon emissions should be included in subsequent studies. Moreover, because of seasonal differences, the photosynthetic efficiency of plants [55] and the demand and use of fuel are somewhat different. This also leads to fewer ways to “carbon offset” and more ways to emit carbon. In this regard, it is worthwhile to study which seasons are more suitable for holding sports events.
3) Future research could specifically analyze the differences in resource consumption and spectator attendance between male and female sporting events and how these differences affect carbon emissions. In particular, women’s sports consume relatively fewer resources and have lower attendance rates. In this regard, studying the impact of female and male sports events on carbon emissions is necessary.
4) Future research should focus on developing more accurate carbon emission measurement methods and exploring more effective emission reduction strategies by taking into account the characteristics of sports events in different seasons. Only by innovating more accurate ways of measuring carbon emissions can we further propose more accurate strategies for reducing carbon emissions.
5) Sports event organizers or host cities should implement carbon offsetting [54] strategies during the preparation and implementation of sports events rather than only imposing constraints or calling for policies.

