

Introduction
Background and Significance
Global climate change has become an environmental challenge that the whole world needs to face together [1-3]. In 2007, China surpassed the United States in carbon emissions, ranking first in the world, and has continued to this day [4]. As a major energy producer and consumer, China made it clear to the Secretariat of the United Nations Framework Convention on Climate Change in 2015 that carbon emissions should peak around 2030, and the government strives to achieve this as soon as possible. At the United Nations General Assembly in 2020, China proposed to achieve a carbon peak around 2030 and strive to achieve carbon neutrality by 2060 [5-7]. In recent years, with the intensification of global climate change, there have been more and more studies on climate change and carbon emissions [8-10].
As we all know, the main source of carbon emissions comes from the production and consumption of fossil energy [11-13], and the use of fossil energy also brings environmental pollution and ecological damage [14, 15]. In order to achieve green and low-carbon development, on June 13, 2014, President Xi delivered an important speech at the sixth meeting of the 18th Central Leading Group for Financial and Economic Affairs, clearly proposing that China should promote energy consumption revolution, energy supply revolution, energy technology revolution, and energy system revolution, and strengthen international cooperation in an all-round way to achieve energy security under open conditions [16].
Shanxi Province is located in the central and northern part of China, rich in coal resources [17-19]. It is China’s energy and heavy chemical industry base and has made outstanding contributions to China’s energy security [20-22]. In 2017, The State Council issued a document proposing that Shanxi Province should carry out energy reform, strive to be the vanguard of the energy revolution, and provide reform experience for the energy transformation in other regions. Shanxi Province has carried out a series of reforms in energy supply, consumption, science and technology, and system around the goal of “being the vanguard of the energy revolution” proposed by General Secretary Xi Jinping. In 2019, the Eighth meeting of the Commission for Deepening Overall Reform of the CPC Central Committee deliberated and adopted the Opinions on The Pilot Comprehensive Reform of the Energy Revolution in Shanxi, supporting Shanxi in striving to become the vanguard of the national energy revolution.
Since the pilot, Shanxi has deepened the energy revolution with the goal of achieving a carbon peak and carbon neutrality. Now, the comprehensive reform of the energy revolution pilot has been in place for a time, but whether these pilot policies of the energy revolution have significantly reduced Shanxi’s carbon emissions and how the policy effect is still to be further studied. The purpose of this study is to use a quantitative method to estimate the impact of pilot energy revolution policies on the carbon emissions reduction effect in Shanxi Province.
Review
Review of the Energy Revolution
The energy revolution refers to the process in which an energy system characterized by efficient, clean, low-carbon, and intelligent replaces the traditional energy system in light of the intensifying contradictions between population, resources, and environment [23]. Replacing the traditional and extensive energy utilization mode with a new scientific energy use mode will eventually push human society to the era of efficiency, cleanliness, low carbon production, and intelligence [24].
At present, the relevant research on the pilot energy revolution in Shanxi is still in its infancy, and the literature mainly focuses on the energy revolution itself. Wang carried out the reform Path and Policy Suggestions for the Comprehensive Reform Pilot of Shanxi Energy Revolution [25]. XIE carried out strategic thinking and suggestions on promoting a regional energy revolution based on local conditions [26]. Wang et al. carried out the strategic planning of the Taiyuan urban energy facilities system with the goal of energy revolution vanguard [27]. Wang et al. carried out research on the internal logic, realistic dilemma, and breakthrough path of Shanxi to be a Pacesetter in the National Energy Revolution [28]. WANG carried out research on the effective connection between the Shanxi energy revolution and emission peak and carbon neutrality [29].
Review of Carbon Emission Reduction
At present, research on China’s carbon emission reduction focuses on two main aspects. The first is carbon emission accounting and influencing factors. Recently, this research has been quite rich. For example, ZHAO et al. carried out research on carbon emission inventory based on energy activities and the driving factors in Shanxi [30]. Ren et al. carried out research on the effective connection between the Shanxi energy revolution and emission peak and carbon neutrality [31]. Cheng et al. carried out the decomposition of influencing factors and peak prediction of carbon emissions in China [32]. According to existing studies, the process of carbon emission reduction is rooted in the system, technological change, and economic structure adjustment of the social and economic system. Therefore, economic activities, population size, energy structure adjustment, technological innovation, carbon emission trading, and urbanization are all important factors affecting carbon emissions.
The second is the assessment of the effect of carbon emission reduction policies. At present, the research in this area mainly focuses on the impact of carbon trading policies, low-carbon city pilot policies, smart city construction, and ecological civilization pilot demonstration zone construction on carbon emission reduction. Xie tested the carbon emission reduction effect and influence mechanism of carbon market development by using the continuous double difference method [33]. Yang used the synthetic control method (SCM) to explore the mitigating impacts of China’s carbon trading pilots and found that the carbon trading pilots have achieved significant effects on decreasing carbon emissions, especially in Hubei, Guangdong, and Chongqing [34]. Lu investigated the implementation of the low carbon policy issued in 2010 by the Chinese government and its impact on carbon emissions using the SCM [35]. Huang et al. analyzed the impact of low-carbon city construction on urban carbon emissions in multiple dimensions by using the propensity score matching and difference-in-differences (PSM-DID) method based on the panel data of 216 cities in China from 2006 to 2019 [36]. Tian et al. used the panel data of 282 prefecture-level cities in China from 2006 to 2019, the progressive difference-in-differences model (DID), and the intermediary effect model to empirically examine the impact of smart city pilot policies on carbon emissions (total amount and intensity) and their intrinsic effects Mechanism [37]. Chen evaluated the carbon emission reduction effect of the ecological civilization pilot demonstration zone by using the SCM and the intermediary effect model [38].
In terms of evaluation methods, the current mainstream methods to evaluate policy effects include regression discontinuity design (RD), Propensity Score Matching (PSM), dual-difference method (DID), and synthetic control method (SCM). The above evaluation methods are suitable for different types of policies, and each has its own advantages and disadvantages. Among them, RD is a quasi-natural experiment, whose basic idea is that there is a continuous variable that can determine the probability of an individual receiving policy intervention on both sides of a certain critical point. Since X is continuous on both sides of the critical point, the value of X for an individual falling to either side of the critical point will happen randomly; that is, there is no artificial manipulation to make the probability of an individual falling to a certain side greater. A quasi-natural experiment is formed near the critical value, but because the applicable environment of breakpoint regression is a highly idealized environment, its application scope is very limited. PSM is a popular tool in the field of economics to deal with self-selection bias, and it is often used in combination with the double difference method (DID) we introduced earlier (PSM-DID). The DID method has been widely used in the evaluation of pilot policy effects [39, 40]. The basic principle is that assuming unobserved factors remain unchanged, the differences before and after policy changes between the experimental group and the control group are respectively compared, and then the differences are compared twice (i.e., differential and differential), and the final difference obtained is the policy effect. The DID method can accurately evaluate the size of the policy effect. However, the premise of the application of the DID method is that the outcome variables of the experimental group and the control group have a common change trend. Liang et al. applied DID and found that the construction of an ecological civilization pilot demonstration area had a significant promoting effect on the improvement of urban ecological efficiency [41]. Using DID, Wang et al. found that the construction of ecological civilization demonstration zones can effectively reduce air pollution. These studies have examined policy effects from different perspectives [42]. However, because the DID method is subjective to the selection of the control group, and the weight assigned to the individuals in the control group is equal, it is difficult to objectively select the control group with the same changing trend as the experimental group. The SCM method can process the data of the control group and assign different weights to construct an appropriate counterfactual control group and then compare the difference between the experimental group and the control group to evaluate the effect of the policy. In terms of control group selection, unlike the DID method, which focuses on subjective selection, the SCM method’s control group is based on the result of data selection, and the virtual control group that is most similar to the control group is constructed by data-driven selection, which ensures the reliability of the evaluation results.
In conclusion, there are many studies on the effect of carbon emission reduction with different methods at present, but relatively few studies specifically on the effect of carbon emission reduction in the energy revolution. However, whether pilot policies really promote carbon emission reduction is of great significance for further optimization and adjustment of pilot policies. Therefore, this study takes Shanxi Province as the research object. Since only Shanxi has been impacted by a series of pilot policies of the energy revolution, the policies introduced can be used as a natural experiment for Shanxi. We can use Shanxi as the treatment group and other provinces and cities in China as the reference group. The influence of the energy revolution policy on carbon emission in Shanxi Province was estimated by using SCM.
Material and Methods
Methods
Synthetic Control Methods
Based on the advantages of the SCM method in control group screening, this paper uses this method to evaluate the effect of the Shanxi energy revolution pilot policy on carbon emission reduction. When estimating the policy effect, SCM finds a synthetic area weighted by the control group area, replaces the results of the synthetic area without policy, and compares it with the actual data to get the size of the policy effect [43]. The goal of SCM is to find a suitable control group city and weight them with different weights to obtain the synthetic area, so that the value of the relevant variables before the implementation of the synthetic area is very close to the real value. Due to this, the value of the result variable of the synthetic region after the implementation of the policy can be used as counterfactual data, and then the policy effect can be measured.
Referring to Abadie’s method, it is assumed that only one region is affected by the policy intervention in time and that there are j regions not affected by the policy intervention [43]. In this study, the policy intervention refers to the comprehensive pilot project of the energy revolution in Shanxi Province. PYit is the target variable after the regional policy intervention, and in this study, it is the pilot effect on carbon emission reduction after 2017. PNit is the value of the target variable that the region is not affected by the policy. In this study, it is the effect of carbon emission reduction that Shanxi Province has not selected as the pilot, or the “counterfactual” result. According to the assumption, the policy effects of the pilot areas are:
PNit is the counterfactual data that cannot be observed. A synthetic area is constructed by using SCM, and then the target variables of the synthetic area are used to represent the counterfactual results. In this study, PNit refers to the effects of the synthetic economic, social, and ecological environment of Shanxi Province weighted by the control group areas:
Where:
Placebo Tests
“Placebo” was first used in medical experiments, usually used to test the effects of a new drug. The volunteers were divided into two groups on a placebo (harmless sugar pills) and one of the new drugs, but they did not know which pills they were taking. In this way, volunteers can avoid influencing the effect of the experiment due to psychological effects. This is called the placebo test.
According to Abadie’s practice, the robustness of the SCM results is tested by the ranking test [40]. The provinces of the synthetic group were put into the experimental group, assuming that the provinces of the synthetic group received the same policy intervention as the experimental group, and the SCM was used to further fit the changing trend of the outcome variables, so as to judge the effect of the policy. If the gap between the policy effect of a random province in the synthetic group and the experimental group is large enough, then we have reason to believe that the policy effect of the energy revolution is significant and reliable.
The advantage of the ranking test is the intuitive view of the curve distribution of the outcome variables. The ranking test is to conduct the SCM analysis of all the provinces in the synthesis group one by one, so that all the provinces enter the experimental group, assuming that they are affected by the policy, and obtain the curve distribution of the outcome variables. This method requires that the synthetic control objects in each province have a better fitting effect before the implementation of the policy. In actual operation, due to the difference between regional development and other policy influences, poor fitting may occur during the synthesis control; that is, the RMSPE value is relatively large. Even if there is a large prediction difference in the later period of the policy, the implementation effect of the policy cannot be reflected. In this paper, referring to the literature research methods of Liu Youjin and Zeng Xiaoming, the provinces and cities with RMSPE value 1.5 times higher than those of Shanxi value were removed, and the ranking of tests in this region was no longer analyzed [44].
Data and Sample
According to the principle of SCM, the two indexes include explanatory variables and control variables. The explanatory variables are the effect index. Control variables are the main influence factors of explanatory variables and are mainly used to synthesize control variables.
In this paper, panel data of 30 provinces, cities, and autonomous regions in China from 2012 to 2021 are used (due to a lack of sample data, sample data of Tibet Autonomous Region, Hong Kong, Macao Special Administrative Region, and Taiwan region have not been covered for the time being). The data are obtained from the China Energy Statistical Yearbook, the provincial statistical yearbook, and the Statistical Bulletin. According to the SCM model, the counterfactual experiment to define the pilot policy began in 2017, and the samples were divided into the pre-event window (2012-2016) and the post-event window (2017-2021).
Explanatory Variables
Explanatory variables in this paper include carbon emissions and carbon intensity. In view of the fact that China and Shanxi Province have not released actual carbon emission data, this paper adopts the calculation methods recommended by the Guidelines for the Preparation of Provincial Greenhouse Gas Inventories and the 2006 IPCC Guidelines for National Greenhouse Gas Inventories to estimate the carbon emissions of 30 provinces and cities from 2012 to 2021. The formula is as follows:
Where: Q is carbon emission, EF is emission factor (tCO2/TJ), Activity is the fuel consumption (TJ), i is the fuel type, and j is the sector activity.
The method is based on activity level data such as fuel consumption and low calorific value of sub-sectors and sub-fuel varieties, carbon content per unit calorific value of various fuel varieties, carbon oxidation rate of fuel combustion equipment and other emission factors data, which are accumulated layer by layer to comprehensively calculate the total emissions.
Control Variables
In order to obtain a better fitting effect and ensure the robustness of results, according to relevant literature such as Liu et al., important factors of explained variables were selected as predictive control variables as frequently as possible [45]. According to the existing research results of Zhang et al. and Geng et al., five indexes, including investment level, consumption level, scientific and technological innovation, industrial structure, and urbanization level, are adopted as the main influencing factors [46, 47].
Level of investment. Foreign direct investment is used. On the one hand, foreign investment can promote economic development. On the other hand, it is conducive to the introduction of foreign advanced technology to the domestic transfer, and its spillover effect can be that the technical level of domestic enterprises has been improved to a certain extent, so it can improve the energy utilization efficiency of enterprises and reduce carbon emissions.
Consumption level. Total retail sales of consumer goods are used. The level of regional consumption is closely related to the degree of economic development, while the level of regional consumption is related to its industrial structure, which further affects the efficiency of energy utilization and the reduction of carbon emissions.
Scientific and technological innovation. Three kinds of patent grants are used. Scientific and technological innovation is the driving force and source of regional economic development, and the higher the level of scientific and technological innovation, the more conducive to improving the level of energy efficiency and reducing carbon emissions.
Industrial structure. Expressed in terms of (gross secondary product + gross tertiary product)/gross domestic product. The industrial structure represents the mode of economic development, and the higher the proportion of gross domestic product (GDP) + gross domestic product (GDP), the better the regional economic development, which further affects the energy utilization efficiency and the reduction of carbon emissions.
Level of urbanization. The proportion of urban population is adopted. The higher the level of regional urbanization, the more developed the economy, which further affects the energy utilization efficiency and the reduction of carbon emissions.
Results and Discussion
Results
Estimates of Carbon Emissions
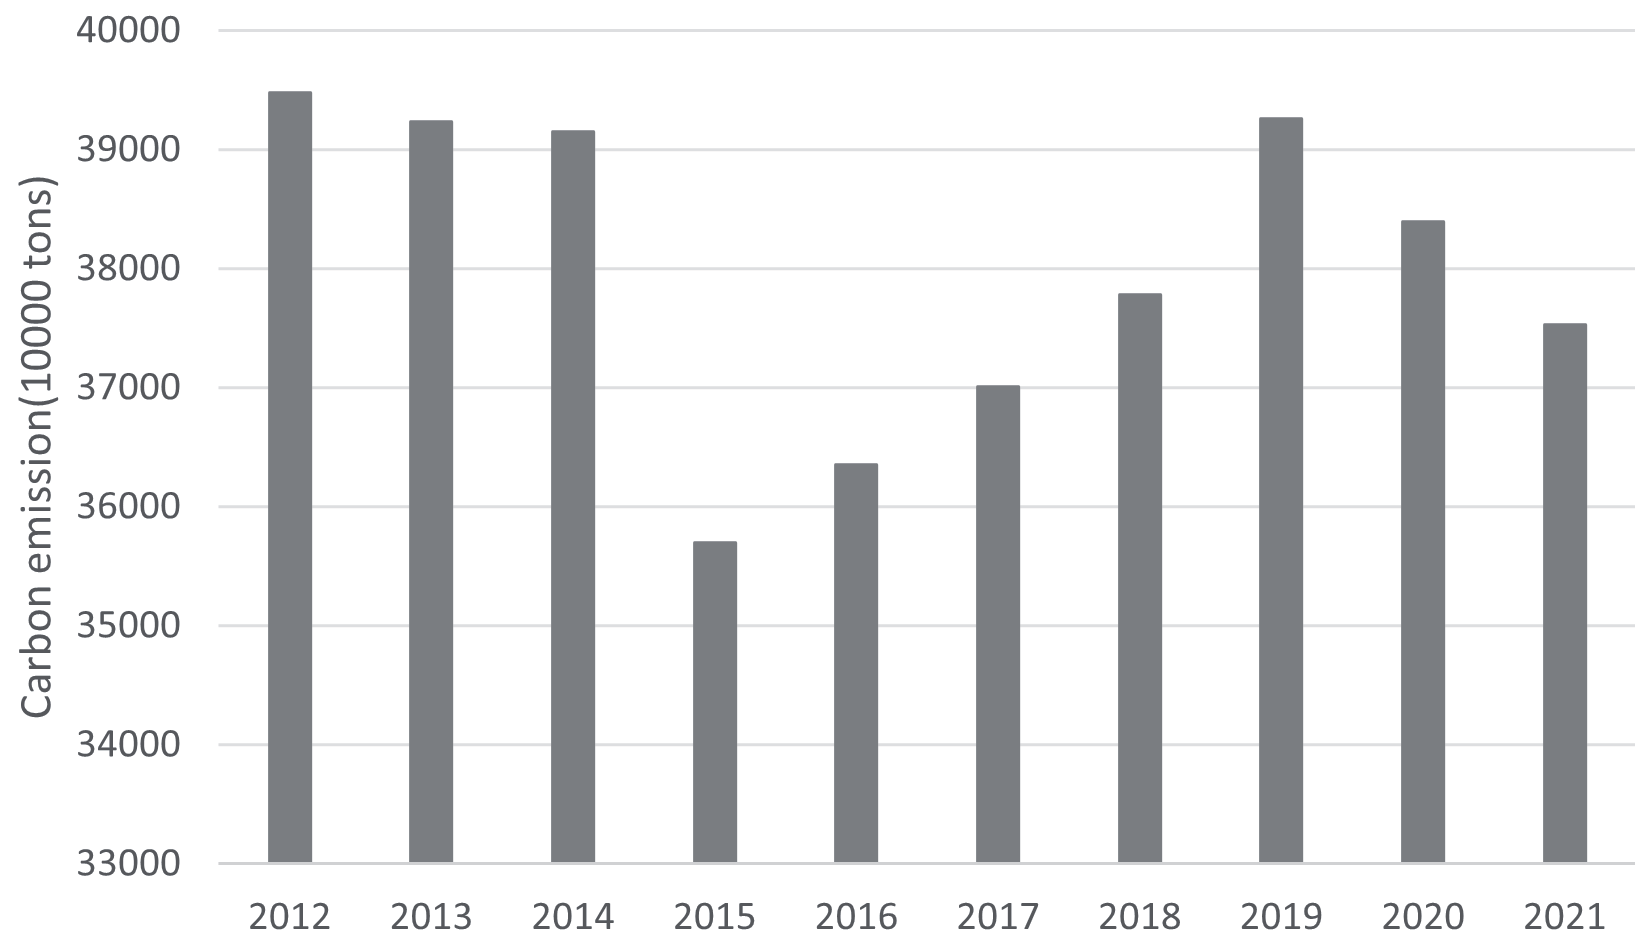
The changing trend of carbon emissions in Shanxi Province is shown in Fig. 1. The first stage was from 2012 to 2014, during which the carbon emissions in Shanxi Province were generally higher and showed a slow decline. The carbon emissions in 2012 and 2014 were 3.95×10⁸t and 3.91×10⁸t, respectively. The second stage is from 2015 to 2019. Carbon emissions decreased rapidly in 2015, from 3.91×10⁸t in 2014 to 3.57×10⁸t in 2015, with a year-on-year decrease of 8.81%. Then, they increased rapidly again and reached the highest level in 2019, with emissions of 3.93×10⁸t. An increase of 9.99% over 2015. The third stage is from 2020 to 2021, during which carbon emissions slowly decline again, falling to 3.75×10⁸t in 2021, a decrease of 4.41% compared with 2019.
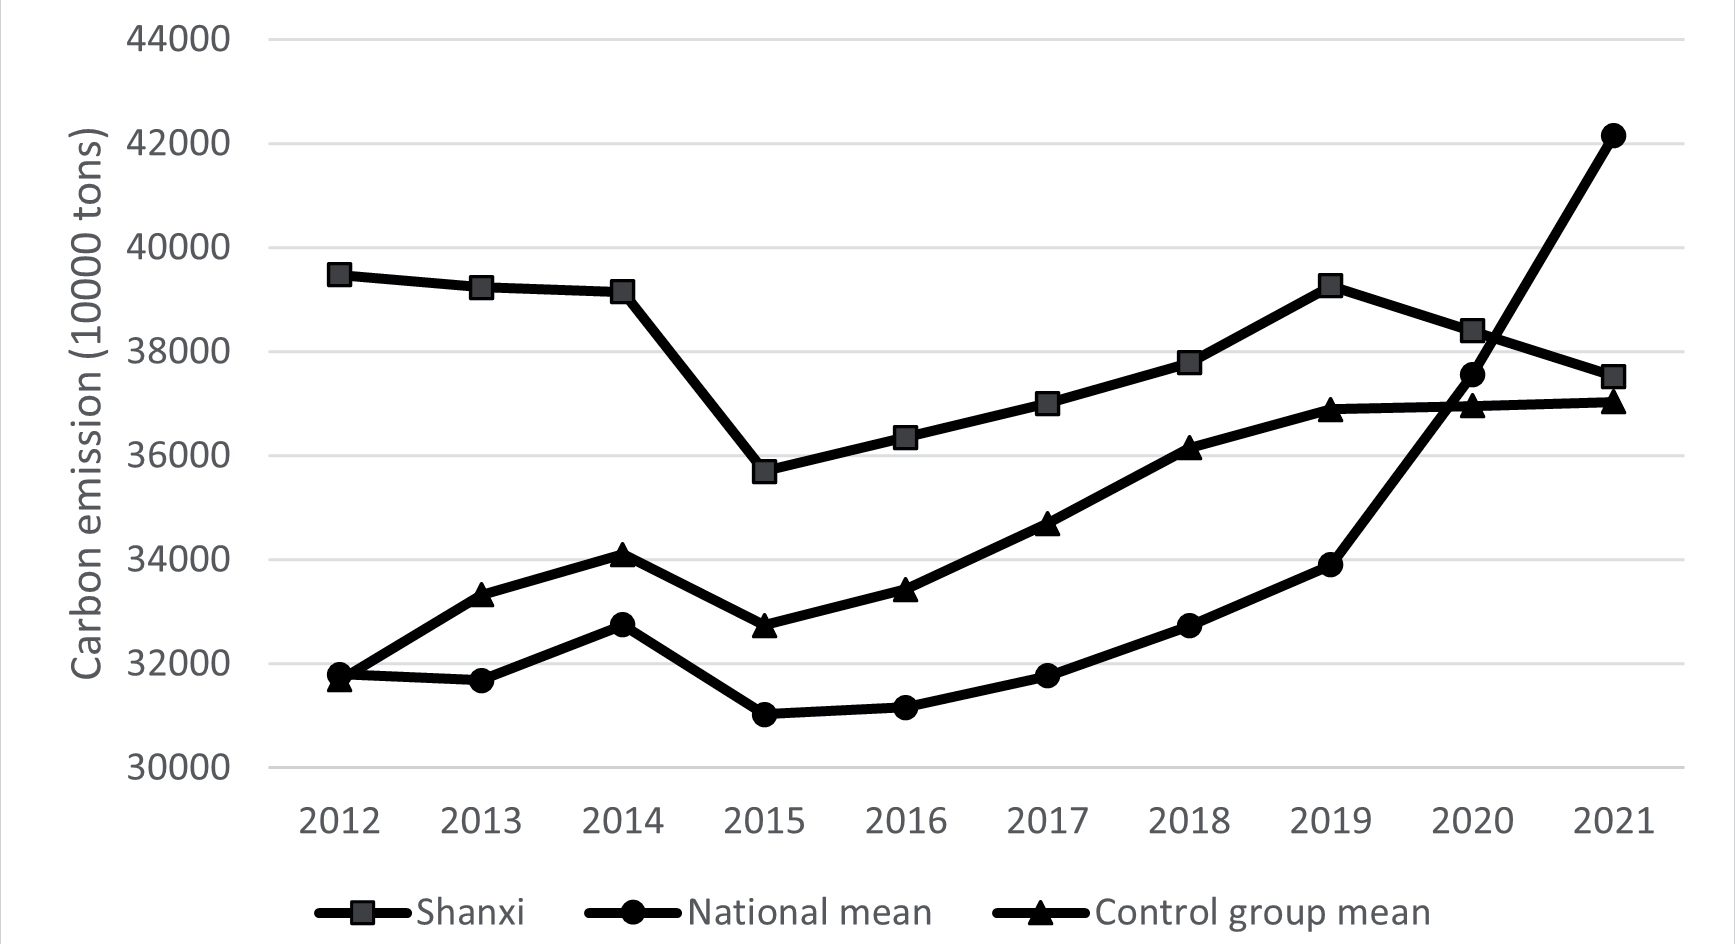
The trend of carbon emissions in Shanxi Province, as well as the national average and the average carbon emissions in the control group, are shown in Fig. 2. In terms of carbon emissions, from 2012 to 2020, Shanxi’s carbon emissions were significantly higher than the national average and the control group. In 2012, Shanxi’s carbon emissions had the largest gap between the national average and the control group, and the gap between the national average and the control group was 0.77×10⁸t and 0.78×10⁸t, respectively. Subsequently, the carbon emission gap between Shanxi and the national average level and the carbon emission gap between the control group and the control group showed a fluctuating trend, reaching the minimum in 2020, and the gap between Shanxi and the national average level and the control group was 0.08×10⁸t and 0.14×10⁸t respectively. In 2021, with the rapid decline of Shanxi’s carbon emission, the carbon emission was lower than the national level for the first time and slightly higher than that of the control group. Preliminary results suggest that the energy revolution pilot policy has inhibited the increase of carbon emissions in Shanxi Province, but the specific emission reduction effect needs to be further tested.
Policy Effect Analysis
Mechanism Mode and Validity Check
In order to make the four explanatory variables get fit values close to the actual value of Shanxi, the SCM was used to empower each control area, and then Shanxi was fitted by weighted, which is called fitting Shanxi. The specific weights are shown in Table 1.
To evaluate the effectiveness of the fitting results, the results showed that the control range of the error of the real energy revolution policy in Shanxi Province was less than 5%, and the fitting results before the policy implementation were relatively effective. See Table 2 for specific details.
Effect Analysis of Carbon Emission
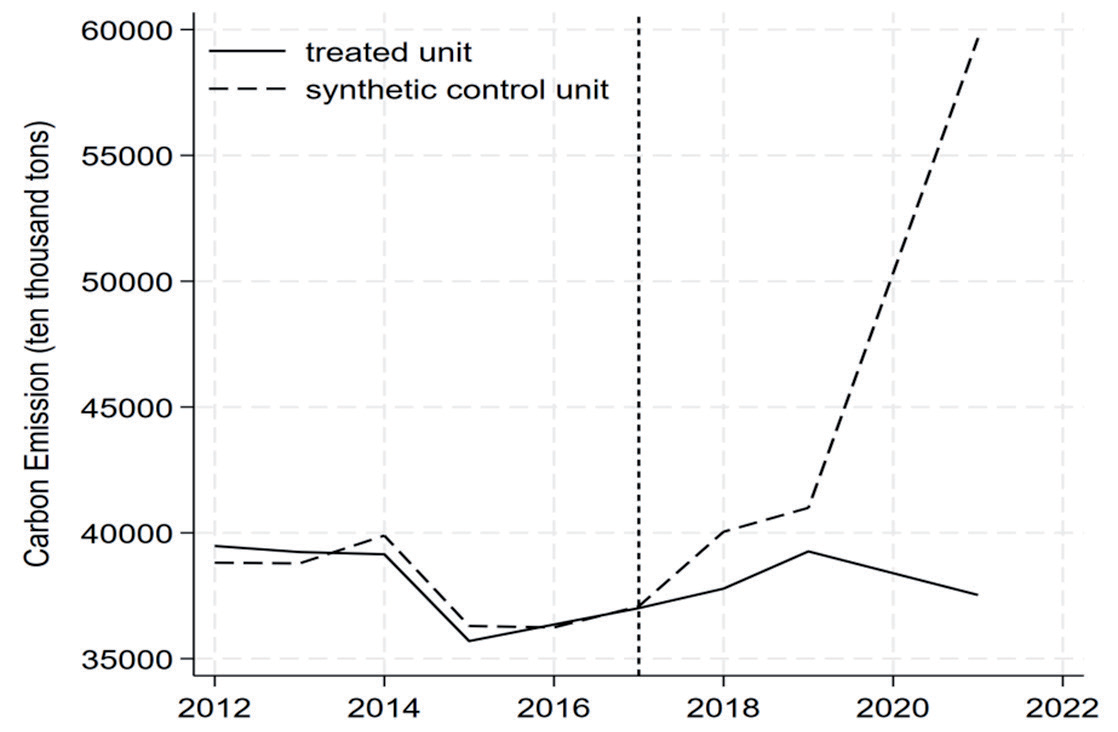
The carbon emissions and the effects of policies in Shanxi and synthetic Shanxi during 2012-2021 are shown in Figs. 3 and 4 and Table 3. As can be seen from Fig. 3, the position of the vertical dotted line in the figure indicates the year of the implementation of the energy revolution. On the left side of the dotted line, the carbon emissions of Shanxi and the synthetic Shanxi are very close, and the difference is small, indicating that the synthetic Shanxi well fits the carbon emissions of Shanxi. On the right side of the dotted line, the carbon emission of synthetic Shanxi is higher than that of Shanxi, and the difference between the two is the policy effect of the energy revolution on carbon emission. In 2021, the carbon emission intensity of Shanxi and synthetic Shanxi will be reduced by 37.09%, which means that compared with the assumed Shanxi without an energy revolution, carrying out the energy revolution can significantly reduce the carbon emission of Shanxi. The effect also gradually increased over time. This “negative effect” indicates that the energy revolution policy significantly contributed to the reduction of carbon emissions.
Table 2.
Comparison between Shanxi and Synthetic Shanxi.
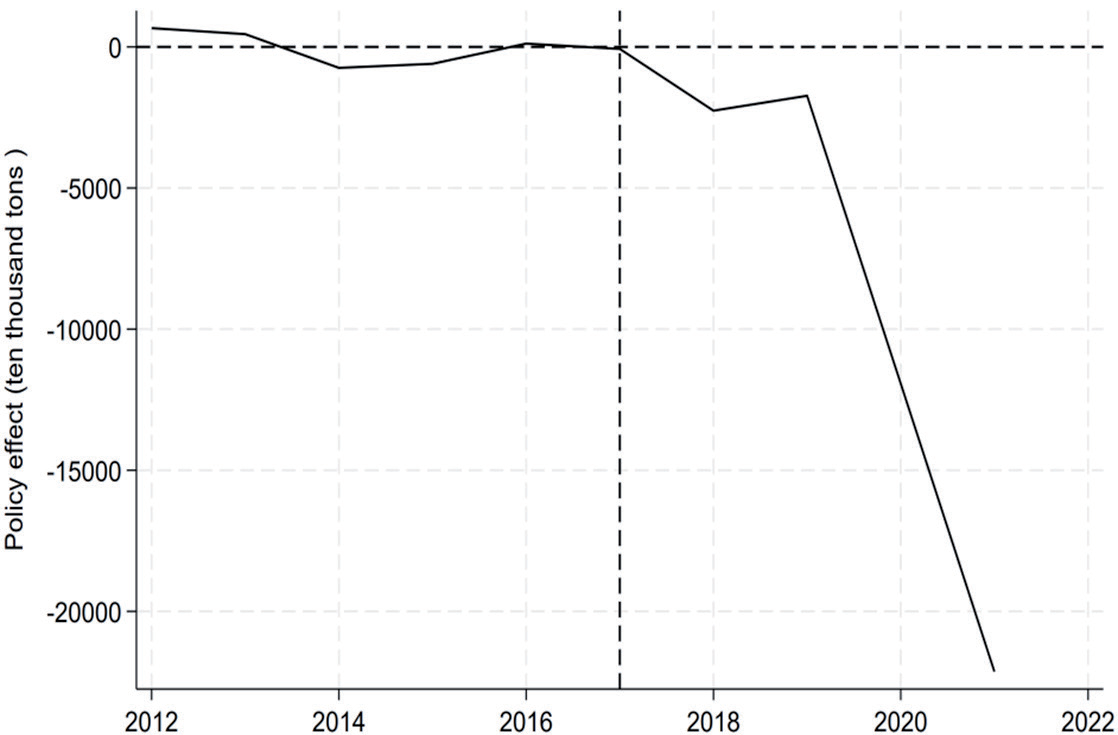
It can be seen from Fig. 4 that the energy revolution policy effect on the left side of the vertical line in the figure fluctuates around 0, indicating that the synthetic Shanxi has a good fitting effect. The right side of the vertical line in the figure shows that the reduction effect increased from -720,000 tons in 2017 to -221.34 million tons in 2021, indicating that the energy revolution has a significant effect on carbon emission reduction. According to the mechanism analysis, carbon emissions are mainly affected by energy consumption intensity and energy consumption structure. Since the energy revolution in Shanxi Province in 2017, the energy intensity of Shanxi Province has been significantly reduced, and the energy intensity has dropped from 1.43 tec/ 10,000 yuan in 2017 to 1.25 tce/10,000 yuan in 2021, a decrease of 12.6%. In addition, in terms of energy structure adjustment, Shanxi Province has carried out a lot of work in recent years, especially in the production and utilization of new energy, which was the country’s leading position, according to statistics, by the end of 2021. Shanxi’s new energy and renewable energy power generation capacity of 38.89 million kilowatts accounted for 34.3% of the province’s total installed capacity. According to the overall data on energy consumption in the province, the proportion of non-fossil energy has increased from 4.9% in 2017 to 7.5% in 2020, an increase of 53%. This suggests that an energy revolution can significantly reduce carbon emissions.
Effect Analysis of Carbon Intensity
The carbon emission intensity and the policy effect in Shanxi and synthetic Shanxi during 2012-2016 are shown in Figs. 5 and 6 and Table 4. As can be seen from Fig. 5, the position of the vertical dotted line in the figure indicates the year of the implementation of the energy revolution. On the left side of the dotted line, the carbon emission intensity of Shanxi and the synthetic Shanxi are very close, and the difference is small, indicating that the synthetic Shanxi fits the change in carbon emission intensity of Shanxi well. On the right side of the dotted line, the carbon emission intensity of the combined Shanxi Province is higher than that of Shanxi Province, and the difference between the two is the policy effect of the influence of the energy revolution on the carbon emission intensity of Shanxi Province. In 2021, the carbon emission intensity of Shanxi Province and the combined Shanxi Province will decrease by 31.21%, which means that compared with Shanxi Province assuming no energy revolution, the carbon emission intensity of Shanxi Province will decrease by 31.21%. Carrying out the energy revolution can significantly reduce the carbon emission intensity in Shanxi Province, and the effect will gradually increase with time. This “reduction effect” indicates that the energy revolution policy significantly contributed to the reduction of carbon intensity.
It can be seen from Fig. 6 that the energy revolution policy effect on the left side of the vertical line in the figure fluctuates around 0, indicating that the synthetic Shanxi has a good fitting effect. The right side of the vertical line in the figure shows that the promoting effect increases from -0.33 tons / 10,000 yuan in 2017 to -0.75 tons / 10,000 yuan in 2021, indicating that the energy revolution has a significant promoting effect on carbon emission reduction. The above results possibly reflect that during the pilot period, Shanxi Province not only controlled fossil fuel consumption and reduced carbon emissions but also implemented green upgrading projects in key areas, and energy-saving transformation of key industries with high energy consumption and other policies have achieved remarkable results, resulting in a significant reduction in carbon emission intensity.
Robust Test
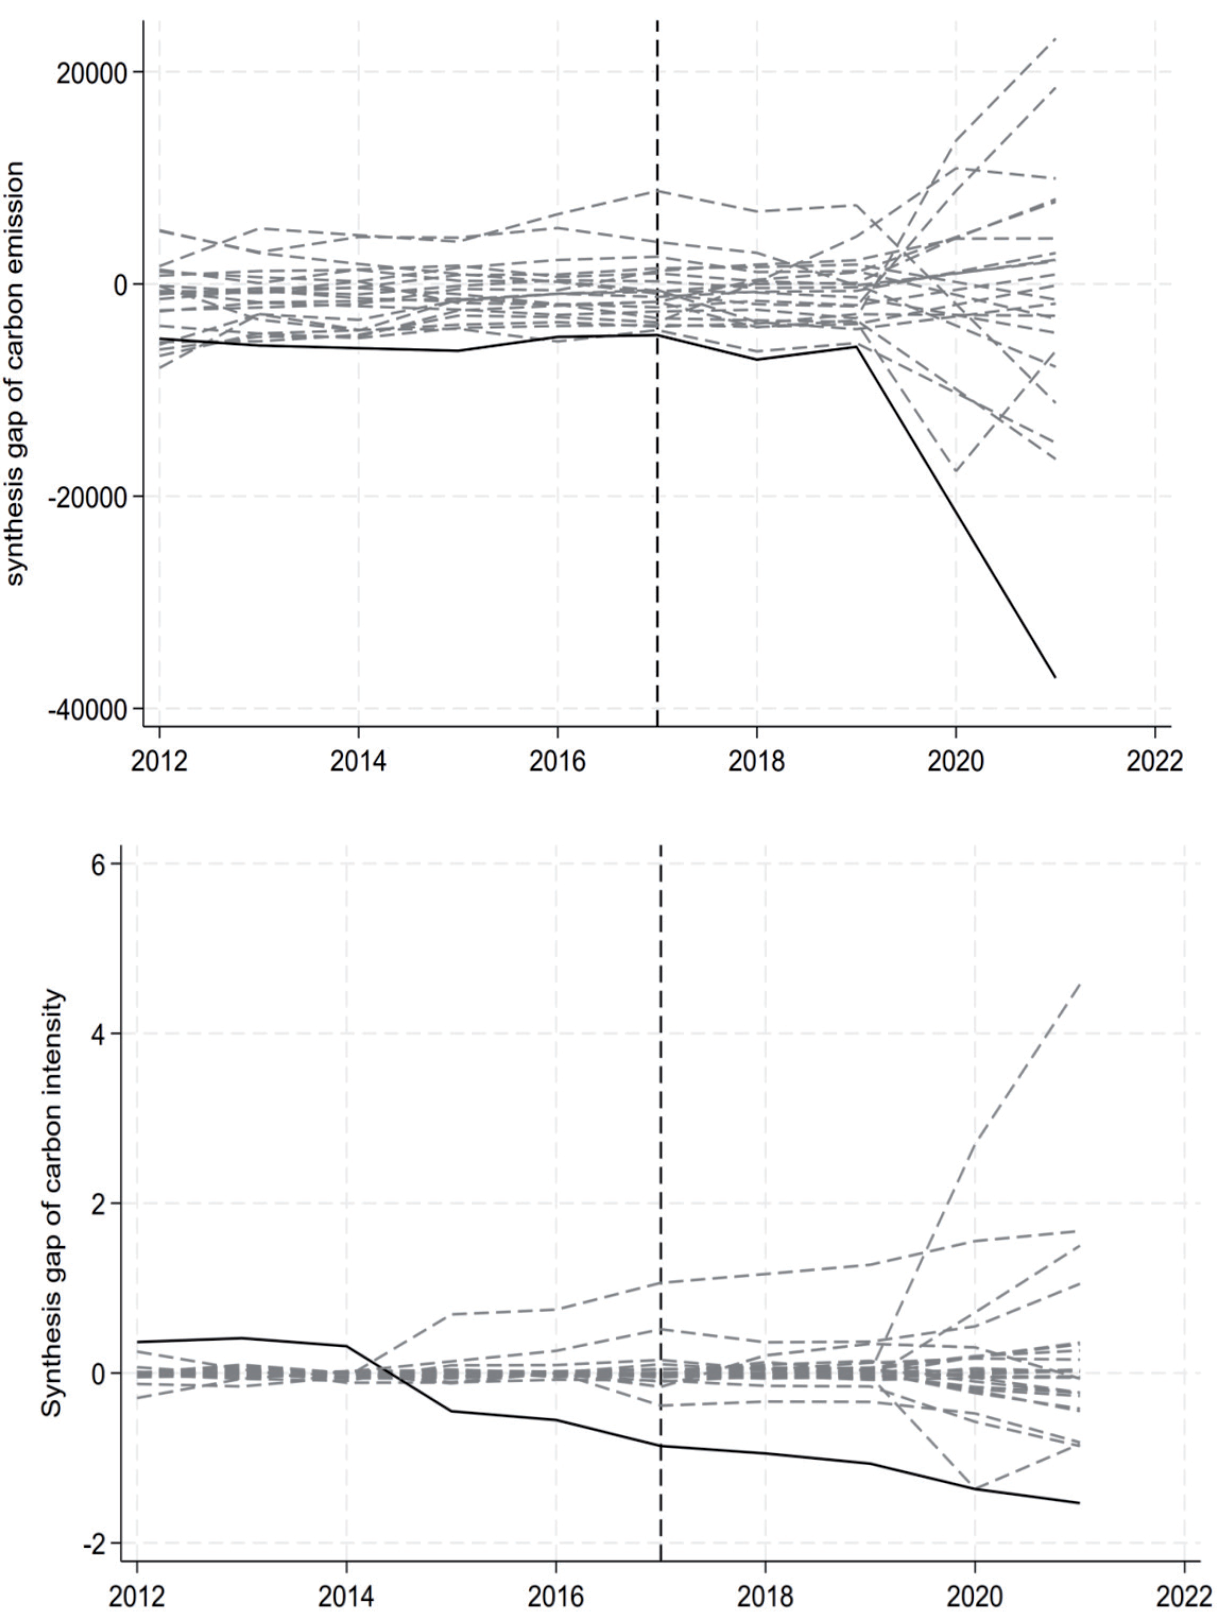
Placebo Tests were used to test the robustness of each indicator. In carbon emission, Tianjin, Jilin, and Shandong provinces with poor fitting effects were excluded. In carbon intensity, Tianjin, Neimenggu, Jinlin, Guangdong, Guangxi, and Gansu provinces with poor fitting effects were excluded. As can be seen from Fig. 7, the black solid line in the figure represents the policy effect of Shanxi Province, while the dotted line represents the policy effect of other provinces and cities. The effect of the Shanxi energy revolution policy on carbon emission and carbon intensity are at the lowest of the path distribution, indicating that the policy effect is significant at the critical level of 5% (1/27=0.037; 1/24=0.042), that is, the Shanxi energy revolution can be accepted at 95% probability to promote the reduction of carbon emission and carbon intensity.
Discussion
Through the comparative analysis of carbon emission data and policy effect analysis, the pilot policy of the energy revolution in Shanxi Province has a significant promoting and reducing effect on the total carbon emission and carbon emission per unit intensity in Shanxi Province. The pilot policy of the Shanxi energy revolution includes five parts: energy production revolution, consumption revolution, technological revolution, system revolution, and energy cooperation. The following will analyze and discuss the impact mechanism of energy revolution policies on carbon emissions by field.
The energy production revolution mainly aims to optimize the energy supply structure further. As a major coal-producing province in China, Shanxi has continuously improved the energy supply structure and promoted the transformation of energy supply by focusing on green coal production, unconventional natural gas development, and new energy development in the structural reform of energy supply. Green coal mining includes the implementation of mechanized, automated, informationized, and intelligent mining, as well as the promotion of mechanized coal mining, digital monitoring, control automation, and high efficiency of auxiliary transportation. At present, more than 50% of coal production capacity has realized intelligent mining and the advanced coal production capacity accounts for nearly 82% of the total. On the one hand, the implementation of these green mining technology policies has improved the production efficiency of coal mining enterprises. On the other hand, it has also reduced the energy consumption of the traditional coal production industry and has made a very positive contribution to reducing carbon emissions. Unconventional natural gas is a low-carbon energy. Since the pilot, the output of unconventional natural gas has increased year by year, with an output of 14.59 billion cubic meters in 2023, more than double that of 2019. Measures carried out in power production mainly include the implementation of power flexible transformation and an increase in the proportion of wind, solar, and other new energy sources. As of now, new energy and clean energy installation capacity has reached 48%, an increase of 14.1 percentage points over 2019. The implementation of these policies and measures improves the efficiency of power production while also reducing carbon emissions.
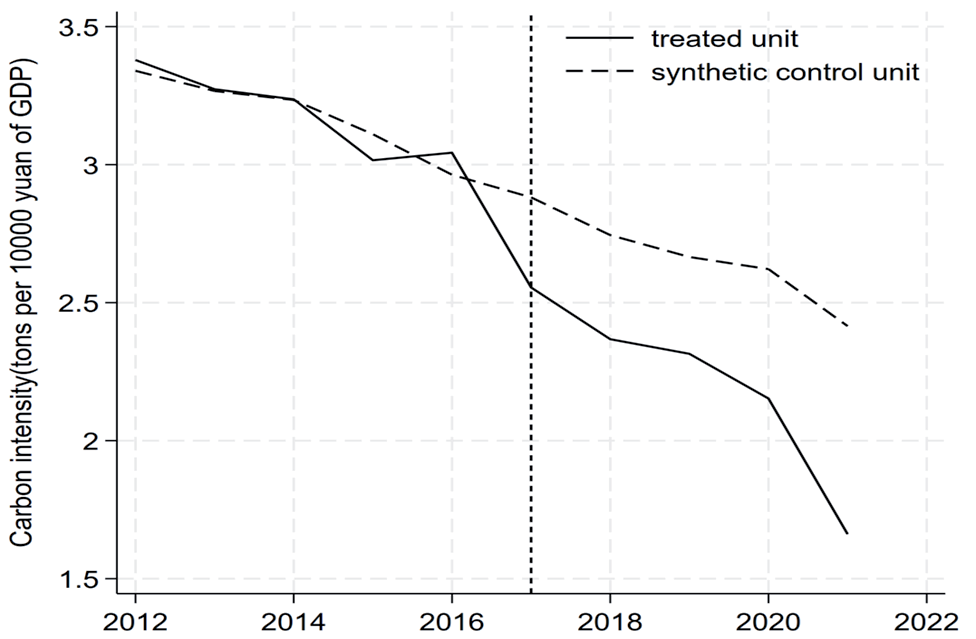
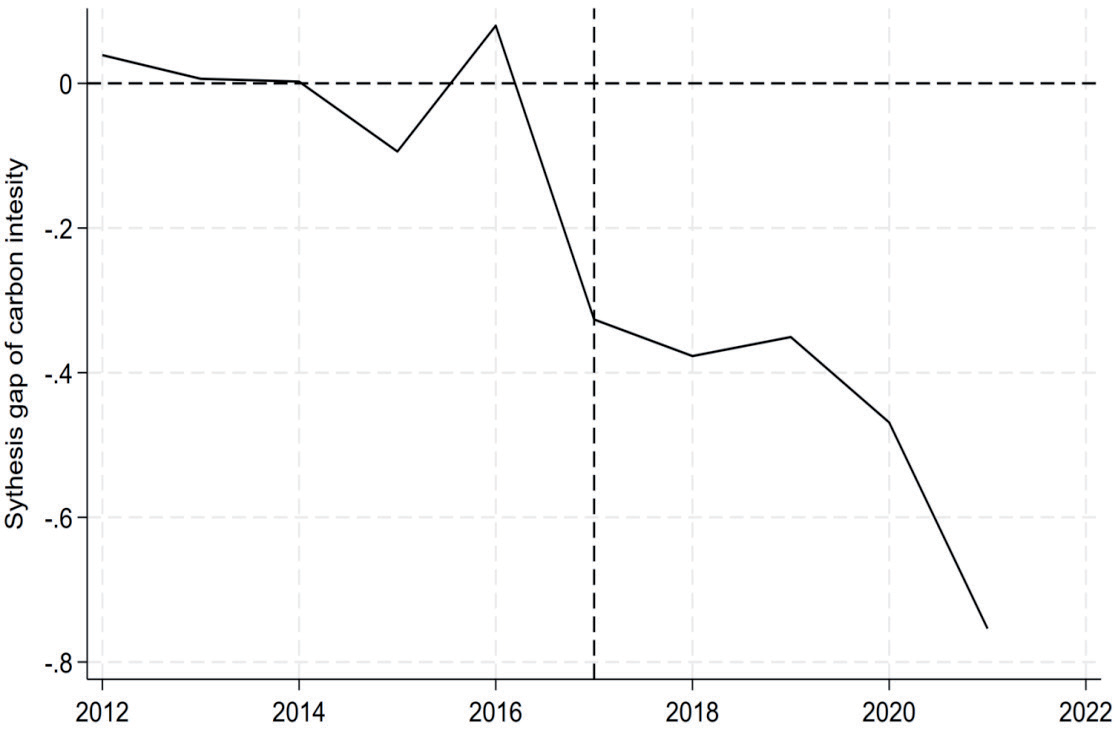
Table 4.
Effect analysis of carbon intensity between real and synthetic Shanxi.
The energy consumption revolution includes optimizing the efficiency of energy utilization and optimizing the energy consumption structure. In terms of improving energy efficiency since the pilot, on the one hand, Shanxi Province has eliminated substandard energy consumption enterprises in high-energy-consuming industries such as coal, iron and steel, building materials, coking, and non-ferrous metals, according to law; on the other hand, focusing on key energy-saving projects, “10,000 enterprises energy-saving and low-carbon action” has been carried out in six major energy-consuming industries, such as metallurgy, electric power, coal, coking, chemical industry, and building materials. The revolution continuously improves the level of energy efficiency and, at the same time, formulates energy efficiency benchmarking plans for high-energy-consuming industries, carries out energy efficiency standards benchmarking activities in key energy-using enterprises, and implements industrial energy efficiency improvement plans. With the support of the above policies, the energy efficiency of Shanxi Province has been greatly improved, and the energy intensity of the province has decreased by 10.9% in the three years from 2020 to 2022, which is among the highest in China. The reduction of energy consumption will also reduce carbon emissions. The optimization of energy consumption structure mainly reduces coal consumption and increases the consumption of new energy and renewable energy. In fossil energy, carbon emissions per unit of coal combustion are the highest, while new energy and renewable energy belong to low-carbon or zero-carbon energy, so the reduction of the proportion of coal consumption in the energy structure can effectively reduce carbon emissions.
The energy technology revolution focuses on the research and development of key common technology issues and needs of the clean, efficient, low-carbon, and green energy industry. At present, Huairou Laboratory Shanxi Research Institute and the “Jinchuang Valley” innovation platform have been built, while Huawei Coal Mining Corps’ global headquarters has landed in Taiyuan, and the first coal industry Internet platform has been launched. The world’s first ethanol electric hybrid vehicle, a new methanol tractor, and China’s first hydrogen fuel cell hybrid locomotive were launched. The establishment of these technology platforms will become the driving force for Shanxi’s future carbon emission reduction.
The energy system revolution focused on the reform of the power system, promoted the consumption and utilization of new energy power, increased the proportion of green electricity in the grid, optimized the power structure, and effectively reduced carbon emissions.
The main goal of energy cooperation is to strengthen international exchanges. At present, the Taiyuan Energy Low-carbon Development Forum has been established, and a number of green low-carbon development demonstration projects have been implemented in cooperation with international organizations, such as the Asian Development Bank and the European Investment Bank. These policies and measures will become the driving force for carbon emission reduction in Shanxi in the future.
Conclusions
In order to study the impact of pilot energy revolution policies on carbon emissions in Shanxi Province, this paper first calculated the carbon emissions of Shanxi Province, the control average, and the national average from 2012 to 2021, and then adopted the synthetic control method to evaluate the impact of pilot energy revolution policies on carbon emissions in Shanxi Province, drawing the following conclusions:
(1) The carbon emission accounting results show that the overall carbon emission of Shanxi shows a fluctuating trend, and the emissions in 2021 will be 3.75×10⁸t, down 4.41% from 2019. Compared with the average of the control group and the national average, the carbon emission of Shanxi from 2012 to 2020 will be higher than the average of the control group and the national average, but the gap between them is gradually decreasing. By 2021, Shanxi’s carbon emissions were lower than the national level for the first time and slightly higher than the control group, preliminarily indicating that the energy revolution pilot policy inhibited the increase of carbon emissions in Shanxi Province.
(2) The results of synthetic control evaluation show that: In this study, carbon emission and carbon emission intensity were selected as the main evaluation indexes, and the actual impact of the energy revolution on carbon emission in Shanxi Province was evaluated by using SCM. The carbon emission of Shanxi Province in 2021 was reduced by 37.09% compared with that of synthetic Shanxi Province, and the reduction effect increased from -720,000 tons in 2017 to -221.34 million tons in 2021. In Shanxi, carbon intensity decreased by 31.21%, and the reduction effect increased from -0.33 tons / 10,000 yuan in 2017 to -0.75 tons / 10,000 yuan in 2021. Through the placebo test, it is shown that the acceptance of Shanxi’s energy revolution is effective in reducing carbon emissions and carbon intensity in Shanxi Province with a 95% probability. This shows that the energy revolution pilot policy has a very significant effect on carbon emission reduction in Shanxi Province.

