

Introduction
32.5 GT of CO2 emissions was recorded in 2017 [1], around 30% of this record high emission came from the construction industry and transportation of building material-related activities emitted 11%. This urges the necessity for a sustainable replacement of OPC has resulted in formulation of GPC. GPC completely replaces cement and utilize sources which are rich in silica and alumina for binding property. To prepare GPC, alternative binding materials viz. Ground granulated Blast furnace slag (GGBS), Alkali Activated Solution (AAS), fly ash, Black rice husk ash (BRHA), nano silica, etc. obtained from agricultural and industrial wastes and alkaline solution were used. The manufacture of GPC emits significantly less CO2 than cement manufacturing and environmental friendly. Fly-ash based GPC is primarily based on alkali activated geopolymerization, which may occur in moderate conditions. In this process fly ash reacts with alkaline solution and forms aluminosilicate gel that binds the aggregates and other materials in concrete to form GPC. Since the reactions take place at low temperatures, the production is anticipated to be more energy and resource efficient, as well as cleaner.
GPC in comparison to conventional concrete provides positive influence to durability properties like acid attack, chemical attack, porosity and lesser strength loss than conventional concrete. Also GPC provide high yearly strength and better wear and tear resistance [2- 4]. A durability study of fly ash-based GPC in marine environment shows that GPC takes comparatively longer time to corrode and cracking than OPC [6, 7]. As the necessity of GPC is increasing, the application of alkali activated GPC using fly ash becomes predominant area of research. Most of the work contributes to mix proportion and effect of curing of GPC at ambient and elevated temperatures. Considerable research [8] has been conducted on the mechanical properties of fly ash based GPC and reviewed the structural performance.
Different proportions and properties of the constituent materials used in the production of GPC vary the polymerization process which significantly affects the microstructure. Hence, the long-term corrosion behaviour of GPC with flyash is scarcely studied. In addition [10], upgrading the quality of GPC with flyash can obviate the rebar from corroding. But the increased percentage of flyash caused increased corrosion because of low resistivity. Furthermore, when GPC is under aggressive environment [16] for 90 days in a 30days interval, the surface shows no visible cracks or pores. Despite GPC being around for a while, there is limited understanding of the long term performance of GPC in terms of accelerated corrosion and unconventional precursors. To complement the research gap in long term corrosion behaviour studies on GPC, in this study tests were conducted to stimulate 10 years and 20 years of corrosion to evaluate the long-term strength and durability under various conditions. Continuing in the footprint of lime and OPC, GPC could be contemplated as the next-generation cement.
Materials and Methods
Fly ash and GGBS being waste material is obtained from the respective industries are the materials used in this study. Low calcium fly ash is preferred as a source material in fly ash-based GPC, as the presence of calcium in high amounts may interfere with the polymerisation process and result in an alteration of the microstructure [18]. Hence Class F fly ash obtained as a by-product from thermal power plant was used in the present study. GGBS used in this study is a by-product of iron smelting industry. The major oxide composition by mass in GGBS and fly ash are given in Table 1.
The specific gravity of GGBS and Fly ash was found to be 2.9 and 2.24 respectively from the Le-Chatelier Flask experiment carried out. The alkaline activator Na2SiO3 used available in liquid form was used as Na2O:SiO2 in the ratio of 1: 2 and NaOH in the form flakes was used to prepare NaOH solution of required concentration. The composition of NaOH and Na2SiO3 are given in Table 2.
The fineness modulus of fine aggregate is 3.1 having specific gravity of 2.59 (Zone II classification as per IS 383-1970 [23]). The properties of coarse aggregate were evaluated as per IS 2386-1963 (Part I and III) [21, 22] with a fineness modulus of 5.49 and 7.38 having a specific gravity of 2.84 and 2.97.
Mix Proportioning and Casting of Beams
Unlike conventional concrete, GPC does not have a standard mix design procedure. Hence, the final mixes were arrived based on numerous trials. To obtain the mass of NaOH and Na2SiO3 solutions, the ratio of NaOH to Na2SiO3 were used in the different proportions. Around 10 trial mixes were made by varying the proportion of various raw materials. In all the mixes a working time of at least 20 minutes was available before they started losing their fluidity. The final mix details obtained from trial studies for M30 grade concrete are given in Table 3 and the strength results are tabulated in Table 4. From Table 4 it is noted that the rate of strength gain is more in case of GPC when compared to OPC concrete.
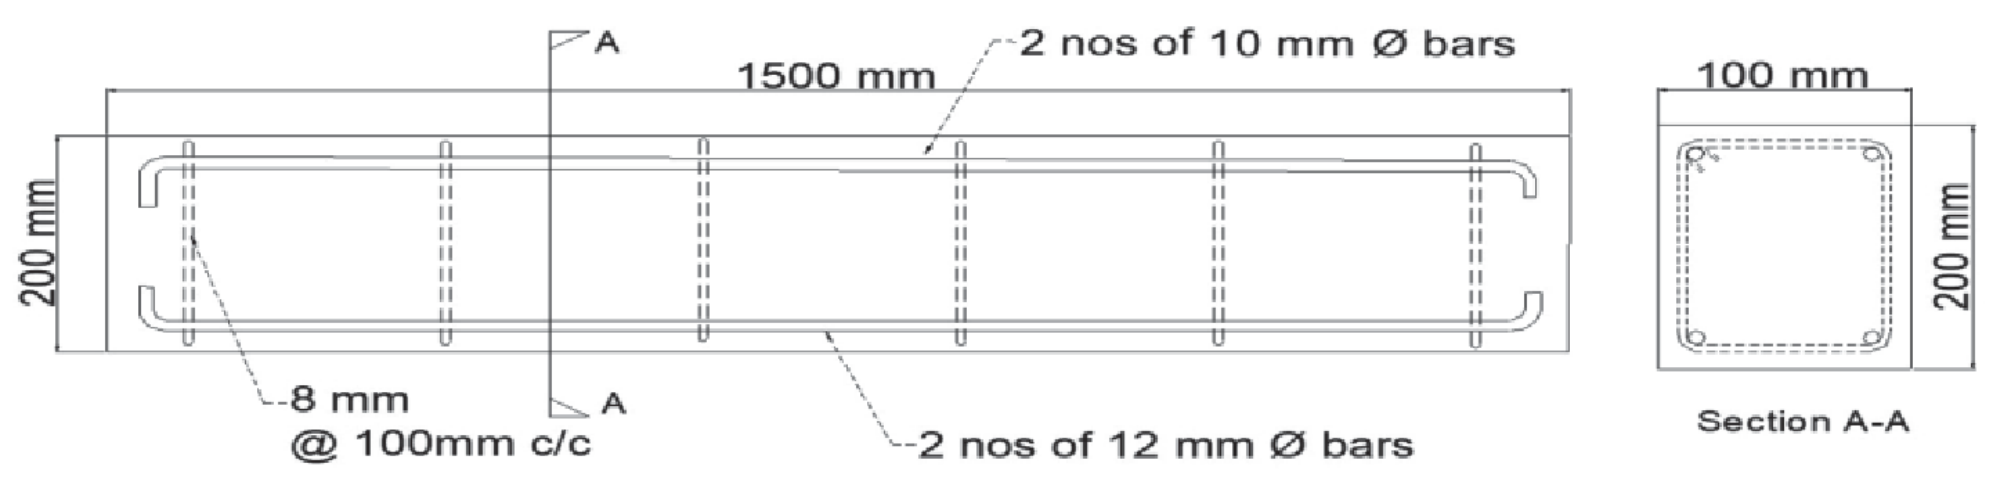
Using these mixes, reinforced concrete beams were cast for corrosion studies. The reinforcement detail of the beams is shown in Fig. 1. The two mixes are designated as GPC1 and GPC2. Control beams were cast for comparison and validation using conventional OPC concrete with grade M30 and designated as OPC, OPC 10 and OPC 20 representing without corrosion and corrosion for 10 and 20 years respectively. The beams are designated as GPC1, GPC1-10 and GPC1-20 refers to GPC beam without corrosion and with activated corrosion of 10 and 20 years.
Table 1.
Oxide Composition % by Mass.
| Compound | SiO2 | Al2O3 | Fe2O3 | CaO | MgO | Na2O | K2O | TiO2 | Mn2O3 | SO3 |
|---|---|---|---|---|---|---|---|---|---|---|
| GGBS | 33.45 | 13.46 | 0.31 | 41.7 | 5.99 | 0.16 | 0.29 | 0.84 | 0.40 | 2.74 |
| Fly ash | 49.45 | 29.61 | 10.72 | 3.47 | 1.3 | 0.31 | 0.54 | 1.76 | 0.17 | 0.27 |
Table 2.
Composition of NaOH & NaSiO3.
| Material | Appearance / Colour | Boiling Point | Molecular Weight | Specific Gravity |
|---|---|---|---|---|
| NaOH | Powder or pellets/ Light yellow | 102ºC for 40% aqueous solution | 184.04 | 1.6 |
| NaSiO3 | Liquid (gel) / colourless | 100°C | 122.06 | 1.5 |
Accelerated Corrosion Test on Concrete Beams
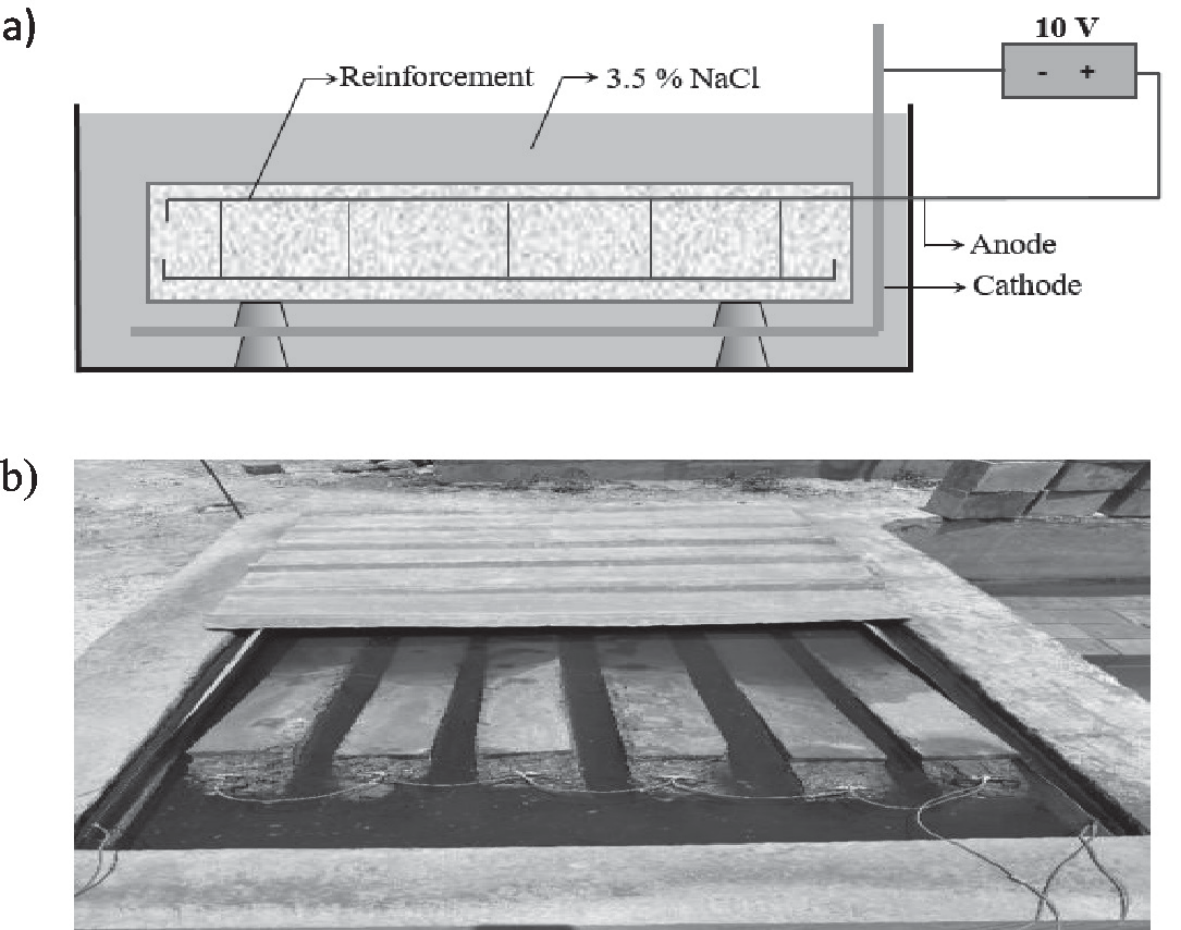
To study the effect of corrosion, the beams were subjected to accelerated corrosion by impressing current to the reinforcement bars and immersing the beams in sodium chloride solution. The accelerated corrosion test setup is shown in Fig. 2. Based on the chemical composition of the reinforcement obtained from the manufacturer, the equivalent weight was obtained as 361.01 g eq. The corrosion rate is assumed as 0.2 mm/year which is followed for very severe corrosion. Hence the mass loss is calculated as below. Mass Loss = Area * Thickness loss * Density
= 1*0.02*7.840
= 0.1568 g / year / cm2 Mass Loss for 10 yrs = 1.568 g / cm2 Mass Loss for 20 yrs = 3.136 g / cm2
The mass of rust produced per unit surface area of the metal due to applied current over a given time can be determined theoretically using the Faraday’s Law as given below:
Theoretical Mass loss,
Where,
Mth - Mass of rust loss (g/cm2)
W - Equivalent Weight of steel (g)
I - Current applied (Amp/cm2)
T - Duration (sec)
F - Faraday’s Constant (96487 Amp-sec)
For simulating 10 years corrosion to occur in 7 days, from equation 1, the impressed current is calculated as 0.00069 Amp/cm2 in 7 days.
Hence the current for simulating 10 years corrosion is = 4208.40*0.00069 = 2.9038 ~3 Amp.
Similarly, for 20 years corrosion to occur in 7 days is 6 Amp.
Special curing tanks were cast for keeping the specimens in sodium chloride solution. The tanks were filled with 3.5 % NaCl solution and beams were immersed in the solution. Prior to that, the reinforcement bars were exposed and were connected to a constant current source for impressing current to the reinforcement. The tank with beam specimens during accelerated corrosion is shown in Fig. 2b). The accelerated corrosion test was stopped after the predesignated time period as per the above calculation.
Test Setup and Instrumentation
After the accelerated corrosion test, the beam specimens were taken out of the tank, completely dried and white washed before carrying out the bending test. The beams were subjected to two-point bending test for evaluating the structural performance before and after corrosion. The beams were instrumented with strain gages and displacement transducers for measuring the various structural parameters. The beams were instrumented with strain gages at mid span and at quarter span locations at top and bottom to find the strain variations during the load testing. Displacement transducers were fixed at bottom of the beam specimen at mid span during load testing. A calibrated load cell was placed between the hydraulic jack and beam specimen for measuring the applied load during the testing. All the sensors were connected to a high speed data acquisition system (data logger) for continuous recording of the responses. The load was given in equal increments and at each increment the initiation of crack and propagation of crack was keenly observed and marked. The specimens were loaded till complete failure. After testing, the beams were completely broken and the reinforcements were taken out. The weight of the reinforcement after corrosion was measured and compared with the weight of the reinforcement before corrosion testing.
Results and Discussion
Visual Inspection
The test set-up was plugged off and beams were removed after 168 hours from solution tank. Around 100 hours of testing, the GPC and OPC specimens were found to be corroded. Rust formation initiated in OPC specimen after 60 hours, whereas GPC specimens were still resisting the rust formation. Brown stain due to rust was the first obvious evidence of corrosion initiation in the steel rebar and the corrosion products were also seen floating in the chloride solution tank. A crack in the OPC beams was discovered after over 100 hours. The crack continued to propagate along the longitudinal direction. After 160 hours of testing, a vertical crack was observed, which grew bigger under flexure. The GPC beams had no cracks, clearly showcasing their better corrosion resistance compared to OPC. GPC specimens showed better durability characteristics than OPC specimens. GPC’s corrosion resistance to accelerated corrosion exposure is considerably enhanced by several variables such as high alkalinity, low permeability and better microstructure.
Load vs. Deflection Behaviour
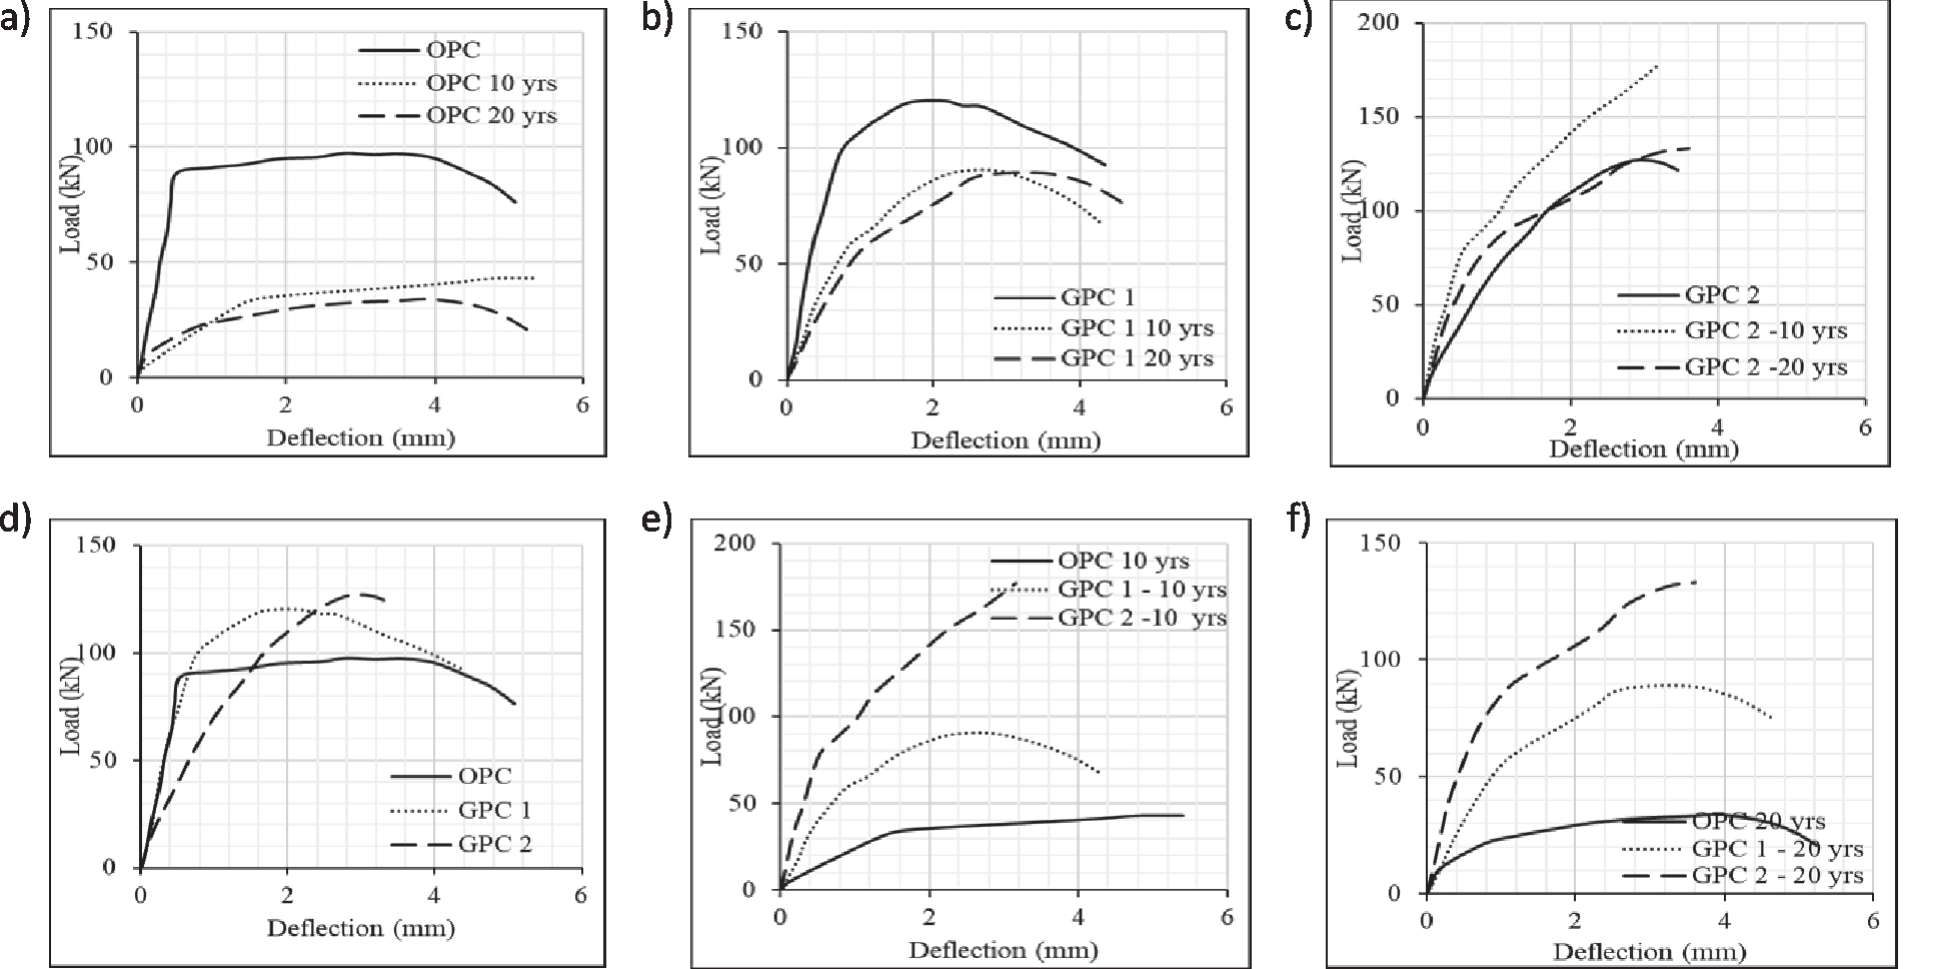
The maximum load carried by GPC beams was higher than that of OPC beam. However, a distinct difference is evident in the shape of the load-deflection curve. The load vs. deflection behaviour of the OPC beam can be categorised as a trilinear curve, with a very distinct yield, maximum and ultimate load points that can be located graphically itself. In case of GPC beams, the shape of the curve was curvilinear in nature, similar to a high strength steel reinforcement under tension. This could be as a result of the inherent behaviour of GPC under tension. In addition, the energy absorption of the GPC beams is similar to the OPC beam, though the peak load is greater in GPC. Once the peak load is attained, there is a curvilinear drop in the load with the increase in deflection. Hence it may be better to restrict the use at post peak strength in GPC beams to a lower limit that a OPC beam of corresponding strength and reinforcement.
Table 5.
Results of the tested beams.
On comparing the mass loss of steel, the OPC beam has more loss than GPC beams in both the mixes. Fig. 3 shows the load vs. mid span deflection curve for the tested beams. It was found that the structural capacity of the OPC beam reduced greatly with corrosion as compared to GPC beams. From Fig. 3a) it is seen that at 10 yrs. corrosion, the peak load reduces by around 50%, however it retained a load carrying capacity of 35% only. On comparing the load carrying capacity of GPC- 1 and GPC-2 beams, it reduced by 24.7% and 28.3% at 10 years corrosion. At 20 yrs. corrosion, GPC-1 and GPC-2 retained a capacity of 74.1% and 75.4% respectively in comparison to 35 % capacity retention by OPC beam. Table 5 shows the results of the tested beams.
After the tests were completed, the beams were broke opened and the reinforcements extracted. The reinforcements were cleaned as per standard procedure and weighed for the weight loss due to corrosion. These values are given in Table 6. From the table it can be seen that the loss in the steel mass in GPC mixes were lesser than OPC mix at all ages. This establishes that GPC mixes offered better resistance to corrosion in comparison to OPC mix.
Load vs. Strain Behaviour
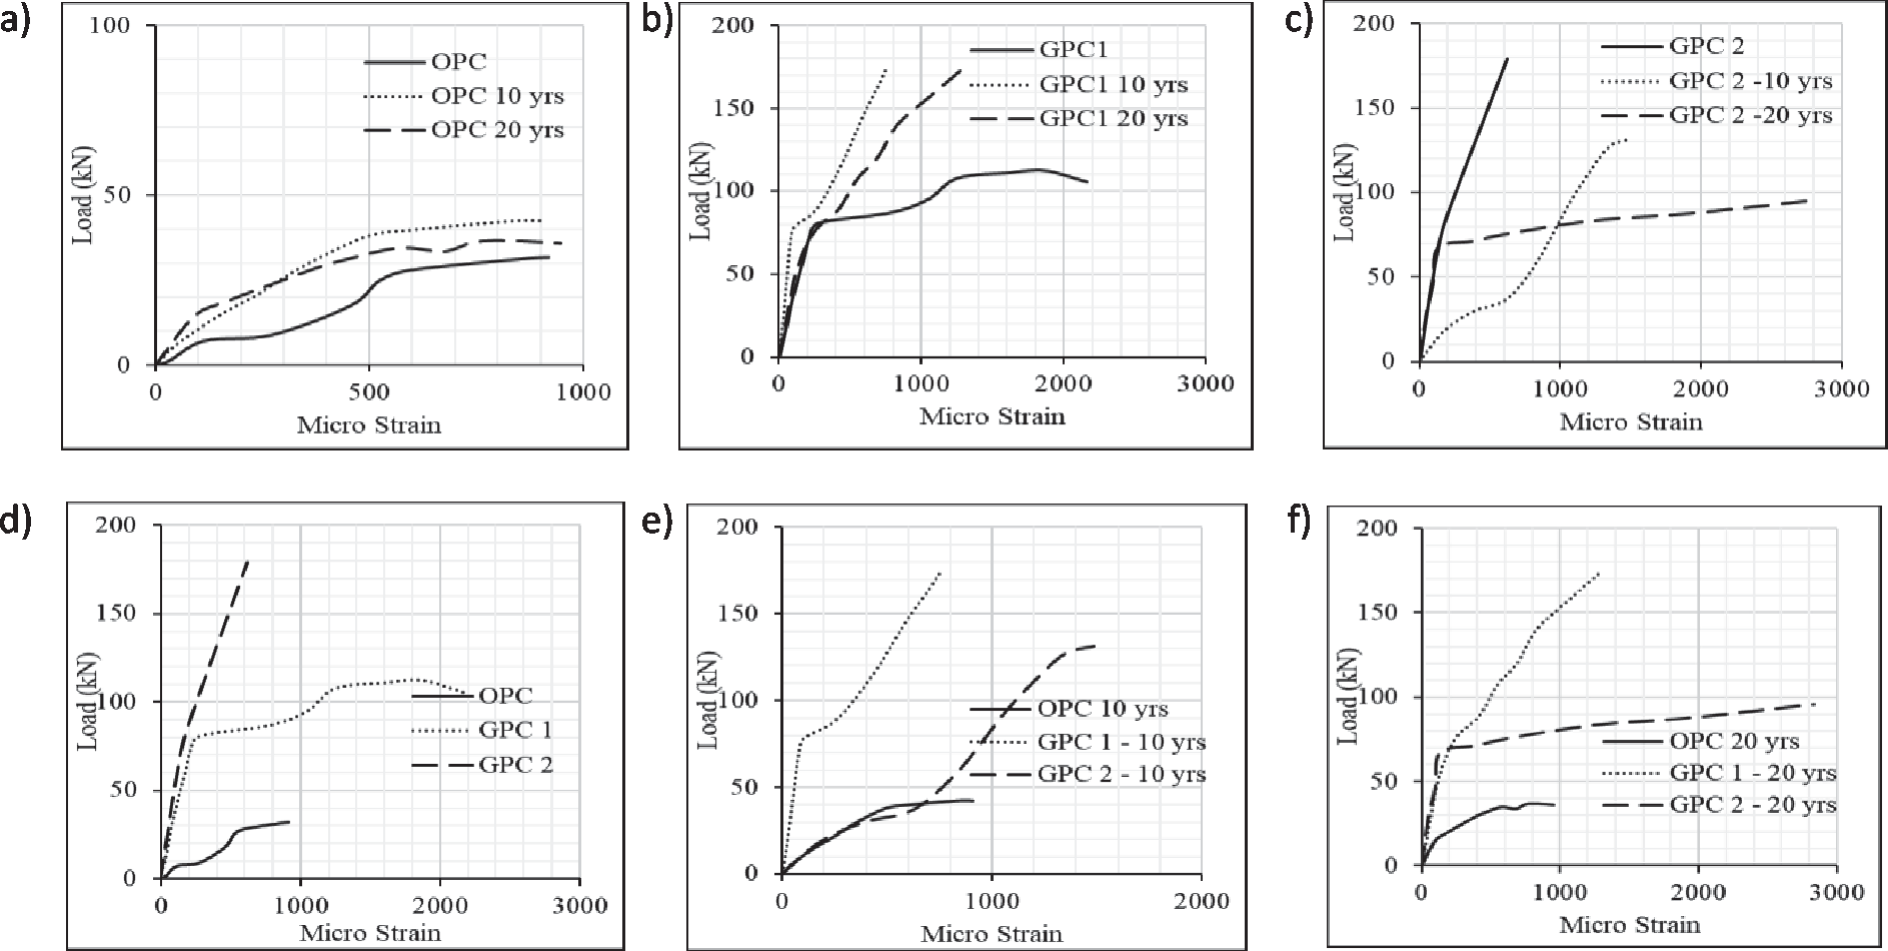
Fig. 4 shows the load vs. microstrain curve for the OPC, GPC-1 and GPC-2 beams tested. From the graph, it can be seen GPC shows better performance than OPC. On comparing GPC 1 and GPC 2 plots, during the initial test the ultimate load capacity of GPC 2 is 180 kN which is superior. As the corrosion level of the beam increases, GPC 1 is observed to produce stable results. The maximum strain response of 2750 microstrain is recorded by GPC 2 specimen during test at corrosion level of 20 years whereas GPC 1 recorded a 2200 microstrain. The control specimen made up of OPC recorded less than 1000 microstrain in all the tests. These results clearly show GPC has higher strain rate compared to OPC specimens.
Mass Loss Measurements
Before the casting phase, the initial mass of rebar was noted. Following the corrosion exposure, and load testing the beams, the rebars were extracted. Metal brush and deionized water were used to remove the corrosion products and clean the rebar. The ultimate mass was calculated by weighing the rebar taken from the beams. After that, the proportion of mass loss for rebar in both OPC and GPC beams was computed. The comparative mass loss of GPC and OPC specimens are shown in percentage in Table 6. It was found that the steel rebar in the OPC beams had significant corrosion damage, but the rebar in the GPC beams had less corrosion damage than the OPC beams. The OPC beams lost a large amount of mass compared to GPC beams due to their early corrosion and crack propagation which infused chloride ions to penetrate easily. This mass loss % clearly depicts the better corrosion resistant behaviour of GPC.
Table 6.
Mass loss in steel reinforcement due to corrosion.
Failure Modes
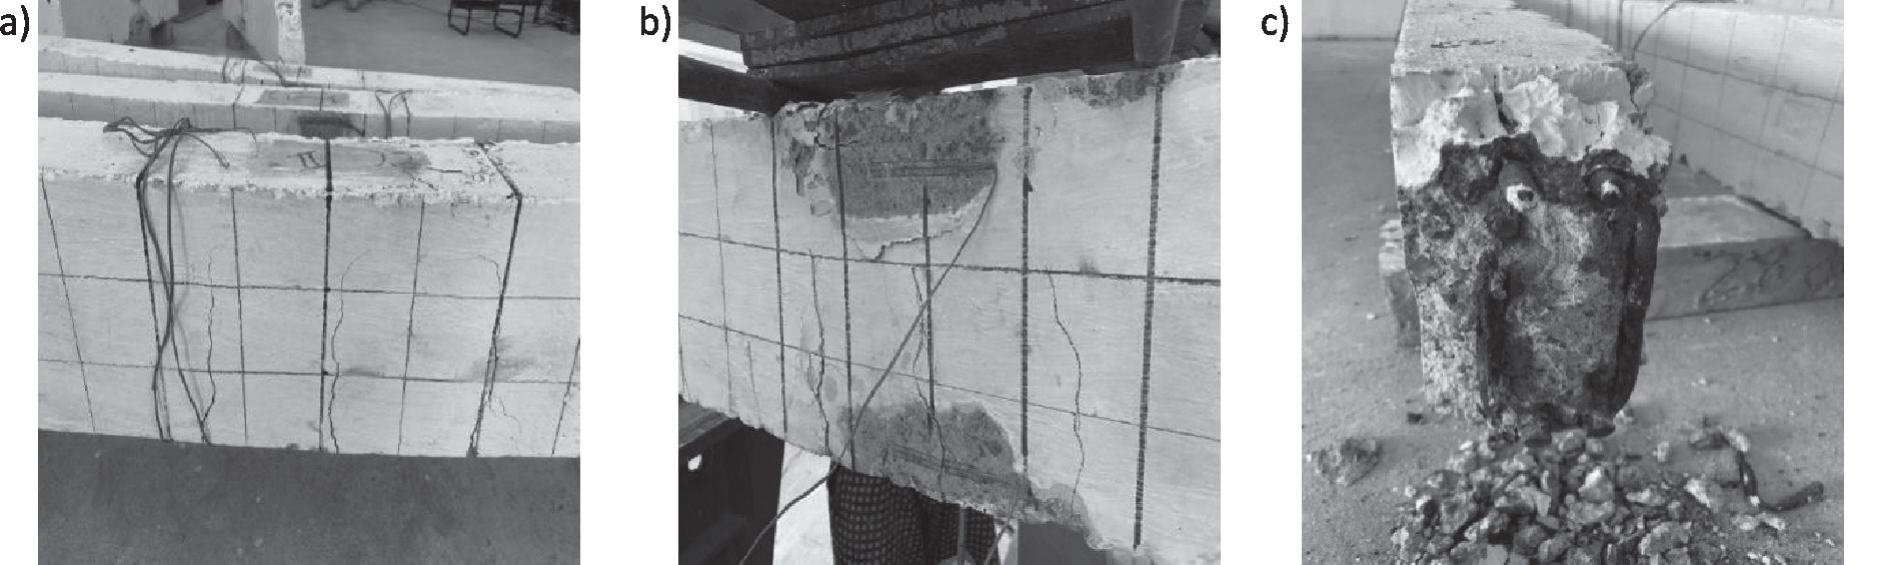
Figs 5a) and b) show the typical crack patterns observed during the testing of GPC specimens. Fig. 5c) shows the broke open specimen after testing. Cracking was initiated only after the applied moment reached the cracking moment. Initial crack in GPC specimen was originated in the middle tension side of the beam under the loading point. The initial crack in GPC specimen was observed below the loading point. The initial crack load of GPC is higher than the initial crack load of OPC. Sometime after the initial crack was formed, many new cracks were emerged which propagated on continuous loading. The cracks observed in the specimens were vertical flexural cracks, runs normal to the longitudinal axis of the beam. The width of the crack was enlarged gradually due to the continuous loading and the crack propagates to the compression side of the specimen. The broke owing to concrete crushing in the middle top of beam (compression side) just under the loading point. The failure is observed at centre of the span and the point of loading. In Fig. 5b) the crushing of concrete under the load can be seen, which propagated instantaneously, followed by the rupture of the rebar (tension-compression failure). The failure of GPC specimen was ductile failure because the crack propagate from the bottom side to top of the specimen (tension to compression) and crushing of the concrete happened at the bottom side of the specimen.
Conclusions
From the experimental results, various conclusions were drawn – GPC has better corrosion resistance as well as
residual strength even after substantial reinforcement
corrosion. – GPC beam exhibits far better structural performance
than OPC for similar level of corrosion stimulated – Surface strains measured shows a higher strain in
OPC at lower load levels when compared to GPC. – Comparatively GPC shows 5-7% higher compressive
strength than OPC. – Compared to OPC, the average rate of corrosion and
rate of mass loss in GPC samples were reduced by
72% and 79%, respectively. – GPC shows 21% more residual flexural strength than
OPC specimens. – The resistance developed by GPC to the chloride
ingress can be attributed to the better microstructure
of the developed GPC. – GPC demonstrated lower values for corrosion rate
compared to OPC because GPC has a moderate rate
of corrosion (between 10 µm/year and 20 µm/year).
Whereas OPC showed a higher rate of corrosion (40
µm/year and 60 µm/year). – Visual inspection of the accelerated corrosion test
revealed that vertical and horizontal cracking has
begun in OPC after 60 hours of exposure. In GPC
only development of micro-cracks was observed
which is read from the drop in potential values. – The time taken by the GPC specimens to develop
corrosion products equivalent to OPC specimens
were 3- 5 times greater than OPC specimens.

