

Introduction
As a category of living agricultural production systems worldwide, agriculture-forestry-animal husbandry composite systems are also typical social-economic-natural complex ecosystems [1]. They boast rich biodiversity, which can meet the needs of local socio-economic and cultural development, and are conducive to promoting regional sustainable development. For the purpose of better designation and conservation of the agriculture-forestry-animal husbandry composite Systems, the Food and Agriculture Organization of the United Nations (FAO) has established five essential selection criteria for agriculture-forestry-animal husbandry composite Systems [2-3]. These criteria are as follows: 1) Food and livelihood security;
2) Agro-biodiversity; value systems and social organisations; 3) Landscapes and seascapes features. Accurately assessing supply and demand in agriculture, forestry, and livestock ecosystems, and comprehending the impact of human activities on these systems, is imperative for global agrobiodiversity conservation and ecosystem sustainability [4-5]. Currently, this represents a significant global focus in terms of ecosystem service supply and demand. In most research, the provision and utilization of ecosystem services play a pivotal role in providing sustenance and livelihood opportunities across diverse physical, social, and economic strata [6-8]. These services fulfill the need for a healthy environment, uncontaminated water sources, and scenic recreational areas. Ecosystem resilience refers to an ecosystem’s capacity to self-regulate and recover, even when exposed to various external environmental pressures and disturbances that may disrupt equilibrium. To maintain an ecosystem’s structural and functional integrity and ensure consistent service provision to human society, it must endure external perturbations and recover swiftly [9-10]. Ecosystem resilience serves as an indicator of its inherent recovery capacity. The balance between ecosystem service supply and demand mirrors the conflict between human requirements and the utilization of natural resources. By implementing artificial restoration techniques during ecological rehabilitation and minimizing adverse impacts on ecosystems, this conflict can be mitigated, resulting in an overall enhancement in the functionality of ecosystem services [11].
Currently, there is limited research on ecosystem service supply, demand, and ecological resilience, particularly in the development of systematic approaches for creating multi-species composite ecosystems. Previous studies have primarily focused on four key areas: 1) Ecological resilience restoration methods are based on the ecological security pattern, resulting in established research paradigms that center around identifying restoration areas and extracting source nodes [12-13]. Technical terms will be introduced upon their first use. To ensure clarity and logical coherence, it is vital to establish causal connections between statements. Sentences and paragraphs will be structured for a smooth flow of information, avoiding unnecessary complexity. The language employed will adhere to formal, objective, and academic standards, devoid of bias or emotion. The text will be grammatically correct, with accurate spelling and punctuation. For instance, Rau employed the ecological security pattern paradigm to map ecological source and obstacle areas, as well as ecological resistance surfaces in Quebec, Canada [14-15]. They categorized the region into five ecological restoration classes: strong ecological restoration, strong restoration, average restoration, poor restoration, and very poor restoration. Additionally, they conducted a comprehensive diagnosis and evaluation to classify "social, social, and ecological restoration" within these five ecological restoration classes [16].
2) Ecological restoration methods are proposed based on the established ecological security pattern. Mature research paradigms primarily concentrate on identifying areas requiring restoration by extracting source nodes. To maintain the integrity of the evaluation, the conflict relationship between social and ecological systems is leveraged in constructing the evaluation index system for land space zoning. Analyzing the interaction among multiple diagnostic factors, as demonstrated by Bennett, is imperative for assessing ecological resilience. Technical terms are defined upon their initial use, and a passive tone is employed to maintain objectivity. Consistent with Bennett and colleagues' development of an evaluation index system for the carrying capacity of mine ecological environments, this study aims to establish a similar system for evaluating the carrying capacity of mining ecological environments, assessing resilience, and proposing pertinent protection and restoration recommendations [17]. 3) Emphasize dominant regional functions while considering their overall roles and positioning. Apply isomorphism theory and the principle of synergistic development to assess the comparative advantages of different spatial units in terms of their functions [18]. Maintain objectivity and clarity, avoiding subjectivity. Define technical terms when first introduced, using a formal tone with precise vocabulary and grammatical accuracy [19]. Ensure consistent citations and clear quotation identification. Strive for objective and balanced language, avoiding bias or emotional tone. For instance, as suggested by Raudsepp-Hearne, achieving regional ecological restoration can be accomplished through dominant function zoning. This process involves analyzing the positioning and connotative characteristics of dominant functions, including those related to regions, ecosystem service provision, and villages [20, 21]. 4) This study underscores the capacity of ecosystem services to meet human needs by recognizing ecosystems' ability to provide services aligned with human intentions, based on the interdependencies among ecosystem services [22]. Armoskaite quantified the supply and demand of regional ecosystem services at the community level, establishing a coherent relationship between them. This effort resulted in the classification of the Czech Republic into six categories: ecological key restoration area, ecological potential restoration area, ecological and economic restructuring and reform area, special agricultural development area, ecological core protection area, and ecological and industrial upgrading and construction area [23-24].
To secure ecosystem services and vital restoration areas, optimizing the establishment of an ecological connectivity restoration zone in the Dibu Zagana region is crucial [25]. Implementing protective measures is essential to shield the agro-pastoral-forestry composite system from adverse effects caused by resource flows. Establishing this protective framework is pivotal for system security [26]. However, it's important to note that this research exclusively focuses on the supply and demand of single-supply ecosystem services, without considering multi-supply ecosystems. This limitation hinders our ability to capture the unique characteristics of multi-supply ecosystems. Additionally, in the Diabu-Zagana region, accelerated glacier melting due to global climate change has led to changes in the forest structure. This, in turn, has resulted in ecosystem instability caused by unregulated livestock grazing, increased local ecosystem supply demands, and environmental degradation associated with extensive tourism development and construction in the area. Developing an analytical framework for assessing global agroforestry-pastoral ecosystems is imperative [27, 28]. This framework will serve as the foundation for evaluating both the supply and demand of these ecosystems and establishing a theoretical basis for their conservation across various regions. In this paper, we focus on ecosystem service supply, demand, and ecological resilience, introducing a supply-demand-resilience framework. This framework bridges ecological and social factors, providing insights into ecological restoration zones in Zagana based on multiple levels of ecosystem service supply, demand, and ecological resilience. Furthermore, the framework aids in the identification of ecological restoration zones by considering "ecosystem service supply and demand + ecological resilience". It guides the scientific development of the ecological restoration plan for the Zhagana region, offering tailored restoration techniques to address specific ecological challenges in different zones [29].
Experimental
Study Area
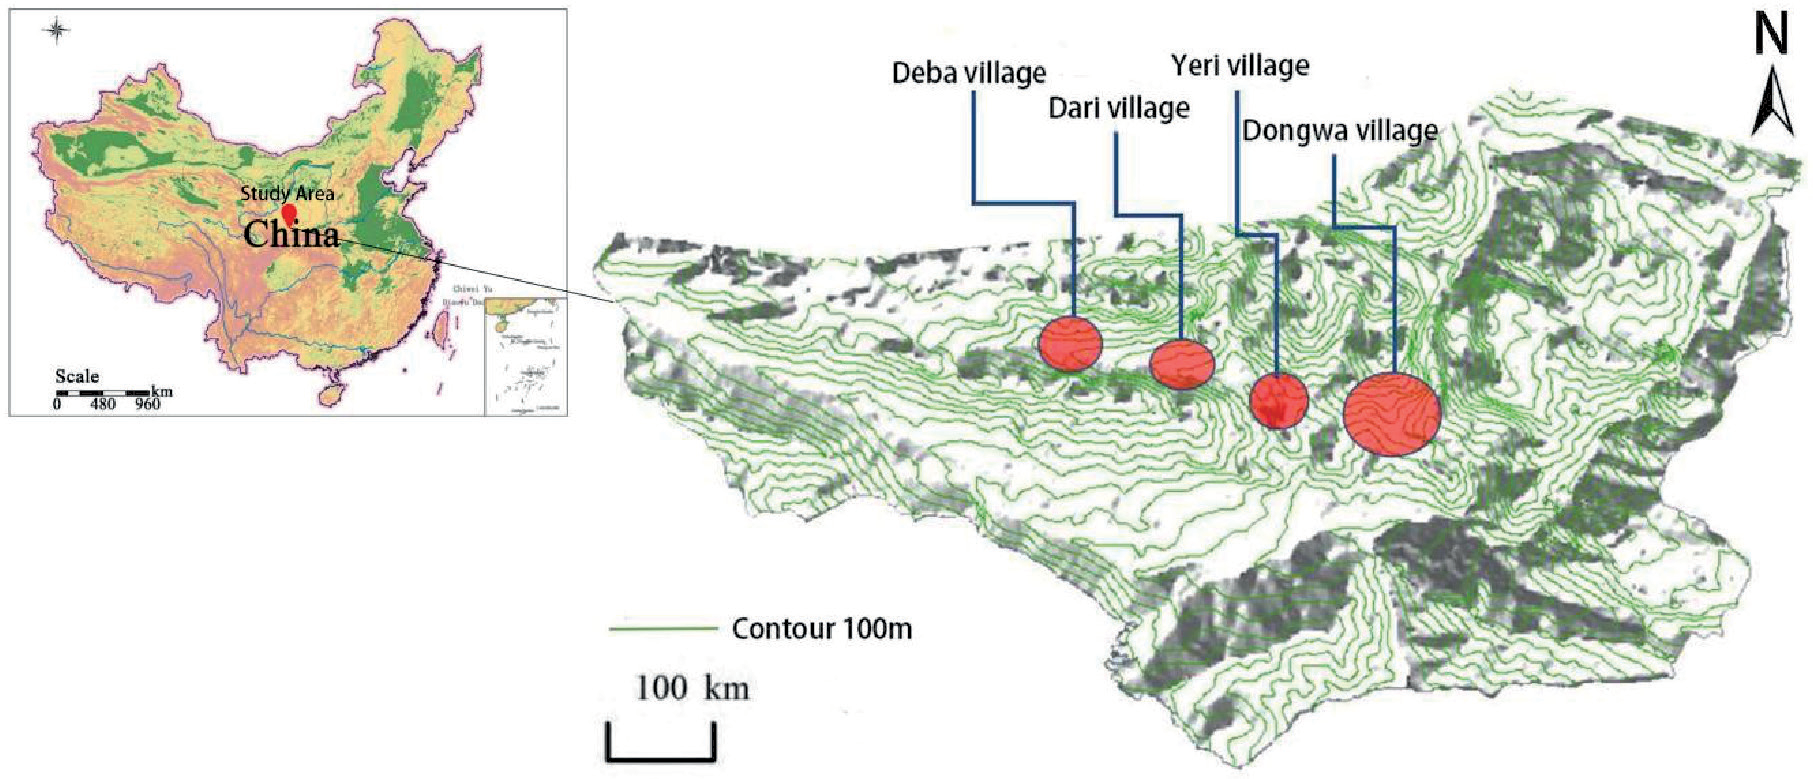
Zagana is located in Gansu Province, China, within the Gannan Tibetan Autonomous Prefecture, specifically in Dianbu County. It is positioned approximately 34 km northwest of Yi-Wa township, bounded by longitude 102°50′50″ - 103°10′20″ and latitude 34°09′40″. The region extends from 34°10′80″ in the north to the south. Zagana shares its borders with Zhoni county to the north, Dangchang and Zhouqu counties to the east, and Min county to the northeast. It also has boundaries with Norgay county and Jiuzhaigou county in Sichuan to the southwest. Covering a total area of 36,500 square meters, Zagana comprises four natural villages: Dongwa, Yeri, Dari, and Daiba, along with the Tibetan Buddhist temple called Rasang Monastery, four additional villages, and a typical Tibetan village. Zagana experiences a cold and humid climate due to its average altitude of 2800 m. In January, the coldest month, temperatures average -4.1ºC, while in July, the warmest month, they reach 15.9ºC. The average annual rainfall amounts to 625.6 mm, with 50.6% occurring in summer and 24.8% in autumn. Most rainfall takes place during the summer and autumn months, exhibiting uneven spatial distribution, decreasing with altitude, and being more pronounced in the high mountains compared to the river valleys. Overall, the region demonstrates alpine climate characteristics, featuring cool and humid conditions, without extremely cold winters or scorching summers. Notable diurnal temperature variations and inter-annual fluctuations in rainfall are observed [30-31]. Spring is characterized by windiness and lower rainfall, while autumn tends to be cloudy and rainy (Fig. 1).
Data Sources
The land use data (2022) utilized in this study were sourced from the Chinese Academy of Sciences’ Resource and Environmental Science and Data Centre data platform (http://www.resdc.cn/). The data had a spatial resolution of 30 m and were categorized into six groups: cropland, forest land, grassland, pasture, construction land, and unused land. Digital Elevation Model (DEM) data with a spatial resolution of 30 m were obtained from the Geospatial Data Cloud Platform (http://www.resdc.cn/). Agricultural, forestry, and livestock yields for each county (district) were obtained from the Gansu Rural Economic Statistics. Data for different types of agricultural, forestry, and livestock production in counties (districts) were sourced from the Gansu Rural Economy Statistical Yearbook (2022) and Gansu Statistical Yearbook (2022). The Normalized Difference Vegetation Index (NDVI) data were obtained from the MOD13Q1 dataset (https://ladsweb.modaps. eosdis.nasa.gov/) with a spatial resolution of 500 m. Net Primary Productivity (NPP) data were collected from the Gansu Statistical Yearbook (2022). The Baidu Map Open Platform was used to collect the Area of Interest (AOI) data. All data were resampled to a 100m resolution using ArcGIS software and projected to Albers coordinates.
Research Methods
Ecosystem Service Provisioning Calculations
To accurately assess the ecosystem provisioning status of the Ga'na region, this study focuses on five service categories: 1). Agriculture-forestry-animal husbandry composite system provisioning services. 2). Soil conservation services. 3). Agriculture-forestry-animal husbandry composite system upgrading services. 4). Water production services. 5). Recreational services (Table 1). The supply service of the agriculture-forestry-animal husbandry composite system is quantified as the land's capacity for agricultural, forestry, and livestock activities [32-33]. Water production in Diebu Zagana is measured using the InVEST model's water production module. The enhancement of the agriculture-forestry-animal husbandry composite system is assessed based on its carbon fixation level. The synergy among these three ecosystems significantly influences the complex system's enhancement, with a positive correlation to carbon fixation. For soil conservation services, the China Soil and Water Erosion Model (CSLE) is employed, as it suits soil erosion measurement in China. Additionally, to estimate recreational services, we create a 100 m × 100 m grid from current land use and AOI data. Recreational service provision is represented by the area of recreational open space within this grid [34].
The ecosystem services provision was determined by normalizing the results of the five services and then combining them with equal weights [35]. The mean value of the service function was calculated using the zonal statistics function in ArcGIS software, using the raster data of ecosystem service provision in Zagana. The equations for the supply, demand, and resilience of the ecosystem services are as follows.
In the formula: Xi is the supply, demand, and resilience index corresponding to grid i; Xmax is the maximum value in the grid data; Xmin is the minimum value in the grid data; X value ranges from [0, 1].
Table 1.
Calculation Method of ecosystem service supply.
Calculation of Ecosystem Service Requirements
Assessing ecosystem service demand effectively reveals the impact of human activities on the regional natural ecosystem. To align with the supply dimension of ecosystem services, the assessment’s demand indicators corresponded to the supply indicators [36]. Calculating supply and demand for the agriculture-forestry-animal husbandry composite system considered the needs of both humans and livestock. This encompassed evaluating water demand, the demand for enhancing the agriculture-forestry-animal husbandry composite system, the need for recreation and leisure, and the requirement for soil conservation services. These assessments were conducted using the CSLE model [37]. The methodology for calculating the demand for each ecosystem service is outlined ( Table 2). Ecosystem service demand was determined by normalizing and equally weighting the outcomes of the five service demand types. The average regional demand was computed by dividing the statistics.
Degree of Matching and Synergy between Supply and Demand for Ecosystem Services
The study utilized GeoDa software to analyze the variance-standardized ecosystem service supply and demand results. The bivariate local autocorrelation module was employed to assess the quantitative and spatial matching relationship, and the findings were visualized using LISA plots, employing the quadrant method. The results were categorized into four groups: high supply-high need (quadrant I), low supply-high need (quadrant II), low supply-low need (quadrant III), and high supply-low need (quadrant IV). To characterize the spatial characteristics of ecosystem service supply and demand in the Zagana district, two indices were introduced: the ecosystem service supply-demand ratio (ESDR) and the comprehensive ecosystem supply-demand ratio (CESD) [38]. The supply and demand ratios were used to assess the state of each type of ecosystem service, while the CESD measured the overall level. The relationship between the supply and demand of the five types of ecosystem services could be in a state of deficit (ESDRi<0, where supply is less than demand) or in a state of surplus (ESDRi>0, where supply is more than demand).
In the formula: ESDRi is the supply-demand ratio of ecosystem services in network i; Si is the supply of ecosystem services in network i; Di is the demand of ecosystem services in network i; Smax is the maximum value of supply; Dmax is the maximum value of demand services; CESDi is the combined supply-demand ratio of ecosystem services in network i. β is the number of ecosystem services; n = 1 is the supply service of agriculture-forestry-animal husbandry composite system; n = 2 is the water demand service; β is the number of ecosystem services; n = 1 is the supply service of agriculture-forestry-animal husbandry composite system; n = 2 is the water demand service; n = 3 is the enhancement demand service of agriculture-forestry-animal husbandry composite system; n = 4 is the soil conservation service; n = 5 is the recreation service. supply service, n = 2 is the water demand service, n = 3 is the upgrading demand service of the agriculture-forestry-animal husbandry composite system, n = 4 is the soil conservation service and n = 5 is the recreation and leisure service.
Table 2.
Calculation methods of ecosystem service demand.
Calculation of Ecological Resilience Level
Resilient ecosystems exhibit strong self-sustainability and self-regulation capacities. Assessing resilience requires establishing a comprehensive set of indicators. Previous research has identified climate, vegetation, biodiversity, nutrient factors (especially soil fertility), habitat conditions, and human activities as pivotal factors influencing ecological resilience and stability. In this study, we conducted a comprehensive assessment of ecological resilience in the Zagana region, considering regional conditions and data availability. Our evaluation encompassed six aspects: land condition, soil quality, climatic factors, vegetation health, landscape diversity, and human impact (Table 3). To address significant topographical variations in Zagana and depict ecological stability across diverse terrains, we selected three key indicators. Soil resilience spatial disparities were characterized using pH and organic matter content data from surface and subsurface soils, obtained from the soil database. Given substantial year-to-year variations in climatic factors in Zagana, we chose multi-year averages of precipitation and temperature to represent climatic conditions. Biodiversity was partially assessed using the landscape diversity index and landscape fragmentation index, recognizing the challenges associated with acquiring species and biomass data [44]. Vegetation growth was quantified by analyzing vegetation cover and forest area per capita. Additionally, we considered human impact on ecosystems by assessing disturbance intensity and ecological resilience (Table 4).
Table 3.
Evaluation index system of ecological resilience.
Results and Discussion
Spatial Patterns of Ecosystem Service Provision in Zagana
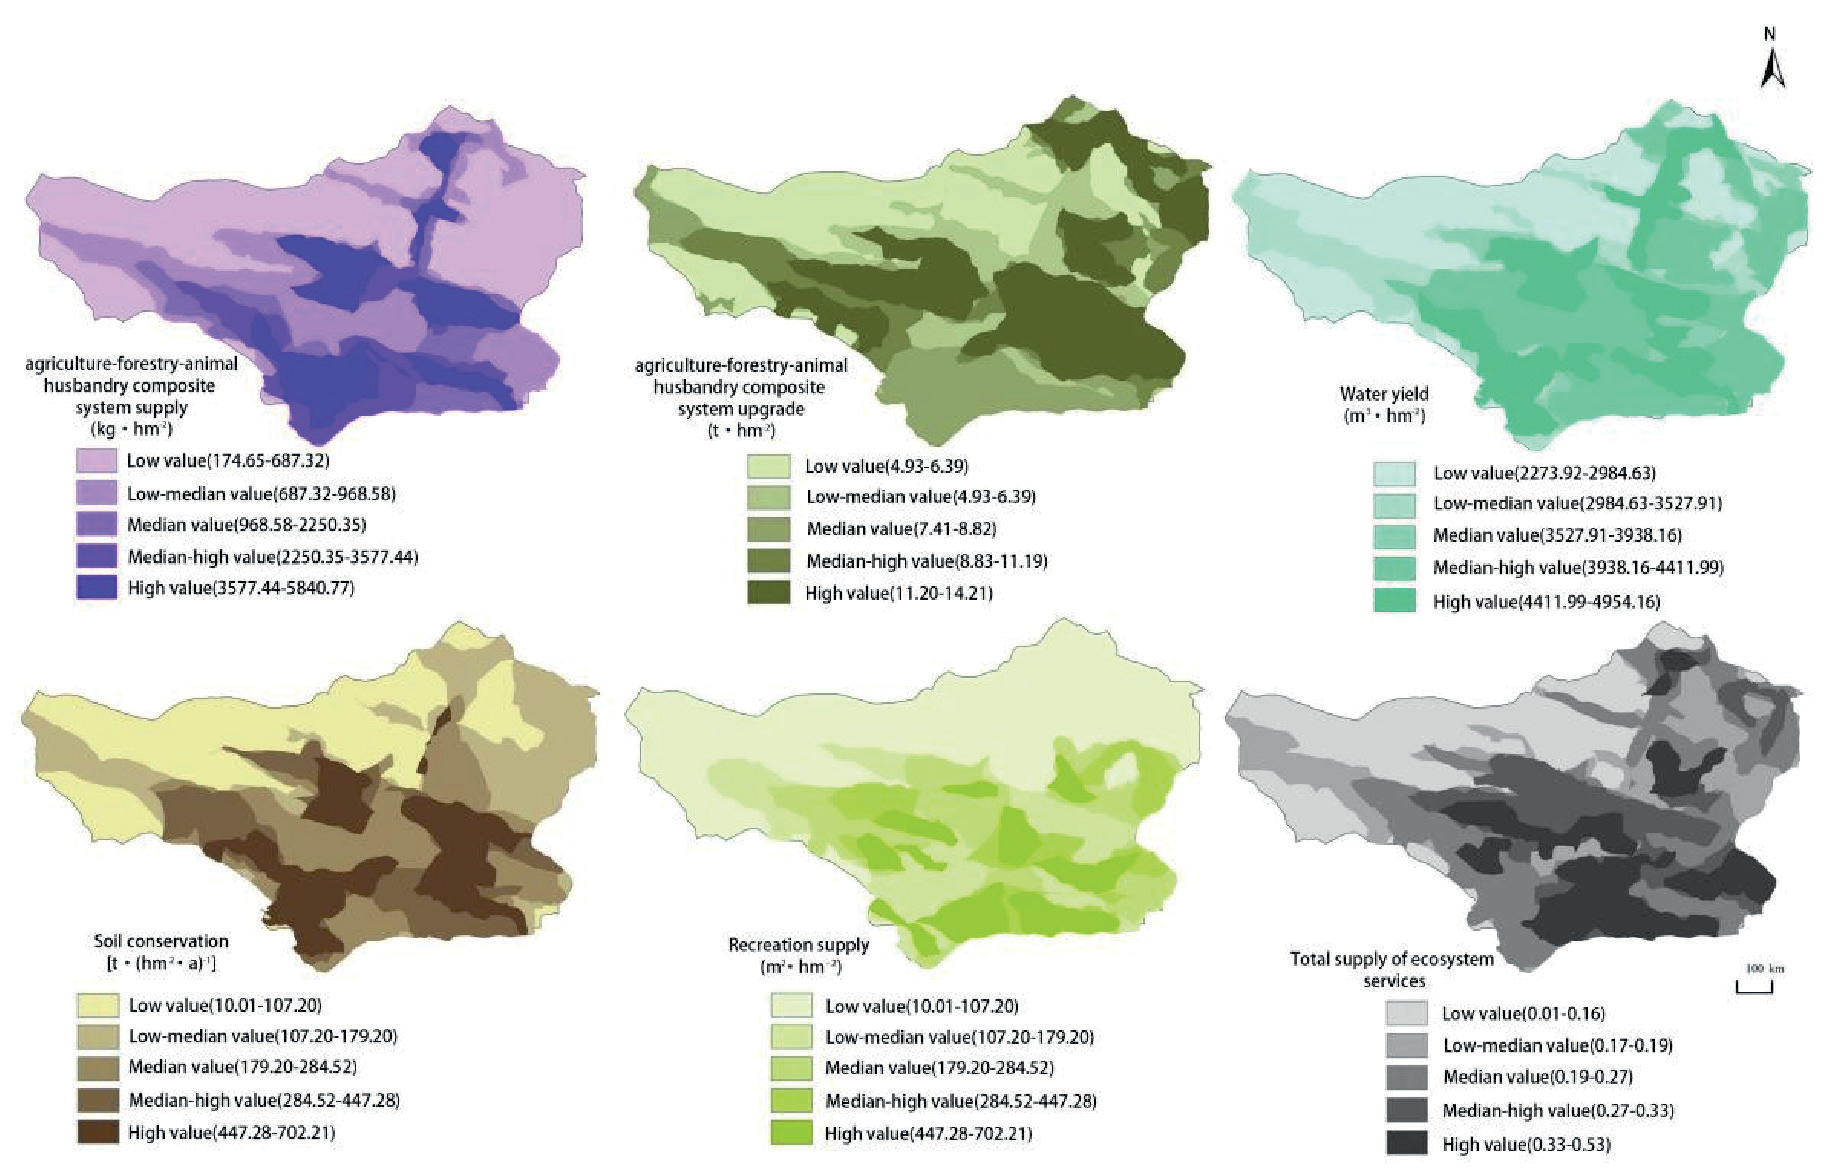
The study area’s ecosystem service provisioning status was categorized into five zones (low, medium-low, medium, medium-high, and high value) using the natural breakpoint method. Zagana displayed significant spatial variations among various ecosystem service types, as illustrated (Fig. 2).
Areas with above-median values for agriculture-forestry-animal husbandry composite system provisioning were predominantly located in the southern region and on shaded mountain slopes. The overall distribution pattern indicated lower values in the north, higher values in the south, and lower values in the east compared to higher values in the west [39]. Conversely, regions with a high-value agriculture-forestry-animal husbandry composite system enhancement were concentrated in the northern and central-western parts of the area. These areas featured dense forest cover and lush vegetation, fostering synergistic effects and enhancing the capacity of the agriculture-forestry-animal husbandry composite system.
Regarding water production services, high and medium-high value areas clustered in the lower-altitude regions of the southern valley, where both precipitation and water storage capacity were higher. Soil conservation services exhibited a spatial distribution with higher values in the south and lower values in the north, as well as lower values in the east and higher values in the west. High and medium-high values were observed in proximity to the three villages in the Zagana area, indicating improved soil conservation capacity through artificial soil conservation systems.
High and medium-high recreational zones were concentrated around viewpoints and accessible road areas, capitalizing on the unique natural landscape. These areas included diverse landscapes such as woodlands, grasslands, and agricultural regions [40]. Conversely, low-value zones were primarily located at high altitudes and on the sunny slopes of northeastern mountains. These regions experience year-round snow and ice cover or high light intensity and evaporation, rendering them unsuitable for plant survival due to adverse natural substrate conditions.
Table 4.
Index weight and evaluation criteria of ecological resilience.
Spatial Patterns of Ecosystem Service Demand in Zagana District
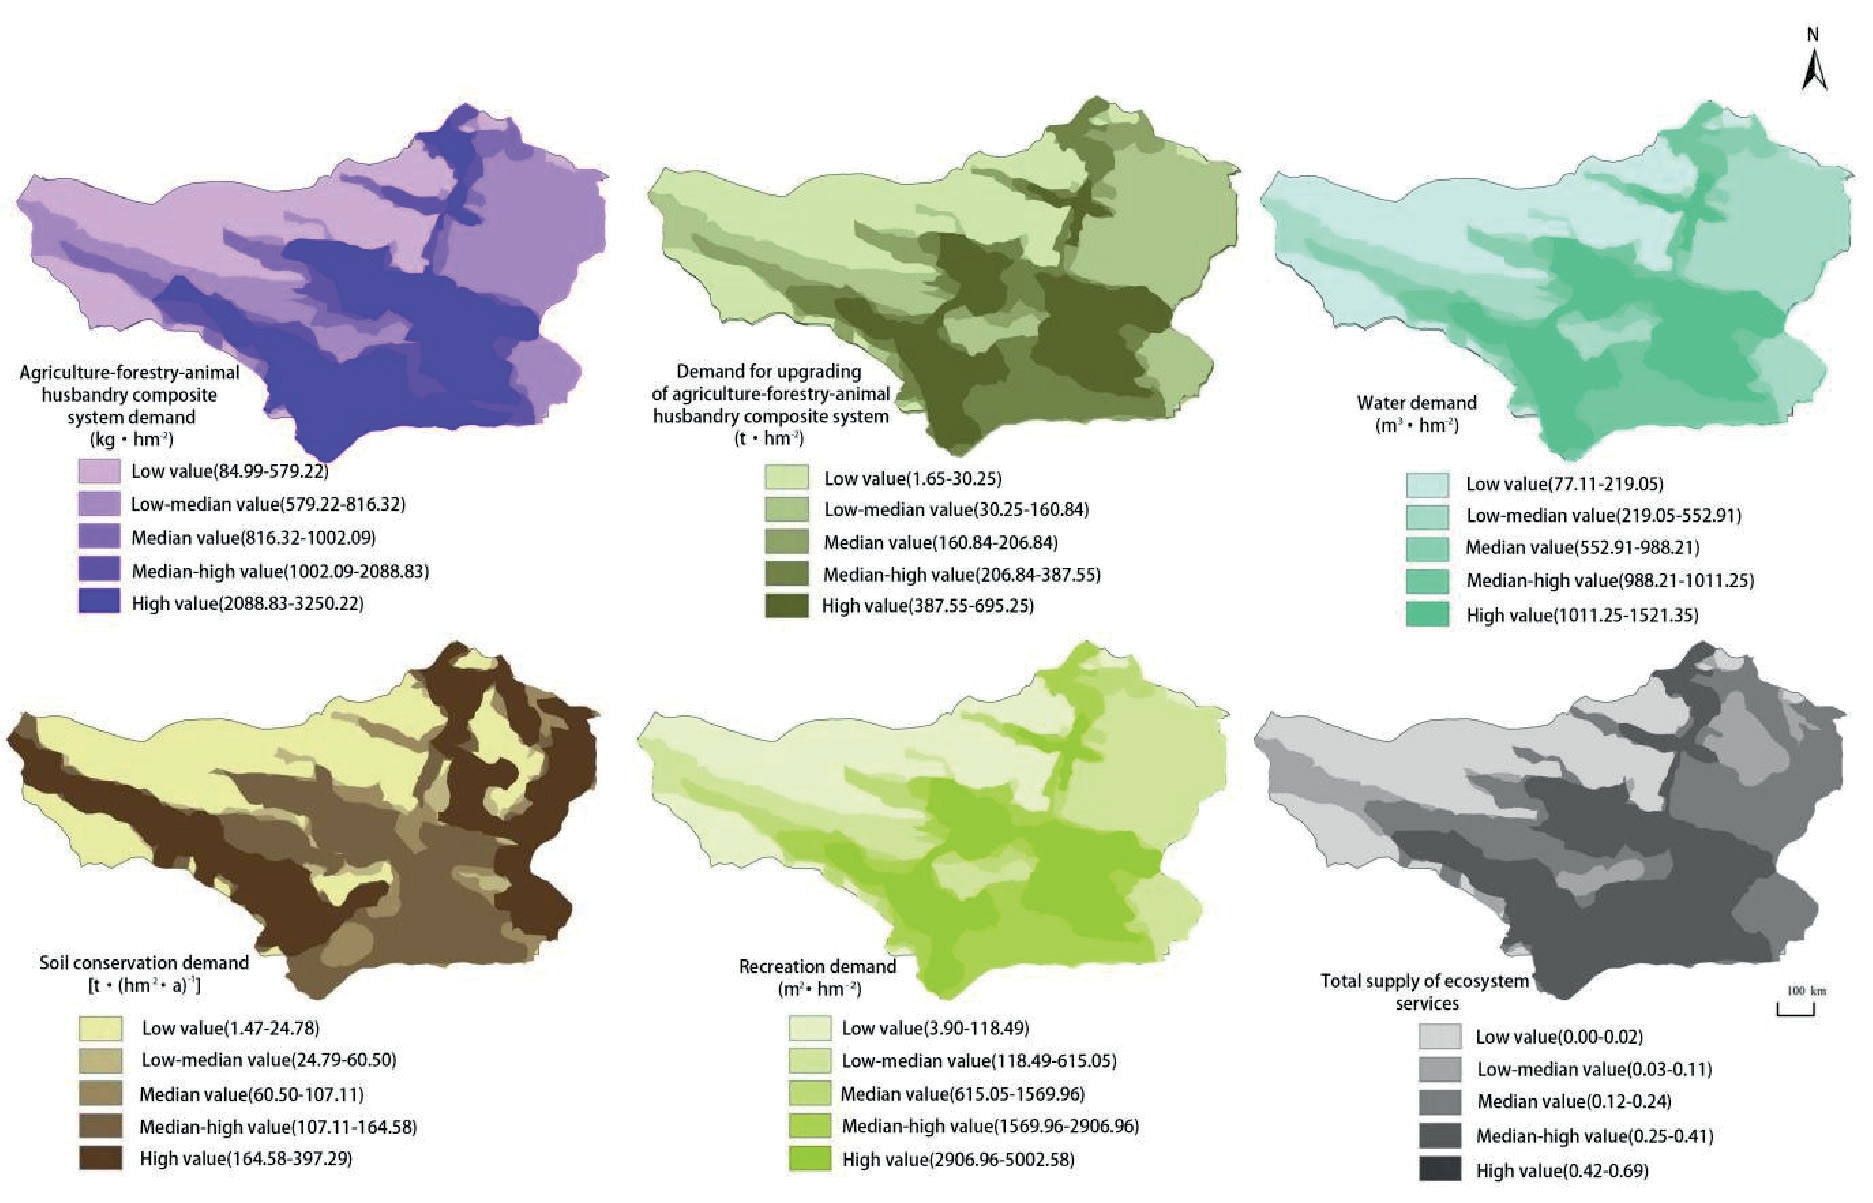
In Zagana, we categorized ecosystem service demand into five zones: low, medium-low, medium, medium-high, and high-value using the natural breakpoint method (Fig. 3). We examined the spatial distribution of demand for services, such as agriculture-forestry-animal husbandry composite system provisioning, water production, recreation, and enhancement of the agriculture-forestry-animal husbandry composite system, relative to population density. High and medium-high demand areas for these services are primarily concentrated around the four villages and tourist gathering areas in Zagana, expanding due to a dense population and increasing demands. Additionally, high and medium soil protection needs prevail in high-altitude areas on the eastern and northwestern sides of the site, where substantial precipitation contributes to soil erosion and landslides, negatively impacting soil stability [41].
After normalizing and equally weighing the five types of ecosystem service demands in the Zagana area, we observed that high and medium-value zones for total ecosystem service demands were mainly concentrated in the Dongwa, Yezh, Dari, and Daiba villages, covering 46% of the total area. Conversely, the low-value zones were primarily located in the high-altitude areas in the northwestern part of the site, encompassing 29.21% of the total area. Additionally, the medium and low-value zones were predominantly situated in the central area, characterized by farmland and rivers, accounting for approximately 24.54% of the area. Thus, the demand for ecosystem services predominantly centers on areas with high levels of human activity.
Degree of Matching and Synergy between Supply and Demand for Ecosystem Services in Zagana District
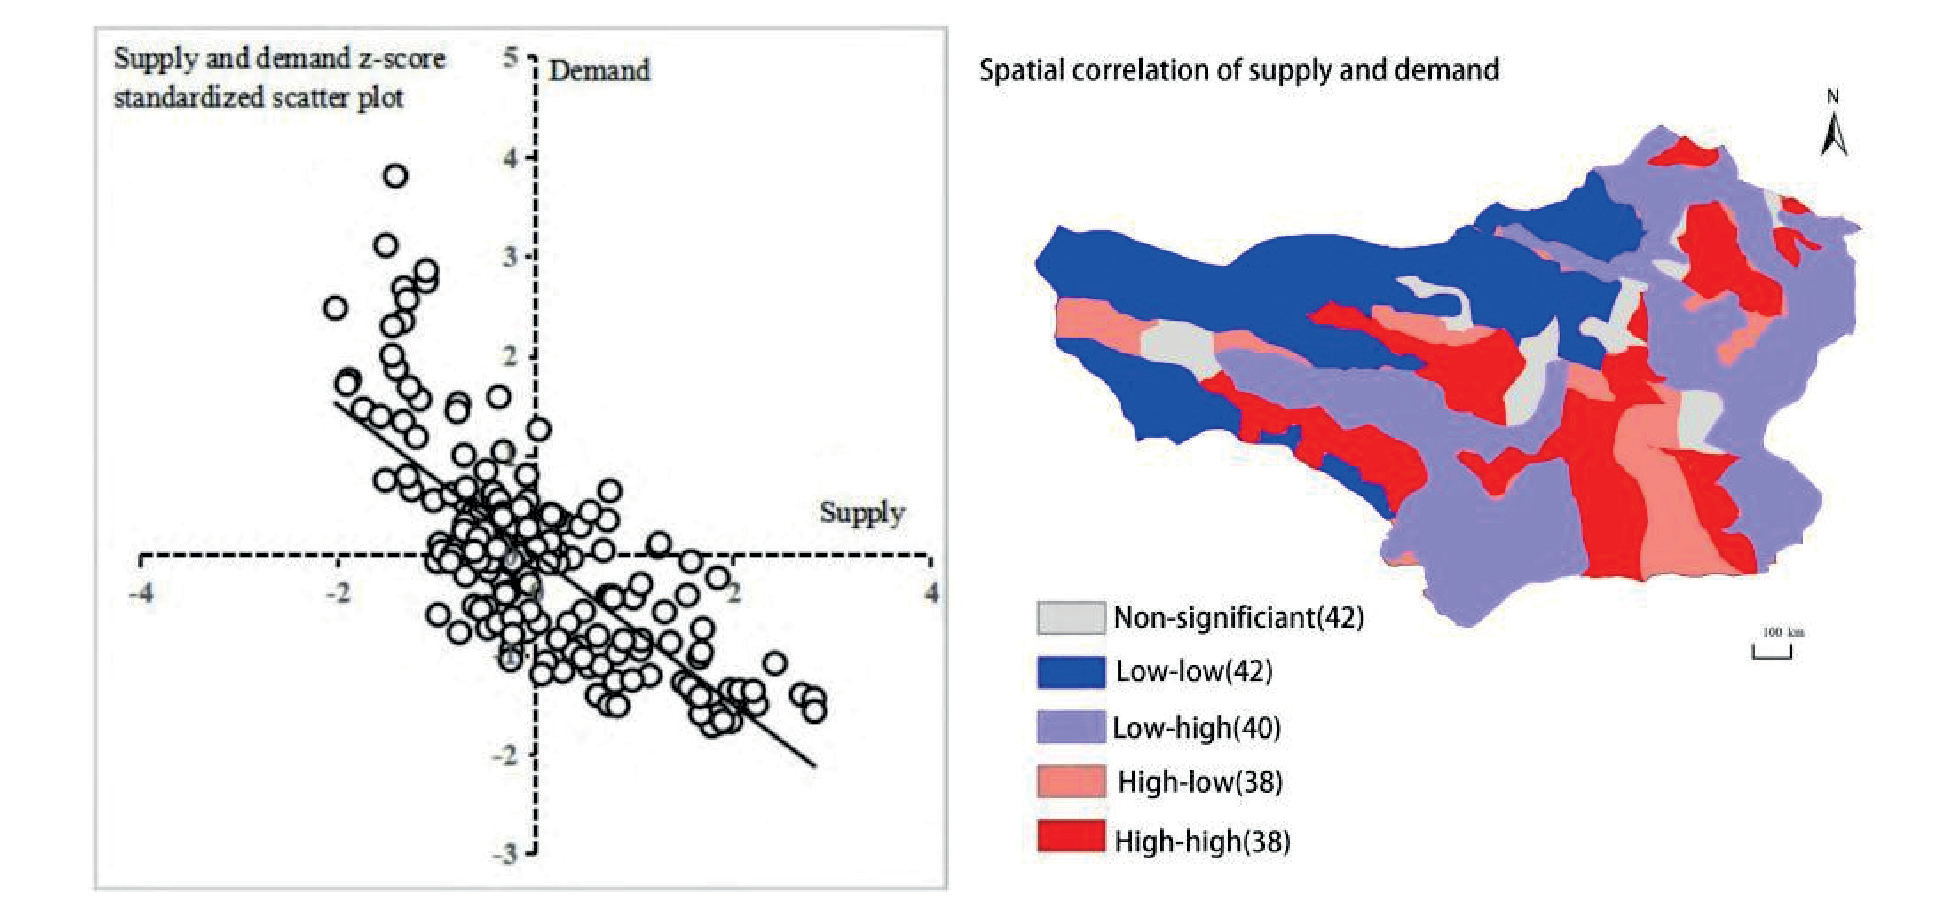
In Zagana, ecosystem service supply and demand matching fell into four patterns (Fig. 4): 1). High supply-demand (quadrant I, 42 points). 2). Low supply-high demand (quadrant II, 40 points). 3). Low supply-demand (quadrant III, 38 points). 4). High supply-low demand (quadrant IV, 38 points). Spatially, a negative correlation existed in the supply-demand relationship, with significant regional variations. To evaluate this correlation, we performed a bivariate local autocorrelation test, yielding a significance level exceeding 80%. This analysis identified 42 sample points as statistically insignificant.
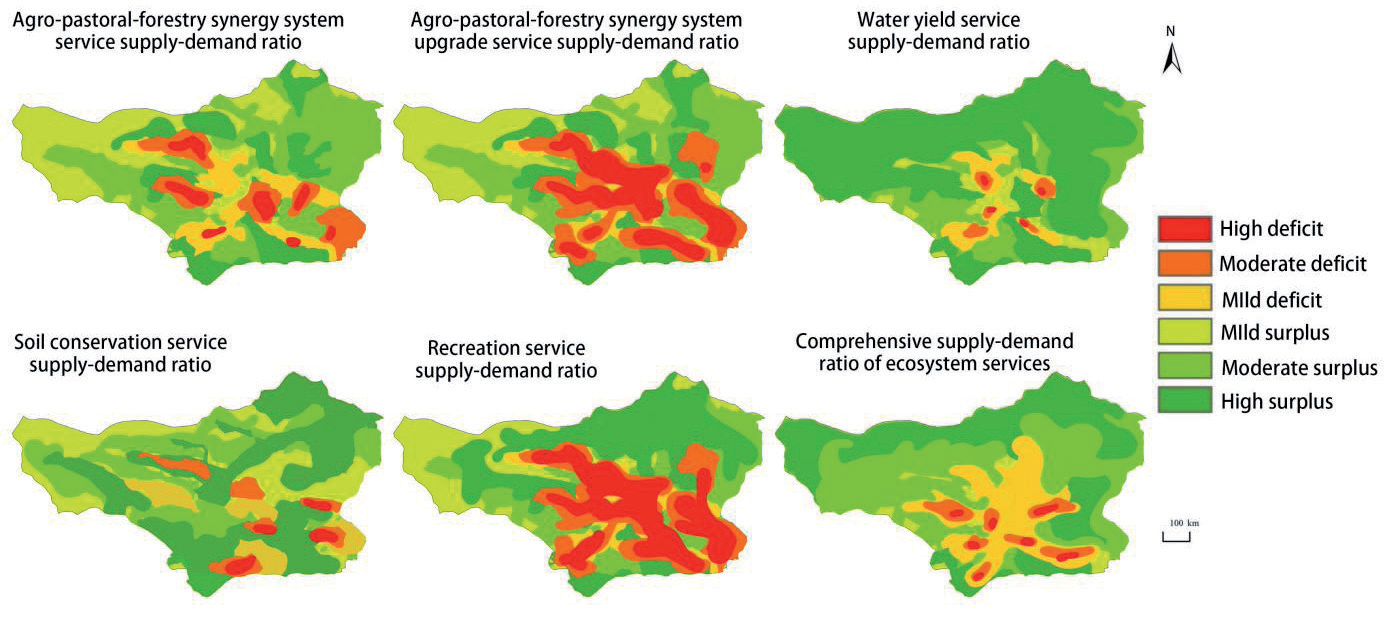
The ecosystem service supply-demand relationship was classified into six groups (Fig. 4): 1). High deficit (-1, -0.6). 2). Medium deficit (-0.60, -0.30). 3). Low deficit (-0.30, 0). 4). Low surplus (0, 0.30). 5). Medium surplus (0.30, 0.60). 6). High surplus (0.60, 1.00).
Spatial variations were evident in the supply and demand of the five ecosystem services. Deficit zones for agriculture-forestry-animal husbandry composite system provisioning services were mainly concentrated in the central built-up areas of villages and entrances to sites with more favorable landscapes. From these regions, mild to moderate deficits extended outward. Similarly, agriculture-forestry-animal husbandry composite system enhancement and recreation and leisure services exhibited unfavorable supply and demand dynamics, with high deficits prevalent in the western and northern regions of the Zagana district, particularly in high-altitude mountainous areas [42]. These areas suffer from limited forest and pasture areas, leading to reduced capacity for agriculture-forestry-animal husbandry composite system enhancement and recreational services. Conversely, deficit areas for water production services were identified in the central part of the Zagana region, characterized by high population density and increased water demand, resulting in a situation where demand surpasses supply. In contrast, high deficit zones for soil protection services were concentrated in the southeastern part of the county and the valleys of the Low altitude. Medium deficit areas were primarily situated in the central part of the county, while other areas mostly experienced medium-range supply and demand conditions (Fig. 5).
Analysis of the Level of Ecological Resilience in the Zagana District
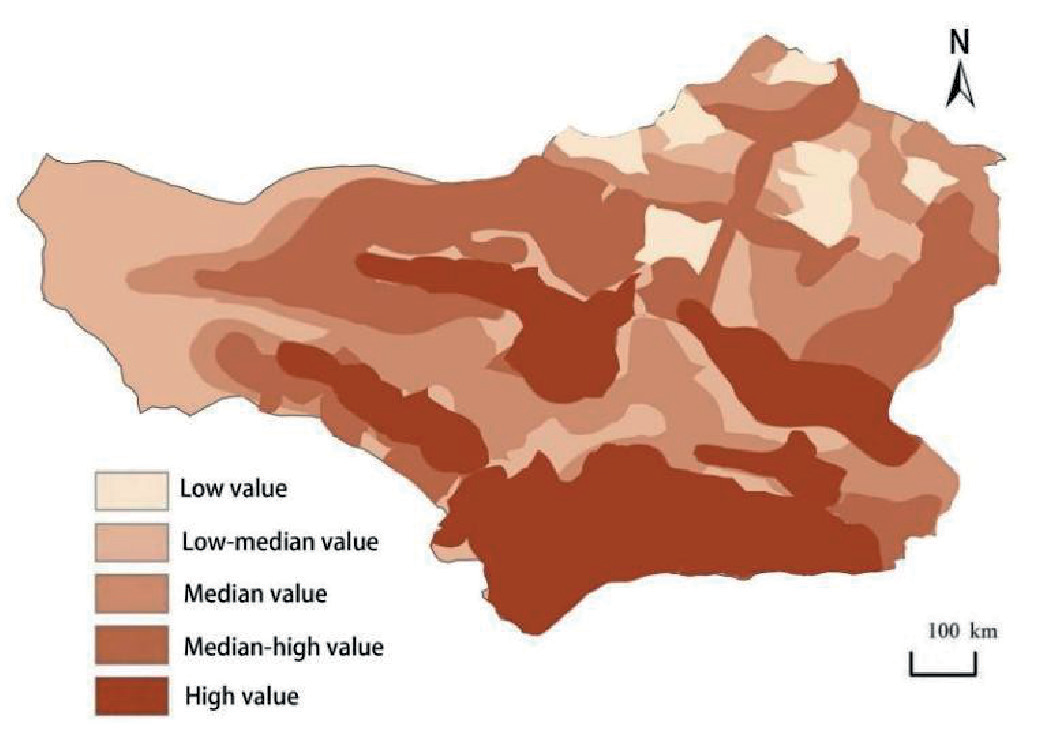
Ecological resilience across the entire Zagana district ranged from 0.44 to 0.75, displaying significant variations among villages. These disparities primarily stemmed from geographical and topographic conditions, as well as land use distribution. We classified ecological resilience into five levels using the natural breakpoint method (Fig. 6).
Areas with high resilience were predominantly located in the southwestern and central parts of the Zagana district. These regions feature low mountainous terrain, ample rainfall, and favorable soil conditions [43]. They boast a high landscape diversity index and ecological resilience, experiencing minimal human disturbance to the ecosystem.
Conversely, the northern part of the Zagana district consists of high-altitude mountainous terrain characterized by low precipitation, low temperatures, and predominantly sandy and gravelly soils [44]. As a result, this region exhibits a delicate ecology and low resilience.The distribution of resilience levels across the entire Zagana area, ranging from low to high, is as follows: 5.44% (low-value area), 11.23% (medium-low-value area), 32.02% (medium-value area), 17.40% (medium-high-value area), and 33.90% (high-value area). This emphasizes that nearly half of Zagana’s territory demonstrates excellent allocation of soil and water resources, yet there remains substantial room for enhancing overall resilience.
Zoning and Control of Ecological Restoration in Zagana District
The study utilized GeoDa software to perform bivariate local autocorrelation analysis, which allowed for preliminary zoning based on ecosystem service supply and demand as bivariate variables. This analysis clarified the spatial aggregation relationship between supply and demand levels in different districts and counties (Fig. 7), leading to the identification of supply and demand zones. These zones were then spatially overlaid with the results of the ecological resilience assessment, using ArcGIS software for the analysis. Ultimately, the study classified five types of ecological restoration zones based on the distinct characteristics of different regions within the study area.
I: high supply-high demand-high resilience; II: low supply-high demand-low resilience; III: low supply-low demand-low resilience; IV: high supply-low demand-high resilience. V: low supply-low demand-high resilience.
1) I The high supply-high demand-high resilience area, constituting approximately 33.68% of the total area, is situated in the southern and central parts of the site. This region encompasses low-lying valleys with fertile alluvial soil, benefiting from high rainfall and boasting a significant proportion of arable land (75.08%) leading to substantial food production. For this agricultural core area, a comprehensive ecological restoration plan should be developed, focusing on greening ditches and furrows, as well as enhancing agricultural fertility through the application of green and ecological fertilization methods instead of chemical fertilizers [45]. This approach will improve soil structure and strength. Notably, the services related to the complex system of agriculture, animal husbandry, and forestry, as well as water production, are predominantly in a deficit state. To address this, the establishment of additional farmland water conservancy projects, water conservancy forests, and farmland protection forests is recommended. These measures will enhance the water conservation capacity, promote the upgrading of the agriculture-forestry-animal husbandry composite system in farmland and its surroundings, and counteract ecological degradation caused by increasing pressures.
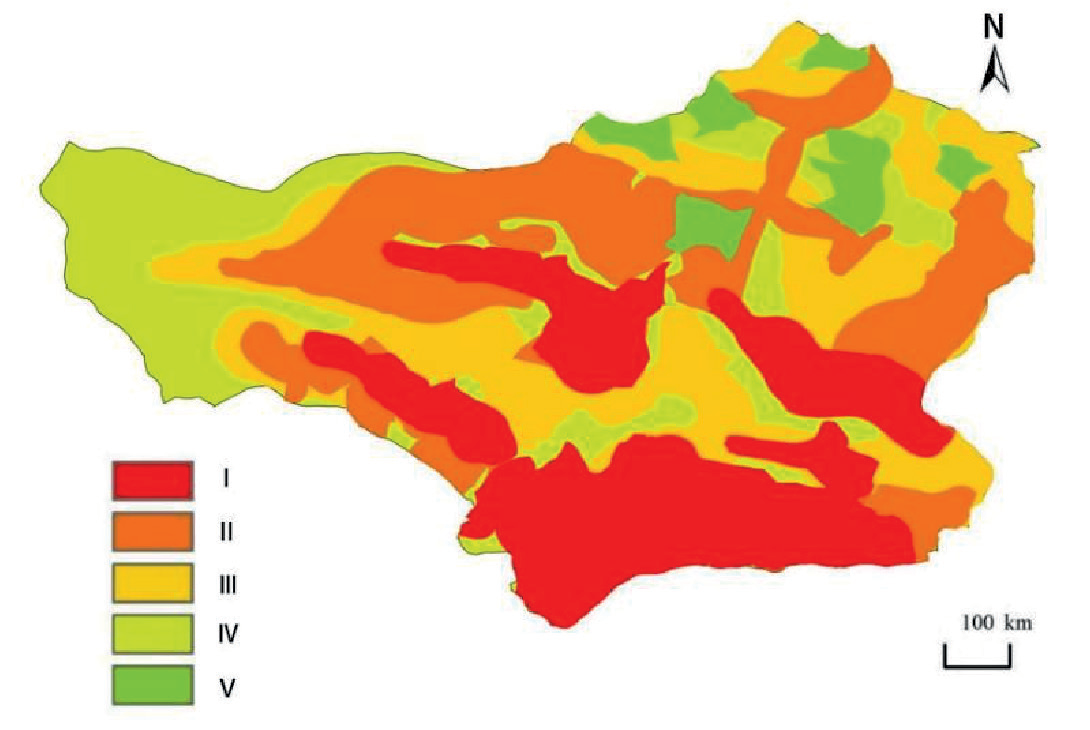
2) II The low-supply-high-demand-low-resilience region, constituting approximately 34.51% of the total area, is more numerous and dispersed. This region comprises high-altitude mountain peaks and areas with weak soil conservation capacity in low-altitude mountainous regions. In these areas, precipitation is low, and there are extensive forest and pastoral areas, resulting in low temperatures and limited water storage capacity for sandy and gravelly soils. Consequently, the supply of various ecosystem services falls short of regional demand, and the ecological landscape is singular, with limited natural resources, leading to challenges in forming ecological spatial connectivity. To address these issues, strict control over tourism development boundaries should be implemented, and ecological protection zones established to safeguard forest belts, enhance soil conditions, and improve rainwater storage. Prohibiting development and minimizing intervention will help maintain the ecological stability of the region [46]. These measures are crucial for strengthening the ecological resilience and sustainability of the area.
3) III The low-supply-high-demand-high-resilience area constitutes approximately 20.54% of the total area and is mostly scattered. This region includes high-altitude areas near the original glacier in the northern part and pastoral areas in the eastern and central parts of the four villages within Zagana district. It mainly comprises arable land and built-up areas, accounting for 62.25% and 29.95% of the area, respectively. Forest resources are scarce, and the only ecosystem service with a slight deficit is food supply. To facilitate ecological restoration in this area, adjustments to the food cultivation structure should be made to increase food production and optimize land use. Additionally, efforts should be directed towards strengthening the cultivation of ecological forests and plantation forests to conserve water and enhance carbon sinks. Establishing water source forests will further improve the ecological function of the region, leveraging its ecological advantages. Implementing these measures will enhance the resilience and ecological performance of the region [47].
4) IV The low-supply-low-demand-high-resilience area constitutes approximately 20.22% of the total area and is mainly located in a band in the western part of the site, with sporadic occurrences in the central part. This zone experiences lesser human disturbances and exhibits higher resilience. In the western part, there is a moderate surplus in the hilly areas and a slight surplus in the regions bordering the village and the high valley. Woodland and grassland cover about 56.64% of this zone. Ecological restoration efforts should prioritize reducing human interference and focus on protecting the area while considering local and ecologically favorable conditions. In remote mountainous regions with limited human exploration, conservation measures like sealing and cultivation should be undertaken. For flat mountain areas, reforestation and grassland replanting are recommended. On slopes exceeding 25°, converting appropriate fallow land back to forests and grasslands is advised. Additionally, comprehensive enhancement of the ecological capacity in various types of high-altitude mountain areas in the northern part of the country is essential. These restoration actions will contribute to maintaining the ecological balance and resilience of the region.
5) V The low-supply-low-demand-low-resilience area covers approximately 12.07% of the site and is mainly concentrated in the northern high mountain region. In this area, there is a medium to high deficit between supply and demand for ecosystem services. Human activity is scarce, and most ecosystem services are in surplus. However, due to low rainfall, high altitude, extensive forest and grassland areas interspersed with pasture and woodland, and predominantly sandy and gravelly soil, large-scale crop cultivation is unsuitable, resulting in low supply for food, water production, and carbon sequestration services. Additionally, the region’s ecological resilience is relatively low, influenced by its topography and climate. To enhance ecological resilience, ecological restoration efforts should involve adjusting the livestock management plan by prohibiting grazing and protecting native plants. It’s also important to adjust the ecological structure by retiring farmland and preserving existing forest and grassland areas. Implementing measures to reduce soil erosion, such as limiting soil soaking, will further contribute to the restoration process. These restoration strategies will help improve the overall ecological resilience of the region, considering its unique natural conditions and limitations [48].
Discussion
This study focuses on ecological restoration zoning in the Zagana region. It specifically addresses ecosystem service supply and demand, as well as ecological resilience within agro-forest-livestock composite systems [49]. The research explores the interplay between human social needs and natural resources, aiming to propose targeted and feasible ecological restoration measures for the Zagana region. In contrast to previous research that primarily examined ecosystem services within agro-pastoral-forestry systems, soil conservation measures, system enhancements, and water supply, this study includes an evaluation of recreational services within the assessment of ecosystem service supply and demand. While the ecological restoration area has been defined through an analysis of ecosystem service supply and demand, as well as ecological resilience, it lacks a comparative assessment with similar agroforestry-pastoral ecosystems [50]. This omission renders the division of ecosystem services non-comparable. Consequently, further investigation is required to validate this division [51].
Despite these limitations, empirical research reveals a slight surplus in agro-forestry-livestock composite ecosystem services in the Diebu Zagana area. This surplus is notably observed in the four densely populated villages, which concurrently experience a slight deficit, necessitating external support over an extended period. Preserving pristine forest ecosystems is essential for maintaining ecological balance and promoting tourism-driven economic growth in the Diebu Zagana area. Simultaneously, intensified community exchange activities facilitate the dissemination of agricultural knowledge, enriching the social and cultural assets of local families. Furthermore, ecological resilience assessments indicate that the four concentrated villages with slight deficits in ecosystem services exhibit greater ecological resilience [52]. This resilience can be attributed to various factors within agroforestry-pastoral composite ecosystems, including terrain, soil, vegetation, and landscape diversity, all contributing to mitigating ecological disturbances compared to single-provision ecosystems [53]. Additionally, ecological conservation policies are expected to encourage voluntary environmental protection by villagers and tourists, while physical interventions will minimize human impact on the natural environment. This research primarily focuses on agro-pastoral-forestry ecosystem systems demand and natural ecological resilience across different regions of Diebu Zagana. Building upon this research, the study integrates the characteristics of ecosystem service supply and demand with ecosystem resilience, facilitating ecological restoration and optimization in diverse regions. Utilizing a ratio model for supply and demand, along with the deficit and surplus status of five service categories in each region, provides clearer insights into the interplay of ecosystem services across various districts and counties. This aids in identifying and implementing optimal solutions based on the research findings [54].
Agro-pastoral-forestry systems facilitate service transfer within regional networks. The water production service encompasses both natural runoff and human-directed distribution. Additionally, these systems enhance services through atmospheric circulation and carbon conversion within each biosphere component, promoting inter-ecosystem communication, cooperation, and increased productivity [55]. Neglecting spatial flows between supply and demand during service assessment in this research may have affected the evaluation of ecosystem service provision. The rapid growth of tourism in Dibu Zagana has introduced foreign cultures, eroding the local culture. Therefore, it is essential to incorporate cultural protection indicators when assessing ecological resilience [56]. Future studies can adjust ecosystem service supply and demand by analyzing service flows. Considering demographics and preserving traditional culture could lead to a more accurate calculation of ecological resilience in the supply-demand relationship. Adopting this approach will enable more precise ecological restoration in the Zagana area [57].
Conclusions
This study focuses on the agriculture-forestry-animal husbandry composite system in the Zagana district, integrating data on land use, soil, meteorology, and other pertinent factors. Diverse models are employed to assess regional ecosystem service supply, demand, and their relationships. Additionally, it incorporates regional ecological resilience findings to delineate ecological restoration zones and propose optimization strategies [58]. The following conclusions were drawn:
1) Higher supply of the agriculture-forestry-animal husbandry composite system in the Zagana district primarily concentrates in the southern and central areas. High-value regions for agriculture-forestry-animal husbandry composite system enhancement, water production, and recreational services are primarily located in the central mountain range and the high plains in the northern part. Meanwhile, areas with a high supply of soil conservation services are clustered in the low mountain range and village farmland areas. The observed spatial heterogeneity in the supply and demand of ecosystem services can be attributed to the complex topographic conditions and variations in natural environmental endowment across different regions.
2) The relationship between ecosystem service supply and demand in Zagana can be categorized into four types: high supply - high demand, low supply - high demand, low supply - low demand, and high supply - low demand. These patterns highlight significant spatial imbalances. The study did not identify any areas with a surplus of ecosystem service supply and demand in Zagana, as the deficit area accounted for 42.26% of the total area. Most of the deficit area exhibited mild deficit conditions, indicating a lesser degree of deficit. The absence of a surplus area suggests ample room for improvement in the ecosystem service supply and demand situation [59-60].
3) The Zagana area is categorized into five ecological restoration sub-areas, each necessitating specific restoration strategies based on supply-demand relationships and natural resilience. I Region with high supply, high demand, and high resilience: Priorities in this area include agricultural water conservation projects, soil reinforcement, soil quality enhancement, and expanded afforestation to prevent ecological degradation. II Region with low supply, high demand, and low resilience: Addressing this area requires strict control over tourism development, the establishment of ecological reserves, protection of forested areas, soil quality improvement, and enhanced rainwater storage. Prohibiting further development and minimizing human intervention will help maintain ecological stability. III Region with low supply, high demand, and high resilience: Ecological restoration efforts should focus on adjusting food planting structures, increasing food production, and optimizing land use ratios. Additionally, enhancing ecological and plantation forest cultivation to conserve water and bolster carbon sinks will be beneficial. IV Region with low supply, low demand, and high resilience: To effectively restore this region, the primary emphasis should be on reducing human interference. Implementing protective measures and managing ecologically superior conditions based on local circumstances will be crucial. Remote mountain areas with minimal human activity should be designated as off-limits [61]. V Region with low supply, low demand, and low resilience: Ecological restoration initiatives in this area should involve adjustments to livestock management plans, prohibition of grazing, and protection of native plants. Furthermore, optimizing the ecological structure, fallowing, and preserving existing forests and grasslands will aid in mitigating land desertification and reducing soil erosion.

