

Introduction
The improvement of the ecological environment is closely related to the happiness of the people, is an important way to improve the level of social development, and is an inevitable requirement for building a modern socialist country [1]. In the past, the extensive economic growth model predominantly counted upon the resources mining to drive the economy and counted upon enterprises with high energy consumption, high pollution, and high emissions to drive economic growth. Although this extensive production has contributed to the advancement of China’s economy, the environment has also been vandalized. The development mode at the expense of the environment and regardless of the consequences has also given rise to a range of tensions in economic life, which has little by little made the problems of ecological environment vulnerability and insufficient environmental capacity become rocky problems that must be surmounted in China’s development process. In the report of the 20th National Congress of the Communist Party of China, Xi Jinping stressed that it is necessary to firmly establish and practice the concept that green waters and green mountains are golden mountains and silver mountains and to plan and develop from the perspective of harmonious coexistence between man and nature. Accelerate the green transformation of development methods and further promote the prevention and control of environmental pollution [2]. Under the guidance of this goal, the constraints of resource and environmental regulations require China’s economy to further transform into an intensive development mode, strike a mutual benefit between economic growth and environmental preservation, and improve environmental efficiency (EE) [3]. However, the current reality of China’s energy saving and emission reduction is not satisfactory, which is intuitively reflected in the long-term low environmental efficiency and stagnation [4].
China’s coastal provinces have played a very important supporting and leading role in national social and economic development, population employment, and other aspects by virtue of their unique location, shipping transportation, business environment, and other advantages [5]. In addition, coastal areas are sensitive areas of land-sea interaction and key areas with the fastest economic development, the greatest pressure on population and resources, and the most prominent contradiction between ecological supply and demand [6]. In addition, cities have a crucial role in leading and coordinating territorial economic development, but urban economic development will also put pressure on the resource demand of cities and surrounding areas, and the territorial ecological environment faces severe challenges [7]. The ecological foundation, resource natural endowment, and environmental carrying capacity of coastal areas are the guarantee of sustainable development for the economy and society. But because of the dense coastal population, it generates domestic sewage and industrial and agricultural wastewater, and a large amount of sewage is injected into the surrounding sea, which has a great impact on marine ecology. Based on this, it is important to study urban EE in coastal areas.
EE is a concrete tool for evaluating the degree of consistency between economic development and environmental protection. And since its introduction by Schaltegger and Sturm [8] in the 1990s, relevant research has continued to penetrate into various fields. In allusion to the definition of EE, it is prevailingly divided into two fields: one is the proportion of the total economic volume to its derived environmental load; the other is taking into account the ratio of input to output of exhaustive EE in the production process. The study of EE in this essay is in light of the latter. On balance, EE is economic efficiency when taking into account the consumption of resources and the environment. In light of the measurement of EE, it is also the minimization of resource and environmental depletion but also the maximization of economic output. In terms of research content, studies on EE have focused on three fields:
The first is the measurement of EE. The methods for weighing EE are mainly parametric and non-parametric methods, and the research objects are mostly centered on a region or an industry sector. One is stochastic frontier analysis [9-11], which is a well-developed method for measuring efficiency as a parameter and is extensively adopted in separate sectors. The second is the non-parametric method, namely Data Envelopment Analysis and its derivative models [12-16]. The second is the spatial-temporal evolution of EE [17-19] and the spatial difference [7, 20, 21]. There are spatial correlations and spatial heterogeneity in EE across regions or industries. The third is the analysis of the drivers of EE. As a comprehensive efficiency index that portrays economic efficiency and environmental pollution, environmental efficiency is closely related to diversified economic factors, such as economic level [22], technical advancement [23], and government policies [24, 25], industrial structure [26], and environmental regulation [27], which lead to regional differences in EE.
Many domestic scholars have studied EE in coastal areas at different scales, but most of them are at the level of province [28, 29] or urban agglomeration [30, 31], and there is a lack of literature that takes all cities in coastal areas as the research objects. Studies on EE in coastal areas also focus on marine EE, or marine ecological efficiency [32, 33]. For example, Du [34] found that the marine environment regulation measures promote the improvement of green total factor productivity of the marine economy, and there is a strong Porter hypothesis effect; Wang and Cheng [35] found that the marine environmental efficiency regulation in China showed a trend of fluctuation and decline, from relatively effective to relatively inefficient, and the efficiency difference between coastal provinces gradually expanded. In summary, there are still two deficiencies in the existing document research: firstly, there is a lack of analysis on the EE of all cities in coastal provinces and areas in the light of the research area; secondly, the research content is less concerned with the dissection of regional heterogeneity in EE in coastal areas.
On account of the above research status, the research adopts the SBM-DEA model to consider ideal output and unsatisfactory output in the output, estimate the EE of the cities on the coast from 2010 to 2020, and investigate the space-time evolution, convergence analysis, and regional heterogeneity analysis of EE in order to continue to boost EE in subsequent development in coastal areas, accelerate green transformation, and build a beautiful China.
The contributions of this essay principally incorporate: firstly, the existent research literature on EE in coastal areas is prevailingly bent on a certain province or city agglomeration, and the study of EE in coastal areas as a whole is chiefly bent on the provincial or regional level, and there are fewer studies on EE in coastal areas from the urban perspective. Secondly, the studies on EE in coastal areas are principally bent on marine aspects, and there are fewer studies on EE in coastal cities. Thirdly, the previous studies prevailingly probe into the EE of coastal areas from the perspective of the region as a whole, and the analysis on the heterogeneity of EE in coastal areas is not enough. This paper analyzes the inter-regional heterogeneity of coastal areas from the north, east, and south, which is of great significance for the coordinated development of the regional economy and environment. Fourth, this research concentrates on the coastal areas in light of their momentous status in China to provide pertinent policy insights for the region.
Methods
SBM-DEA Model
Because the traditional DEA model has some problems, such as radial bias and large measurement errors. In order to avoid this problem, the existing research mostly uses the SBM model to weigh EE. Tone [36] originally presented the SBM model in 2001. However, the original SBM model does not distinguish between ideal and undesirable outputs when measuring EE. Hence, Tone amended the SBM model in 2003, which has ideal and imperfect outputs. This essay adopts the SBM model to assess the EE of coastal cities from 2010-2020. The equation is as follows:
The p* presents the measure value of the urban EE, o means city, S means the relaxation variable of input and output, m is the amounts of input indicators, S1 and S2 are the amount of expected output and unexpected output indicators, and λ means the weight of the city. The p* larger it is, the higher the EE of the place in that year is, and the lower it is.
Stochastic Convergence
Stochastic convergence is a state of convergence that is shortly followed by the uninterrupted impact of one alternating quantity on another, which is a condition precedent for testing the β convergence. A unit root test is a random process problem. The unit root test is to test if the unit root is sequenced. If the root of unity is sequenced, the process will be unstable, and the false regression will last. On account of the study of Li [37] and Zhang [38], the calculation formula is as follows:
Where Rlnp*i,t means the comparative EE of city i in the duration t, that is derived by deducting the napierian logarithm of medical p* from the p* of each city, λ means the doubtless rate of convergence, and εi,t means the random error term independent of duration t and city i.
The σ Convergence
The σ convergence signifies that the decentralization of per capita income between different economic systems inclines to descend with the passage of time. This concept is closest to our intuitive understanding of convergence in reality, and it can provide more information about convergence. Research σ convergence is typically gauged in virtue of the logarithmic standard deviation of per capita income or output of a country or region [39]. The research adopts the σ coefficient to evaluate the dispersion of urban EE in coastal areas to determine whether there exists σ convergence. If there is convergence, the coefficient of EE will gradually decrease over time; otherwise, it means that σ divergent characteristics [40]. The σ test equation for convergence is:
Where σ is the coefficient, i means the city, N means the number of cities, p̅ * represents the mean value of EE, and Ln represents the logarithm.
Absolute β Convergence Test
The absolute β test equation for convergence is:
Where i means the city, t means the year, and pi,t* means the EE of city i in duration t,
Conditional β Convergence Test
The conditional β convergence model incorporates some control variables that have an impact on EE and are highly correlated in the light of the absolute β convergence model to enhance the stability of the estimation results. The formula is set as follows:
Where X means the control variable, δ means the coefficient of the control variable.
Index Selection
According to the super efficiency and non-expected output model, the calculation of EE primarily concerns three types of indicators: factor input, expected output, and non-expected output.
Factor input is essentially comprised of capital input, labor input, and energy consumption. The capital input is measured via the capital stock of each city. The capital stock is derived from the perpetual inventory method with reference to the research of Zhang [41]. Labor input is derived from the average total number of employed employees in each city; Energy consumption is measured by the sum of fuel consumption, natural gas consumption, and electricity consumption in each area [24]. Fuel consumption comprises crude oil, diesel oil, coke, kerosene, coal, and fuel oil. As the units of measurement of fuel, natural gas, and electricity are different, fuel consumption is derived from tons, natural gas consumption is derived from cubic meters, and electricity consumption is calculated in kilowatt hours. The research has standardized three types of energy consumption to eliminate the impact of different dimensions and then obtained the complete energy consumption of each city. In the aspect of expected output, the research uses the GDP of coastal cities from 2010-2020 to measure and adopts 2010 as the base period to deflate, so as to eliminate the impact of inflation. In the aspect of unexpected output, the research selects wastewater discharge to measure [42].
Data Source
The research adopts cities above prefecture level in coastal areas as the research object. The data of prefecture level administrative regions are more microscopic than the data of provincial level regions, and the number of samples is greater, which can reveal the EE of coastal areas and is more scientific. Among prefecture level cities, such as Sansha City in Hainan, which was established late, the data statistics are incomplete, and with the change of the Laiwu administrative region in Shandong, such special cities are excluded from this study. Ultimately, a sample of 113 cities was selected for the study due to the possibility of data availability. Based on the consistency of data statistics, the panel length selected in the research is 2010-2020, and the data adopted in the research are largely from the “China City Statistical Yearbook”, the “China Urban Construction Statistical Yearbook”, the statistical yearbooks of each province, and the statistical bulletins of each city. The lacking data are supplemented by the ARIMA model and the interpolation method. The map data comes from BIGEMAP.
Results and Discussion
Measurement of EE
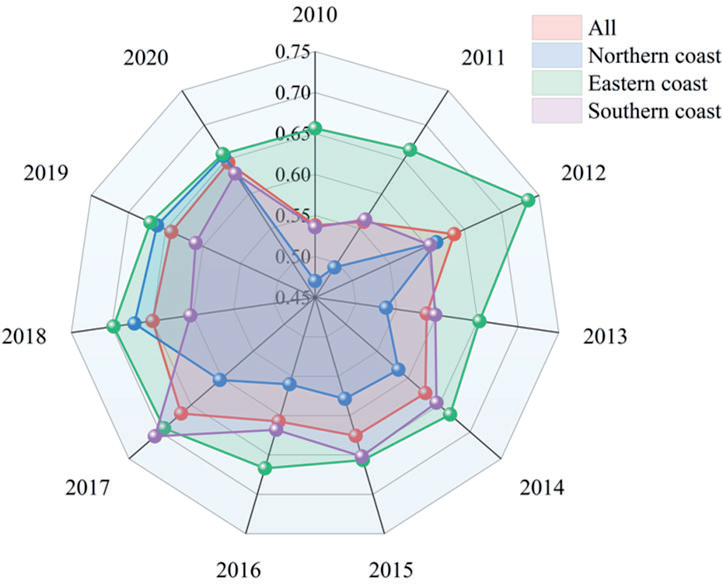
In the research, on the basis of the super-efficient non-desired output model, the EE index of each city in the coastal region from 2010-2020 was measured using MaxDEA software, and the evolutionary characteristics of EE were also examined from the time dimension. The detailed effects are depicted in Fig. 1. Firstly, the EE of coastal areas exhibited a significant escalating tendency, and the overall EE of coastal areas rose from 0.5380 in 2010 to 0.6456 in 2020, with an annual mean value of 0.6169 and an average annual change rate of 0.7173%, demonstrating a zigzag dynamic change trajectory, with the two lowest inflection points occurring in 2010 (0.5270) and 2015 (0.5420). Secondly, the EE at the regional level is essentially compatible with the overall tendency of the coastal region, and all EE shows a fluctuating escalating tendency, but the EE changes in the three regions show different change characteristics. Thirdly, from the point of view of the differences in regional EE changes, the northern region has the greatest change in EE, with the EE value rising from 0.4702 in 2010 to 0.6554 in 2020, which is lower than the average EE in coastal areas at the initial stage. The average of EE continues to keep rising and exceeding the average of EE in coastal areas with the development of time; the eastern area has little change in EE, which is leading the way in the coastal region. The variation of EE in the southern area is basically in accordance with the overall variation tendency of the coastal region in the early stage of the study, but fluctuates more at the end of the study.
Analysis of the Spatial Pattern Evolution of EE
Drawing on the experience of the study of Sun [43], the EE classes were classified as: high efficiency (p*≥0.8), middle efficiency (0.5≥p*>0.8), and poor efficiency (p*<0.5). Urban EE cross-sectional data for 2010, 2015, and 2020 were selected to map the spatial pattern of urban EE in coastal areas using ArcGIS software, as demonstrated in Fig. 2.
According to the evolution trend of environmental efficiency level, coastal cities with regional differences in environmental efficiency are divided into three intervals:
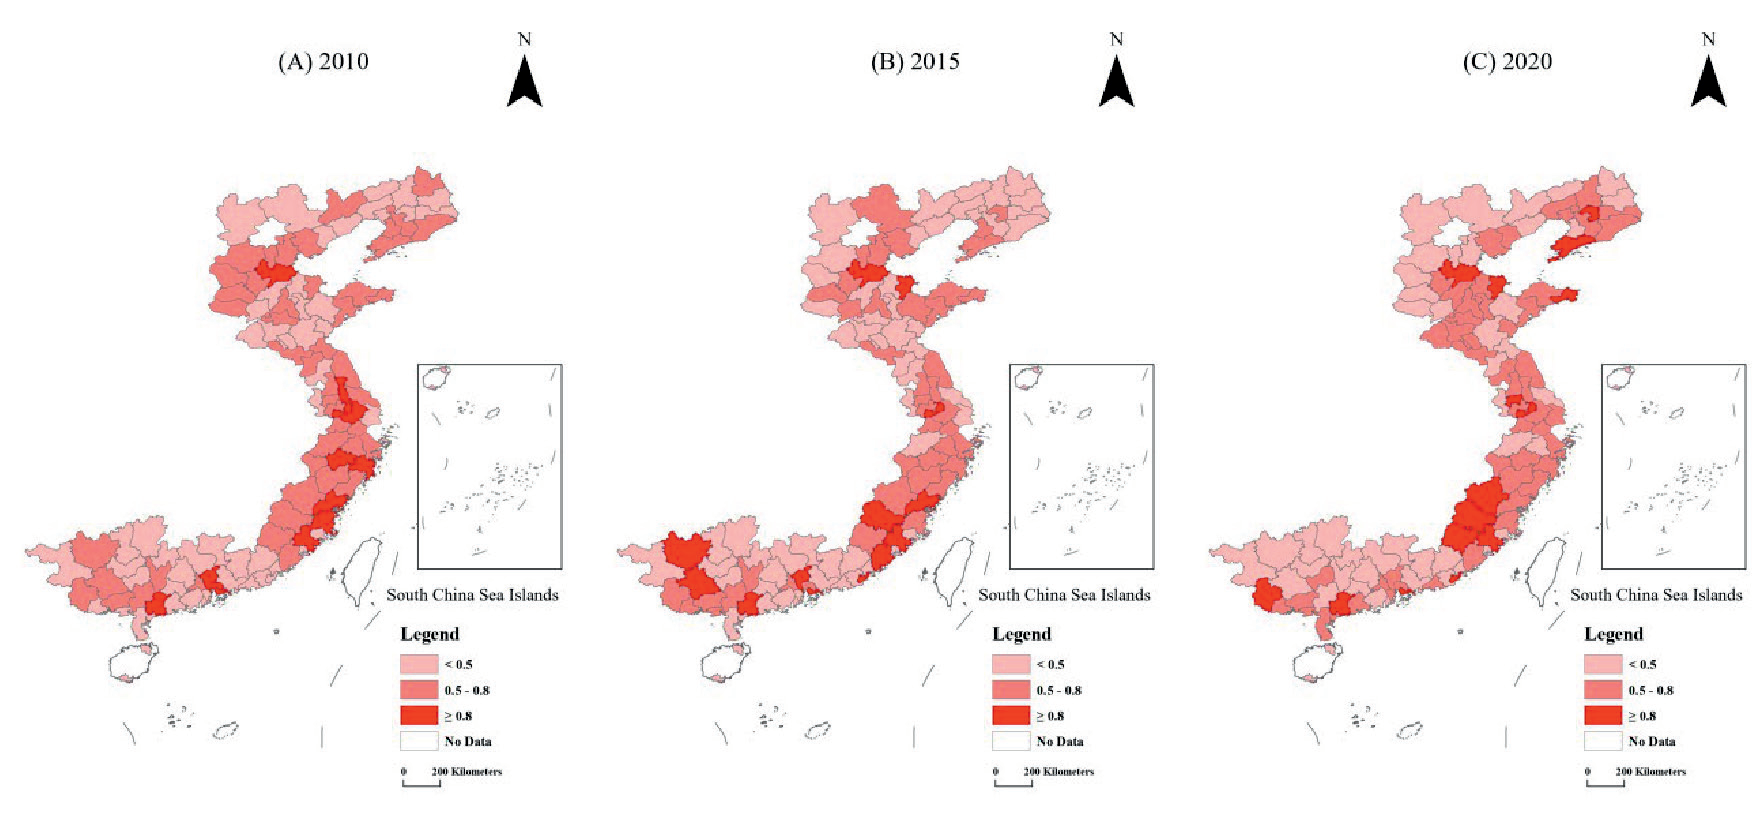
High efficiency zone. Including Cangzhou, Wuxi, Quanzhou, Shenzhen, and other cities that have been in the high-efficiency zone, Shantou City has transformed from low efficiency to high efficiency, and Dalian, Tangshan City, and Weihai City have transformed from medium efficiency to high efficiency. The above-mentioned cities changed their development paths earlier, advocated sustainable economic development, and while the rapid economic development was carried out, the control of pollution emissions was continuously strengthened, and the pace of transformation from traditional to green development accelerated, driving the environmental efficiency level of surrounding cities to improve together. Medium efficiency zone. Cities including Shenyang, Tianjin, Shijiazhuang, Nanjing, Shanghai, and Guilin all completed the transition from low to medium efficiency during the study period, while cities such as Handan, Jinan, and Ningbo were in the medium efficiency zone, and the efficiency level was increasing during the study period. During the research period, the environmental efficiency level of the above-mentioned cities has steadily increased, there is more room for improvement, and they adhere to ecological environmental protection in the process of economic development and are expected to enter the echelon of high efficiency in the future.
Poor efficiency zone. For example, Liuzhou City, Putian City, Xiamen City, Sanya City, and Haikou City fluctuated during the study period, but the efficiency level was always at a low level. These cities have a low level of economic development, unreasonable utilization of resources, the development of a resource-based economy, increasingly serious pollution problems, an unreasonable industrial structure, a backward technological level, lagging innovation and research and development levels, and a series of other problems that restrict the improvement of environmental efficiency in these cities.
As indicated in Fig. 2, from 2010-2020, the EE of most cities is at low and medium levels, while there are relatively few cities with high levels. In 2010, the EE of various regions was mainly at low and medium levels, with Dongguan having the highest EE value (1.8962) and Sanya having the lowest (0.1697), and the initial spatial characteristics of “high east and low north” had been formed. “In 2015, the EE of cities in different areas fluctuated and improved, and the EE of cities in the north and south augmented, and the number of areas with middle efficiency increased to 54. At the end of the study, in 2020, EE will have further improved. The number of areas in the medium and high-level groups of urban EE increased in 2010 and 2020; specifically, the total number of cities in which urban EE was the middle efficiency group in 2010 rose to 79 in 2020. The number of cities in the high-level group in 2010 was 13, while in 2020 the number of cities in the high-level group aggrandized from 13 in 2010 to 18 in 2020, and the number of areas in the poor-level group decreased from 63 in 2010 to 16 in 2020. In general, the EE of coastal areas has been elevating, and the spatial framework has basically formed a three-pole spatial distribution pattern of “Bohai Rim, Yangtze River Delta, and Pan-Pearl River Delta”, which is the result of cities’ efforts to balance economic development and environmental protection.
Unit Root Inspection
The unit root test can be an effective measure of stochastic convergence. With reference to the methodology of other scholars, multiple unit root tests were performed on panel data of EE in coastal cities and are shown in Table 1. The LLC test, IPS test, ADF-Fisher test, and PP-Fisher test were remarkable at the 1% level. But the final results of the Breitung t-stat test did not pass the significance test. Accordingly, there exists powerful information that there is subsequent convergence in EE from 2010-2020 and that the EE of the cities will recover to the average level as time goes on.
The σ Convergence Analysis
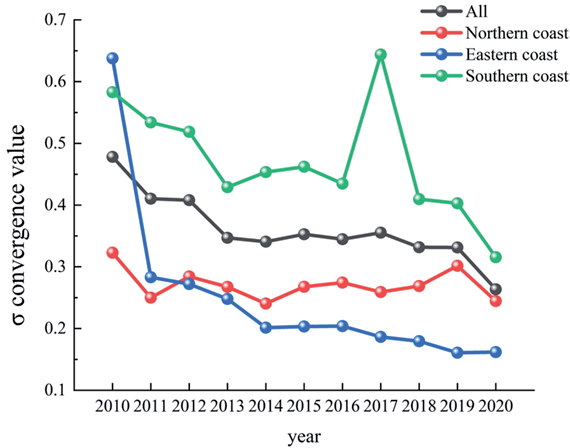
Fig. 3 reveals the successional tendency of σ convergence of EE in coastal cities. Overall, it seems that the σ convergence coefficient shows a fluctuating and decreasing change trend from 2010-2020 in general, and the σ convergence coefficient decreases from 0.4781 in 2010 to 0.2635 in 2020, with a decrease of 81.4%, indicating the existence of σ convergence characteristics of EE in coastal areas in this time period.
By region: (1) The σ convergence coefficient of EE in the north has been alternately “decreasing and increasing” during the period of study, and since 2015, the EE has exhibited a tendency of σ convergence, demonstrating that the regional green development level gap in the region has been shrinking in recent years. (2) The σ convergence coefficient of EE in the east displays a decreasing tendency of “rapid decrease - moderate decrease”, and the σ convergence coefficient in 2020 is 0.1618, which is 0.4759 lower than that in 2010, with a decrease of 74.63%. This signifies that there is a phenomenon of σ convergence, and the convergence phenomenon is relatively obvious; the gap in the EE level within the region is steadily decreasing. (3) The σ convergence coefficient of EE in the southern area manifests a distinct fluctuating downward tendency. The σ convergence coefficient in 2020 is 0.3154 and decreases by 0.46 times compared with 0.2675 in 2010, indicating the existence of σ convergence in EE.
Absolute β Convergence Analysis
Absolute β convergence tests were conducted for coastal cities as a whole and for the north, east, and south areas, and the final results are listed in Table 2. It is clear that the β convergence coefficients of EE in the region as a whole as well as in the northern, eastern, and southern areas are conspicuously negative, which implies that the coastal region as a whole and its three sub-regions are characterized by absolute β convergence. In other words, when the effects of regional heterogeneity drivers such as economic strength, energy consumption intensity, industrial structure, city extroversion, and government behavior are not considered, cities with relatively low EE levels in the coastal region will have a faster development rate than those with high EE levels, thus contributing to the gradual narrowing of the EE gap among cities, and the EE levels of cities will gradually converge to an identical stable status with the passage of time. The convergence rates of EE in the northern, eastern, and southern regions are 0.0321, 0.0725, and 0.0889, with an overall distribution of “southern region>eastern region>northern region”. This may be because the southern coastal region occupies an essential status in China’s economic growth, but the development in the region is unbalanced, and some areas have a large development gap with other cities. The industrial structure is unsatisfactory, and the scientific and technological level is poor, so there is greater development potential. The northern coastal region has a strong foundation of economic development, developed science and technology, and plays a crucial role in opening up northern China to the outside world.
Conditional β Analysis
The conditional β convergence model is in the light of the absolute β convergence model by incorporating some control variables that have an impact on EE and are highly correlated, so as to boost the precision of the estimation results. In light of the above-mentioned complex spatial-temporal evolutionary distinctions of EE, the research examines its formation mechanism from many aspects, such as economic and social development factors and administration management. On referring to relevant research literature, the EE estimated in the previous paper is adopted as the variable being explained, and the explanatory variables mainly include economic development level, energy intensity, industrial structure, city extroversion, governmental behavior, etc. [44-48]. The variable settings are shown in Table 3. Table 4 presents the conditional β-convergence results for the EE of the coastal region in general and its three subregions. The search results exhibit that after considering various elements contributing to different steady states, the EE among cities still shows remarkable signs of conditional convergence, indicating that no matter whether the model considers regional dummy variables or not and whether relevant control factors are introduced or not, there is indeed a tendency of conditional convergence in the urban ecological environment measured by EE since 2010, and the results have strong robustness. From the results, the β convergence coefficients of coastal cities in general and their northern, central, and southern regions are all significantly smaller than 0 at the 1% level, which signifies the existence of a remarkable conditional β convergence characteristic of their EE, which also implies that the EE of coastal cities and cities in three regions is developing toward their respective steady-state levels after taking into account a series of possible regional heterogeneity drivers. In terms of convergence speed, the northern, eastern, and southern regions are 0.0458, 0.0733, and 0.0446, respectively. The eastern region has the fastest convergence speed, followed by the northern region, and the southern region has the slowest convergence speed, which indicates that the corresponding convergence speed will change to different degrees when each regional heterogeneity factor is taken into account. Obviously, the convergence speed of coastal cities in general and the north and central regions is significantly improved, except for the southern region, where the convergence speed is reduced compared to the absolute β convergence analysis.
Table 2.
Absolute β convergence of environmental efficiency in coastal areas.
Table 3.
Variable Setting of the Variable Coefficient Model.
From Table 4, it is easy to find that there are distinct differences in the factors influencing the convergence of EE of coastal cities and their three sub-regions. From the coastal region as a whole, except for the industrial structure, the other four factors have different degrees of remarkable effects on the EE of the region. It indicates that, from the coastal region as a whole, the industrial structure cannot contribute to the promotion of EE. Among them, the estimated coefficients of economic development level and governmental behavior control variables are conspicuously positive at the 1% level, illustrating that although these two factors are beneficial to foster the steady elevation of regional EE, they have some inhibitory effect on narrowing the regional EE gap; undoubtedly, this is closely related to China’s in-depth implementation of the basic national conditional of high-quality development, and the conventional crude form of development has been improved. Energy intensity and openness to the outside world, on the other hand, have remarkable negative effects on the improvement of EE in the region, indicating that these two drivers will prevent the convergence of EE in the region to a higher steady-state level. This indicates that China’s coastal areas still face the development risk of being a “pollution paradise”, and some areas have become the acceptance sites of foreign high-pollution industries.
By region: (1) The significantly positive impact of the economic development level and government behavior in the northern region on the advance of regional EE, indicating that two factors will hinder the narrowing of the gap between urban and urban EE in the region and will contribute to the convergence of EE in the northern region towards high values; In addition, both energy intensity and city extroversion have a negative effect on the exaltation of EE, which will promote the convergence of EE in the region; the industrial structure has no remarkable effect on EE.
(2) For the eastern region, the effect of the two factors, which are city extroversion and government behavior, on the EE failed to meet the test of significance. The economic development level will conspicuously promote the improvement of EE, but it is not conducive to narrowing the gap in EE among cities in the region; the estimated coefficients of energy intensity and industrial structure are significantly negative, indicating that these two factors will facilitate the convergence of EE.
Table 4.
Conditional β convergence of environmental efficiency in coastal areas.
(3) For the southern region, except for the industrial structure, the other four factors play a remarkable role in the EE to varying degrees. Among them, the estimated coefficients of economic development level and government action control variables are remarkably positive at the level of 1%, implying that although these drivers can facilitate the steady improvement of the EE, they have a certain inhibitory effect on narrowing the regional EE gap. However, energy intensity and city extroversion have a remarkable negative effect on the exaltation of regional EE, implying that these two factors will prevent the EE from converging to a higher steady state level.
Discussion
In order to better promote urban environmental governance and improve urban EE, we should start in three ways: First, the EE of cities in coastal areas varies broadly; although the EE differences are narrowing, the middle and poor efficiency areas such as Shenyang, Liuzhou, and Haikou should accelerate the transformation of the traditional economic development model, combine local development advantages, develop supporting measures to fill the shortcomings, and local administrations should strengthen control of pollution emissions and improve urban ecological investment. The administration ought to adjust the investment structure of environmental governance and increase the responsibility of local administrations in urban environmental governance efficiency in order to obtain urban EE promotion, so as to shrink the differences and achieve balanced development. Second, environmental governance should play a regional linkage role and formulate EE governance programs that are consistent with the overall regional situation in high-efficiency areas such as Shenzhen, Dalian, and Weihai playing a leading role, and medium and poor-efficiency areas are taking the initiative to actively exchange governance experiences and technologies with neighboring high-efficiency areas to bring into play the “trickle-down effect” so as to narrow the EE differences between regions. Third, in view of the heterogeneity of the roles of various drivers in urban EE, we should increase investment in scientific research, introduce high-level talents and technologies, avoid blindly imitating foreign technologies, and improve the ability of independent innovation. Industrial transformation and upgrading ought to be continuously promoted, the industrial structure should be advanced, and new technology-based and energy-clean industries should be vigorously developed. In the meantime, we should increase environmental regulation and control pollution emissions from both the source and the emission of environmental pollution.
Conclusions
In the research, the SBM-DEA model, in light of non-expected output, is used to reckon the urban EE values in coastal areas from 2010-2020, and the ARCGIS software is used to select the urban EE data in 2010, 2015, and 2020 to draw the spatial pattern of urban EE in coastal areas. The convergence analysis method is used to study the convergence and drivers of urban EE in coastal areas from 2010-2020. Some main conclusions can be obtained.
(1) The overall level of urban EE in coastal areas shows a gentle escalating tendency, and the EE in three regions displays a fluctuating escalating tendency is fundamentally the same as the overall evolution tendency of coastal areas, and the spatial differences of urban EE are large, but the spatial differences of EE are shrinking. From 2010 to 2020, most cities in coastal areas had low or medium levels of environmental efficiency, while relatively few cities had high levels. The environmental efficiency of coastal areas across the country has continued to improve, and the spatial pattern of environmental efficiency has basically formed a three-pole spatial distribution pattern of “Bohai Rim, Yangtze River Delta, and Pan-Pearl River Delta”.
(2) The evolutionary trends of EE differences in the coastal region as a whole, the north, the east, and the south, are all characterized by σ convergence. In addition, the EE of the region as a whole, the northern, the eastern, and the southern regions are characterized by absolute β convergence and conditional β convergence.
(3) As for the results of the analysis of the factors influencing the overall urban EE, the economic development level and governmental behavior have a positive contribution to urban environmental management efficiency, while energy intensity and city extroversion have a negative impeding effect. By region, the economic development level and governmental behavior in the northern and southern regions are instrumental in the steady exaltation of EE, while energy intensity and city extroversion have remarkable negative effects on the improvement of EE. For the eastern region, the economic development level positively promotes the improvement of EE, while energy intensity and industrial structure negatively hinder it.

