

Introduction
Shandong Province is a region with a significant population and abundant resources, and its economic development has consistently been at the forefront. Over the years, its Gross Domestic Product (GDP) has shown remarkable growth. However, during this development process, Shandong Province has heavily relied on its resources and energy, resulting in the excessive consumption of these resources. The prevailing economic development model in the region has been characterized by “high input, high emissions, low productivity, and high consumption”.
This regional scenario is not unique to Shandong but reflects broader trends in China and globally. In the context of China, rapid economic development often accompanies resource-intensive practices, resulting in environmental degradation and sustainability challenges [1]. To address these issues, national initiatives in China, such as the Belt and Road Initiative and commitments to carbon neutrality, emphasize the importance of transitioning to more sustainable and green development.
Environmental degradation poses a threat to the sustainable development of the international community, garnering increased attention on topics related to sustainable development and green economy [2]. The global community, including international organizations and countries worldwide, is increasingly recognizing the importance of balancing economic prosperity with environmental considerations. Initiatives like the United Nations Sustainable Development Goals underscore the global commitment to addressing environmental challenges while promoting economic growth.
Considering this broader context, the efforts outlined in the “Three-Year Action Plan for the Construction of Green, Low-Carbon, and High-Quality Development Pioneer Area in Shandong Province (2023-2025)” align with the national and international trends towards green and sustainable development. Therefore, analyzing the green economic efficiency of cities in Shandong Province is of significant importance.
Green economic efficiency pertains to the capacity to attain output efficiency while considering the impact on environmental pollution. Other related concepts include environmental efficiency [3, 4], total-factor efficiency [5], total-factor energy efficiency [6, 7], and total-factor carbon emission efficiency [8]. These concepts represent the ability to comprehensively consider multiple production factors within an economic production system, to aim to enhance economic output and curtail environmental costs while maintaining consistent input conditions, ultimately serving as a testament to the efficiency and caliber of green economic development [9]. In the realm of measurement methods, researchers typically employ parametric and non-parametric approaches. Early studies leaned towards parametric methods [10], with Stochastic Frontier Analysis (SFA) being a representative method [11]. SFA is based on known production functions and introduces stochastic factors to explain output efficiency. Recent research has increasingly favored non-parametric methods, primarily utilizing Data Envelopment Analysis (DEA) and related models [12, 13]. These models are based on linear programming and do not require the estimation of model parameters, aligning well with China’s practical context. However, using DEA for efficiency evaluation may encounter issues like slack variables, inter-temporal comparisons, and comparisons of efficiency for decision-making units. Hence, the choice of an appropriate DEA measurement method is crucial. Concerning influencing factors, researchers predominantly employ models like the Tobit model [14] and spatial econometric model [15] to investigate factors such as industrial structure [2] environmental regulation [16], and industrial agglomeration [17, 18] in their impact on green economic efficiency. Regarding the spatial-temporal evolution pattern of green economic efficiency, scholars commonly employ exploratory spatial data analysis [19], kernel density estimation [20], Theil index [21], Dagum Gini coefficient [22], and other methods to explore the dynamic distribution and regional disparities.
Despite the abundance of research on green economic efficiency, there remain areas for further exploration. Firstly, in the process of constructing the indicator system, considering that Shandong Province is one of China’s economically developed provinces with several significant economic and industrial centers, as well as being a major agricultural province involving the use of farmland and agricultural resources, economic development in cities is often accompanied by environmental pressures. To align with the current demand for green sustainable development, this study incorporates the impact of environmental pollution into the consideration of undesirable outputs in constructing the indicator system to ensure more accurate evaluation results. Secondly, in the analysis of the influencing factors of green economic efficiency, many scholars tend to focus on individual factors, such as environmental regulatory factors and industrial structure factors. In contrast, this paper comprehensively analyzes various internal and external influencing factors, aiming for a more comprehensive understanding. Finally, studies on this topic typically span national, urban clusters, inter-provincial, and river basin levels. Focusing on intra-provincial urban clusters as the research area is beneficial for the exchange and sharing of policies and practices among cities, as cities within the same province usually share similar geographical, social, and economic conditions, as well as comparable legal regulations and government management systems.
This study aims to comprehensively investigate the spatial-temporal evolution trends and influencing factors of green economic efficiency in various cities of Shandong Province. By analyzing panel data from 2011 to 2020 across 16 prefecture-level cities, we will employ a super-efficiency model with undesirable outputs to focus on the temporal changes in green economic efficiency over the past decade, providing a more comprehensive understanding of its overall trends. Simultaneously, we will utilize spatial autocorrelation methods to examine the spatial distribution among different cities, observing whether there is a geographical clustering phenomenon in green economic efficiency. Additionally, a Tobit model will be applied for an in-depth investigation into various factors influencing green economic efficiency. Through these comprehensive analyses, our goal is to offer substantive insights into the future development of green economic efficiency in cities across Shandong Province and provide scientific support for relevant policy formulation.
Methods
Super-Efficiency SBM Model with Undesirable Outputs
The conventional DEA model neglects the presence of input and output slackness, which can lead to inaccurate efficiency measurements and result in biases [23]. Subsequently, Tone proposed an SBM model based on input and output slackness, which, however, may yield multiple decision units with efficiency scores of 1 in efficiency assessments [24]. To address this issue, Tone further modified the SBM model to account for undesirable outputs [25]. The calculation formula is as follows:
(1)
In this context, θ* denotes the desired efficiency target for decision-making units (DMUs), while h, q, and m signify the counts of undesirable outputs, desirable outputs, and inputs, respectively, xiot, yrot, and bkot represent the specific elements within these categories at time point t, concurrently, while si–, sr+ and sk– stand for the slack variables related to them.
Natural Breaks Method
The natural breaks method is an analytic approach used for categorizing and distinguishing research objects based on numerical distribution patterns [26]. This method aims to identify natural breakpoints within the data to create more informative categories. By using the natural breaks method, it becomes possible to illustrate spatial variations and differences in geographic data more clearly. Therefore, we apply the natural breaks method in ArcGIS to classify the green economic efficiency of 16 cities in Shandong Province for the years 2011 to 2020 into different levels. This approach enhances our understanding of the data’s distribution characteristics.
Spatial Autocorrelation Analysis
Numerous studies have indicated the presence of spatial correlations in green economic efficiency [27-29]. As green development deepens, the spatial interactions among cities have been gradually intensifying. These interactions can be achieved not only through spatial interactions based on geographical proximity and distance between neighboring regions but also through the spatial spillover effects generated by economic activities in surrounding areas. Using spatial weight matrices that solely encompass individual geographical and economic data often fails to accurately measure the attributes of these emerging spatial phenomena. Therefore, we draw inspiration from relevant literature [30] and take into account the roles of geographical distance and economic connections, constructing an economic-geographical spatial weighting matrix. Furthermore, we employ global autocorrelation to investigate the spatial relationships in green economic efficiency among cities within Shandong Province. The formula for global autocorrelation is as follows:
Where n signifies the count of each city, Xi and Xj signify the efficiency values of spatial location i, j x̅ signifies the mean of the efficiency, wij and S2 signifies the spatial weight matrix and variance, and the Z value is used to assess spatial autocorrelation significance, VAR(I) and E(I) denote the variance and expected value of Moran'sI, respectively. Further analyzing the correlation between a specific city and its neighboring cities, based on clustering categories, can be divided into High-High clustering (H-H), High-Low clustering (H-L), Low-High clustering (L-H), and Low-Low clustering (L-L). The calculation formula is as follows:
Tobit Model
The super-efficiency SBM model, which considers undesirable outputs, is impacted by both input and output indicators and external factors. we employ a Tobit regression model and utilize the maximum likelihood estimation method to estimate parameters, as shown in the following formula:
Where the dependent variable Yit represents the green economic efficiency value for the i-th city in the t-th year, with a0 as the constant term, and βT, xit, and εit representing the regression coefficient, independent variables, and random disturbance terms, respectively.
Variable Selection and Data Source
Green Economic Efficiency Indicators
We use the super-efficiency SBM model with undesirable outputs to evaluate cities’ green economic efficiency. Below are explanations of each indicator:
(1) Input Indicators
When considering the cities’ green economic efficiency, we select the primary input indicators, capital, labor, and energy, drawing upon prior studies on related topics and data accessibility.
Capital Input Indicators (K): Typically, scholars use the total fixed asset investment amount as a measure of capital input. However, considering data availability and scientific considerations, in this study, we chose the total foreign direct investment as the capital input indicator. This study contends that foreign direct investment (FDI) typically involves the introduction of new technologies and management practices, directly promoting environmentally sustainable production. In contrast, fixed asset investment primarily focuses on the acquisition of infrastructure and equipment, potentially lacking a comprehensive reflection of eco-friendly investments.
Labor Input Indicators (L): Labor is considered the foundation of social development, as human societies rely on labor to sustain life and promote development, hence, it is quantified by the “number of employed individuals at the year’s end” [9, 31].
Energy Input Indicators (E): Given the scarcity of energy resources, it is essential to promote energy conservation and efficient utilization. Therefore, we select the “total social electricity consumption” [31, 32] for the whole society as the energy input indicator.
(2) Desired Output Indicators
The desired output refers to the output that is expected to be achieved through the inputs. Within our research, we select “GDP” [9] as the desired output indicator to comprehensively reflect the actual economic development in the region.
(3) Undesirable output Indicators
Economic and social development processes are often accompanied by environmental pollution. We define factors that are unfavorable to the environment as non-desirable outputs. In this research, we select the “total volume of industrial solid waste produced” and the “industrial volume of wastewater discharged” [9] as undesirable output indicators.
The above indicators are sourced from the “China City Statistical Yearbook”, the “Shandong Statistical Yearbook”, and the corresponding statistical yearbooks of each city. The descriptive statistical analysis of the relevant variables is presented in Table 1.
Table 1.
Green Economy Efficiency Evaluation Index System.
Green Economic Efficiency Impact Factor Indicators
Following the computation of cities’ green economic efficiency, a subsequent step involves probing the determinants impacting this performance. Therefore, by referencing relevant literature and considering data availability, we select the following indicators:
(1) Economic Development (ED)
Represented by “per capita GDP” [14, 33], which measures the economic output per person.
(2) Urbanization Level (UL)
Indicated by the “ratio of permanent urban population to permanent urban population” [33], which reflects the percentage of the population residing in urban areas.
(3) Industrial Structure (IS)
Represented by the “proportion of value added in the third industry to the second industry” [34], this metric illustrates the tertiary sector’s contribution to the overall industrial framework.
(4) Technological Advancement (TA)
Measured using the “number of granted patents” [31], which indicates the innovation and technological development in the region.
(5) Environmental Regulation (ER)
Represented by “sewage treatment volume”, serving as a surrogate variable reflecting the degree of Environmental management and wastewater handling.
(6) Social Security (SS)
Reflecting the level of social welfare and healthcare infrastructure using the “number of healthcare institutions”.
The above indicators are sourced from the “China City Statistical Yearbook”, the “Shandong Statistical Yearbook”, and the corresponding statistical yearbooks of each city. The descriptive statistical analysis of the relevant variables is presented in Table 2.
Result Analysis
Analysis of the Temporal Evolution Characteristics of Cities’ Green Economic Efficiency
Drawing specific conclusions based on the measurement results obtained from the super-efficiency SBM model with undesirable outputs, as presented in Table 3.
Overall, there has been a fluctuating upward trend in the green economic efficiency of various cities since 2011, signifying year-by-year improvements, though some less developed cities still have potential for enhancement.
Considerable variations exist in green economic efficiency among the 16 cities. Specifically, cities like Qingdao, Jinan, Tai’an, Heze, Dongying, and Dezhou exhibit relatively high green economic efficiency, with efficiency values exceeding 0.67. Conversely, cities like Jining, Zaozhuang, Binzhou, and Rizhao have relatively lower green economic efficiency, with values below 0.45. This suggests that cities such as Binzhou and Rizhao face imbalances between environmental conservation and economic growth, and there is potential for enhancing their efficiency.
Analysis of Spatial Differentiation Characteristics of Cities’ Green Economic Efficiency
We utilize the natural breaks method in ArcGIS to categorize green economic efficiency into five tiers: low efficiency, medium-low efficiency, medium efficiency, medium-high efficiency, and high efficiency, as depicted in Fig. 1. The detailed analysis is as follows:
In 2011, there were a total of 4 cities in the high-efficiency and medium-high-efficiency category. Among them, Tai’an and Heze showed a scattered distribution, while Binzhou and Dongying displayed a clustering pattern. Meanwhile, there were 6 cities in the low-efficiency and medium-low-efficiency category. Notably, Jining and Zaozhuang, as well as Zibo and Weifang, formed concentrated clusters, whereas Liaocheng and Rizhao exhibited a scattered distribution. By 2014, the count of cities in the high-efficiency and medium-high-efficiency category rose to 7. Except for Jinan and Tai’an, which had an aggregated distribution, the other cities showed a dispersed pattern. The category of low efficiency and medium-low efficiency still included 6 cities, accounting for 37.5% of all research units. These cities were mainly concentrated in areas like Jining, Rizhao, Binzhou, and Zaozhuang, forming relatively centralized distribution patterns. In 2017, the count of high-efficiency and medium-high-efficiency cities was reduced to 6, with most of them concentrated in western areas such as Jinan and Dezhou. Meanwhile, the category of low efficiency and medium-low efficiency still included 6 cities, primarily exhibiting a block-like distribution. By 2020, the count of high-efficiency and medium-high-efficiency cities increased again to 7, with a concentration mainly in eastern coastal regions and around provincial capitals. Conversely, there were 8 cities in the low-efficiency and medium-low-efficiency categories, primarily forming block-like distribution patterns in most of the central regions.
Table 2.
Green Economic Efficiency Influencing Factors Indicators.
Table 3.
Green Economic Efficiency Calculation Results.
In this period, Dongying and Heze transitioned from medium-high-efficiency cities to high-efficiency cities, while Weihai and Dezhou moved from a medium-efficiency city to a medium-high-efficiency city. Additionally, Qingdao, Yantai, and Jinan progressed from medium-efficiency cities to high-efficiency cities, and Jining and Zaozhuang advanced from low-efficiency to medium-low-efficiency cities. Tai’an transitioned from a high-efficiency city to a medium-low-efficiency city, while Binzhou transitioned from medium-high efficiency to low efficiency. Cities like Zibo, Liaocheng, Rizhao, Weifang, and Linyi saw little change in their efficiency.
Overall, green economic efficiency has increased over the years, with a growing proportion of high-efficiency cities. High-efficiency areas gradually cluster around Jinan and the eastern coastal regions. This trend may be attributed to the superior technological and capital strengths of Jinan and the eastern coastal regions, as well as the increased opportunities for green economic development.
We further calculate the global Moran’s I index for green economic efficiency from 2011 to 2020 (Table 4). In these findings, it’s shown that the index was negative in 2011 and 2012 but turned positive in 2020. Moreover, these values demonstrated statistical significance at a 10% level of significance. In the remaining years, while the index was negative, it did not meet the significance threshold, this indicates that cities’ green economic efficiency exhibits distinct heterogeneous clustering, with spatial dependency relationships distributed differently across various regions. Regarding the trend, the global Moran’s I index displays a cyclic pattern of “decline-rise”, and shows a gradual reduction in the degree of heterogeneous clustering of the efficiency. In general, the underlying reason may be attributed to disparities in resource availability and economic development levels across distinct cities, which weaken the radiating and driving influence of high-efficiency cities on their surrounding areas.
Fig.1.
The Spatial Distribution of Cities’ Green Economic Efficiency in years a) 2011, b) 2014, c) 2017, d) 2020.
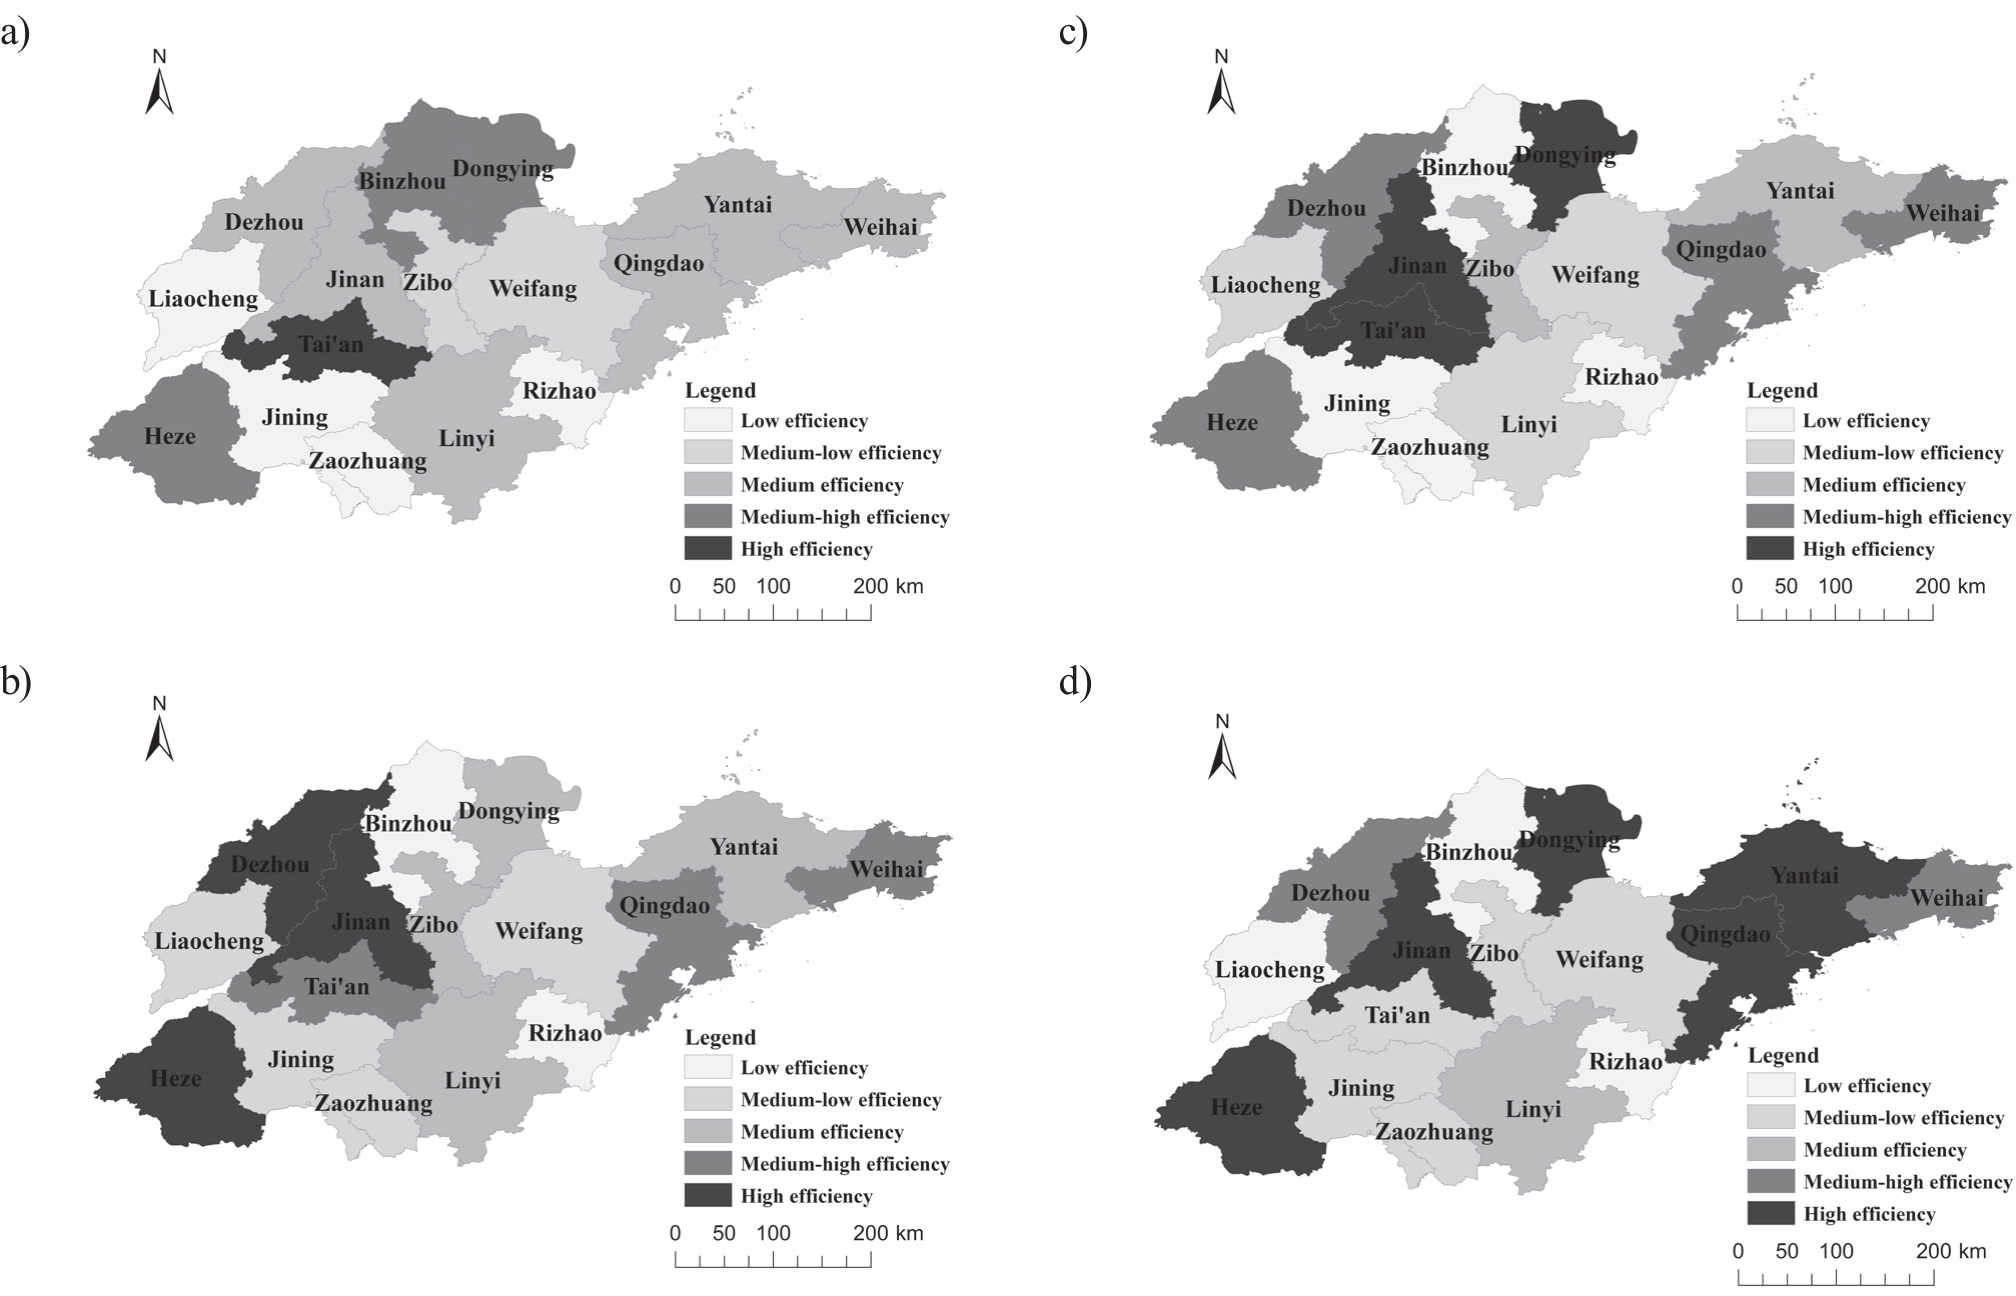
Table 4.
Global Moran’s I of Cities’ Green Economic Efficiency from 2011 to 2020.
| Year | 2011 | 2012 | 2013 | 2014 | 2015 | 2016 | 2017 | 2018 | 2019 | 2020 |
|---|---|---|---|---|---|---|---|---|---|---|
| Moran’s I | -0.256 | -0.265 | -0.093 | -0.023 | -0.018 | -0.025 | -0.046 | -0.218 | -0.086 | 0.183 |
| P-values | 0.062 | 0.039 | 0.837 | 0.732 | 0.668 | 0.730 | 0.868 | 0.230 | 0.239 | 0.053 |
Analyze the local spatial clustering and outliers further for the years 2011 and 2020. Specifically, in 2011, there were two types of clustering observed: H-L type cluster in Tai’an and L-H type cluster in Zaozhuang. In 2020, there were two H-H type clusters, representing Heze and Qingdao, along with one L-L cluster, associated with Binzhou. The majority of cities exhibit non-significant local spatial autocorrelation.
Analysis of Factors Affecting Cities’ Green Economic Efficiency
We use a panel Tobit model to further analyze the factors that have an impact on green economic efficiency, and conduct the following theoretical analysis and hypotheses for the explanatory variables:
(1) Economic Development (ED)
Based on the input and output theory of green economic efficiency, it is typically expected that regions with greater economic development will exhibit higher levels of efficiency. Therefore, we posit the following supposition:
H1. Positive economic development correlates with improved green economic efficiency.
(2) Industrial Structure (IS)
The upgrading of the industrial structure is essential for fostering green economic development. The third industry, predominantly comprising the service sector, generally exhibits lower resource consumption and a lesser environmental footprint compared to the second industry, characterized by industrial operations. Therefore, we posit the following hypothesis:
H2. The upgrading of the industrial structure correlates with improved green economic efficiency.
(3) Urbanization Level (UL)
The level of urbanization not only affects the basic social infrastructure for green development but also influences environmental governance. Therefore, promoting urban-rural integration, fostering harmonious urban-rural development, and reducing urban-rural disparities is essential for green development. we put forth the following supposition:
H3. The level of urbanization can enhance green economic efficiency.
(4) Environmental Regulation (ER)
Previous research indicates that there are different relationships between environmental regulation and green economic efficiency [35-38]. This research suggests that environmental regulation can encourage technological evolution and mitigate the expenses of environmental governance. Hence, we put forth the following supposition:
H4. Environmental regulations can enhance green economic efficiency.
(5) Technological Advancement (TA)
Technological development is key to green development as it can enhance resource utilization efficiency and ecological governance capacity. we propose the following assumptions:
H5. Technological advancement can drive the development of green economic efficiency.
(6) Social Security (SS)
Research suggests that a robust social security system is favorable for green economic development. Hence, we make the following assumptions:
H6. The level of social security can exert a beneficial influence on green economic efficiency
Analysis of Regression Results of Factors Affecting Cities’ Green Economic Efficiency
We perform a Tobit regression analysis to examine the factors that impact green economic efficiency in Shandong Province between 2011 and 2020 (Table 5), The specific analysis is as follows:
(1) The regression coefficient for ED is 0.000, and it is significant at the 0.01 level, indicating a significant positive impact of economic development on efficiency values, confirming hypothesis 1. This means that with higher economic development, the development model becomes more resource-efficient and places a stronger emphasis on environmental protection.
(2) The regression coefficient of IS is -0.050, and it is also significant at the 0.01 level, indicating a significant negative impact of industrial structure on green economic efficiency, contrary to hypothesis 2. In general, the second industry is marked by its significant energy depletion and environmental pollution, which negatively affects green economic efficiency. However, in Shandong Province, the second industry remains an economic pillar and exerts a beneficial influence on green development efficiency.
(3) The regression coefficient for the UL is 0.000 but is not significant, indicating that urbanization level does not significantly affect efficiency values, which contradicts hypothesis 3.
(4) The regression coefficient for ER is -0.000 and is also not significant, suggesting that environmental regulation does not significantly affect efficiency values, which does not support hypothesis 4. This may be because environmental regulation and green economic efficiency exhibit varying characteristics within specific geographic regions, influenced by regional differences.
Table 5.
Regression Results.
| Symbol | Coefficient |
|---|---|
| TA | 0.000*** (3.142) |
| ED | 0.000*** (4.303) |
| SS | 0.000*** (2.890) |
| UL | 0.000 (1.881) |
| ER | -0.000 (-1.603) |
| IS | -0.050*** (-4.796) |
(5) The regression coefficient for TA is 0.000, and it exhibits statistical significance at the 0.01 level, signifying a substantial and positive impact of technological advancement on efficiency values, thus validating hypothesis 5.
(6) The regression coefficient for SS is 0.000, and it also holds statistical significance at the 0.01 level, suggesting a notable positive effect of the social security level on efficiency values, thereby confirming hypothesis 6.
Robustness Test
In cases where there exists an inverse causal connection between explanatory variables and the dependent variable, data reflected by the Tobit model can potentially introduce endogeneity issues. To mitigate these endogeneity concerns, we replace the explanatory variables in the regression model with their one-period lags, keeping the dependent variable, green economic efficiency, unchanged. We then conduct another round of regression analysis using the Tobit model. The findings from the research are presented in Table 6. and are largely consistent with the regression outcomes obtained in the previous section. This confirms the robustness of the research findings regarding the factors influencing green economic efficiency.
Discussion
Studying the green economic efficiency of various cities in Shandong Province not only contributes to a deeper understanding of the region’s sustainable development status but also provides a practical reference for formulating relevant policies and strategies, thereby promoting cities towards a more environmentally friendly and sustainable direction.
Firstly, the research findings indicate a shift in the green economic efficiency of cities in Shandong Province from negative agglomeration to a gradual positive agglomeration trend, aligning with the results of previous literature [39]. In most years, the green economic efficiency exhibits significant negative agglomeration or appears as insignificant spatial autocorrelation, potentially due to the heterogeneity of natural conditions and differences in management levels among cities, along with the “siphon effect” and “pollution transfer” in some central cities.
Secondly, the phenomenon of higher green economic efficiency cities gradually clustering around the provincial capital and the eastern coastal areas aligns with previous studies [40]. These cities, due to superior resource allocation and proactive green development policies, prioritize technological innovation and attract a highly skilled workforce. These factors collectively drive the development of green economies in these cities.
Lastly, social security, economic growth, and technological advancement promote green economic efficiency, consistent with previous research [41-43]. However, industrial structure hinders efficiency growth, contrary to prior studies. In comparison to industries with high technological content and strong innovation, Shandong Province’s dominant industries still rely on high-emission and high-pollution sectors, such as heavy industry and traditional manufacturing. Therefore, this industrial structure may act as a constraint to the improvement of green economic efficiency.
Conclusion and Policy Recommendations
In this study, we assess the cities’ green economic efficiency using a super-efficiency model with undesirable outputs, we then explore the spatial-temporal patterns of efficiency using the spatial autocorrelation method and natural breaks method. Finally, we apply a panel Tobit model to analyze the factors influencing efficiency. The main discoveries are outlined below:
1) Overall, since 2011, the green economic efficiency of the 16 cities in Shandong Province has shown a fluctuating upward trend. However, there is a significant disparity in green economic efficiency among these cities, with developed cities exhibiting relatively higher levels of efficiency.
2) The proportion of cities with high green economic efficiency steadily increases, and these high-efficiency areas gradually cluster around Jinan and the eastern coastal regions. Green economic efficiency exhibits heterogeneous clustering, but the degree of heterogeneity gradually decreases.
3) Social security, economic development, and technological advancement significantly enhance green economic efficiency. However, the industrial structure has a noticeable dampening impact on efficiency, neither the level of urbanization nor environmental regulations exert a significant influence on efficiency.
Based on these research findings, we put forth the following recommendations:
Firstly, to address the gap in green economy efficiency among cities, it is advisable to leverage the radiating effects of cities with high green economy efficiency. Actively introducing advanced domestic and international technologies and experiences and enhancing inter-regional cooperation between high green economy cities and their surrounding cities to raise the overall green economy level of Shandong Province. Secondly, given the relatively high proportion of the first and second industrial sectors in cities, optimizing and adjusting the industrial structure is recommended. Experiences from cities like Jinan, and Qingdao, which have excelled in green economic development, can be drawn upon to the transition away from energy-intensive heavy industries. This can stimulate industrial upgrading and the development of new avenues for economic efficiency and quality, promoting the shift towards a greener economic structure. Lastly, to address the issue of heterogeneous clustering of green economic efficiency, tailored strategies should be employed to enhance green economic efficiency in different cities. For developed cities, strengthening the research and application of green technologies and improving production and resource utilization efficiency is essential. This includes innovations in clean production technologies, renewable energy, and green construction. For less developed cities, the fostering of green industries, like agricultural eco-tourism and rural renewable energy projects, can boost economic growth. Moreover, establishing technology transfer and cooperation relationships with developed cities can provide access to green technologies and expertise.
This article provides valuable information in empirical research but still has the following shortcomings. Firstly, considering the availability and operability of data, there is a need for further improvement in the indicators related to efficiency measurement and influencing factors. Secondly, in exploring influencing factors, there is an overemphasis on internal factors. Future research should broaden its scope by incorporating more external influencing factors, such as the digital economy, economic policies, and institutional quality.

