

Introduction
Ports play a vital role in the global logistics chain. The development of port industries and maritime transport is essential for the global economy. Ships transport 90% of worldwide trade, making them an integral part of international trade. Without the efficient functioning of ports, the global supply chain would not be able to operate smoothly. Port cities (PCs) are business entities with important maritime activities that serve as the link between the global and local environments [1]. Described as a development concept, sustainable development integrates environmental and social constraints into the economy and is genuinely part of a long-term perspective. Nowadays, sustainable development has become a global consensus due to the significant expansion of the global population and the rapid destruction of the environment by human activities [2]. Port cities have been facing many negative impacts that have adversely affected their competitiveness and ability to attract public and private investments. These different negative impacts have decreased port city competitiveness and hindered their ability to attract certain public and private investments [3]. These impacts were caused by a variety of factors, including environmental degradation, political instability, and economic volatility. One of the major negative impacts that port cities have been facing is environmental degradation. Due to heavy industrialization and shipping activities, these cities have been experiencing high levels of pollution, which has harmed the health of the population and the environment. Consequently, potential investors will be less inclined to invest in them, as they are uncertain of the impact of pollution on their investments. Thus, the key factor in improving competitiveness given attention is sustainable development. Scholars from China and throughout the globe have investigated the impact of environmental challenges on ports in various countries.
Research has previously explored the relationship between ports’ economies, land use, collection and distribution, spatial relationships, the economic development of ports, and their interface. In [4], the author presented the efficiency of the approach used for forecasting the container throughput of Tianjin port. Diversification-oriented industrial transformation (DIT) has been used as a strategy for port enterprises to make decisions, reasonably formulate a diversified transformation strategy, and enhance performance, which is suitable for upgrading the interactive development and integration of the PC in China [5]. The authors examined the competitiveness of inland cities and coastal cities from 1990 to 2009 using panel data from 25 Chinese cities. They examined how this changed over two decades and the competitiveness of megacities and administrative centers over the past two decades. They also examined the role of each variable in explaining urban competitiveness and its development [6]. A difference-in-difference (DID) model was used in [7] to identify the causes of spatially differentiated urban development and to analyze the influence of port integration (PI) on urban economic growth. PI has been found to not only help PCs grow economically (its effects increase with time), but also that it has a clear positive effect on the economic growth of cities in the Yangtze River Delta (YRD) region, particularly small and medium-sized ones. According to some authors, green ports also contribute to transport pollution in PCs [8]. In [9], a bottom-up approach was developed to use load-dependent functions to evaluate emissions from actual ship operations instead of average emission factors for the engine load range.
Because ports are so important to a country’s economy, scholars all over the world are now paying close attention to port efficiency and environmental issues that affect ports. In addition, scholars also claim that PCs in Europe serve as centers for sustainability research [2]. For instance, in Algeria, the application of the Boussole21 technique to assess the sustainability of a PC in Skikda showed how beneficial intelligent planning is to the growth of port performance and its competitiveness [10]. The evaluation of ten distinct PCs’ sustainability and efficiency revealed that the best-ranked ports have created a mix of integrated plans, policies, and procedures for sustainable port development [11]. A review of the Twin Port’s sustainable development revealed how the green port contributes to GDP growth, improves urban infrastructure, and enriches PCs in general [12]. Port exhaust emissions have a significant impact on urban air quality, according to the findings of a bottom-up model study on the effects of ship emissions on air pollution at Naples Port. Human health is negatively impacted by ship emissions and pollution in port cities [13]. An evaluation of PCs’ environmental efficiency using the SBM-DEA model was carried out, and the findings demonstrated how much more efficient the PCs of Rotterdam, Singapore, Kaohsiung, Busan, New York, and Antwerp are than Tianjin’s [14]. Some scholars have gone a step further and evaluated port emissions to highlight ports’ environmental performance [15–17]. There is, however, a dearth of studies on how environmental issues affect PCs. The majority of studies focus on the sustainability, productivity, or efficiency of ports or container ports [18– 20]. Consequently, the SBM-DEA model is employed in this study to evaluate the environmental performance to overcome these constraints. In addition, when selecting economic indicators for PCs, the influence of throughput on GDP should not be ignored [21]. Therefore, to analyze the sustainability effectiveness of port cities, we will be considering the GDP as an important outcome. Although previous research has focused on the influence of GDP, it has been classified as an undesirable outcome due to its negative impacts on the environment and social well-being. The proposed analysis will take into account the various factors that contribute to the sustainability of port cities, including environmental, economic, and social efficiency.
A port city is a populated area where humans depend on their environment to survive. Environmental problems continue to be of increasing concern, and sustainable port development is a priority when it comes to protecting the ecology of port cities [22]. In 1992, at the Rio Earth Summit, 173 countries adopted “Agenda 21”, which defines a program of actions for the 21st century in various fields to move towards sustainable development of the planet. The Government of China has made sustainability a top priority and issued a variety of regulations on the subject, such as the “Opinions on Promoting Healthy and Sustainable Development of Coastal Ports”, “China’s Agenda 21 - China’s White Paper on Population, Environment, and Development in the 21st Century”, the “Regulations of the People’s Republic of China on Emergency Preparedness and Management for Marine Environmental Pollution”, and the “ Port Law of the People’s Republic of China”. The model for sustainability has since been widely recognized worldwide. Since then, numerous studies have focused on sustainable cities [23]. Several disciplines have quickly focused on and investigated sustainable development, which is described as “fulfilling the demands of the current generation while ensuring that the capacity of succeeding generations to meet their needs is not compromised. Sustainability has been studied in various sectors, including transport, supply chain, energy, etc. [24]. Sustainability and development are the two indispensable cores that constitute sustainable development. A sustainable and balanced world needs to have economic, social, cultural, and ecological development based on the resources available and the environment’s carrying capacity [25]. Several researchers have looked into how to assess sustainability, and different methods have been applied [24].
Sustainable cities and communities are included in the 17 SDGs (Sustainable Development Goals) approved during the United Nations Summit about sustainable development on 25 September 2015. The port city becomes more attractive by improving its sustainable capacity and attracting more socio-economic investments. The distance between the port and the city is a crucial factor that greatly influences the efficiency of the port and the overall economic development of the city. The government has to make relevant decisions for sustainable development [22]. Scholars looked at the question of how to coordinate the relationship between ports and cities in promoting energy conservation and emission reduction [26]. Different methods, including the DEA model, have been used to analyze the sustainability of cities. For example, in [27], the authors utilized a two-stage DEA model to assess the port and the city. The results showed relative differences in sustainability, which revealed the effectiveness of their policies. As countries, provinces, and cities are complex sustainable systems with diverse inputs and outputs, considering proportions alone does not fully represent variations in environmental resources or levels of human well-being. For this reason, the Super Slack-based Measurement Model (SBM) is used to simultaneously assess the different efficiencies of inputs and outputs.
Having become the center of urban development, the sustainability of PCs requires the support of quality port resources and the environment. Sustainable development aims to fulfill present demands without harming the capacity to satisfy future demands. The 3 pillars of sustainability include aspects of society, the economy, and the environment [28]. The efficiency of the sustainable development of the port city, therefore, promotes the capacity of the port city and the joint development of the port industry in the port city and its surrounding areas. Assessing the sustainability performance of port cities explores the development of port cities, including their sustainability requirements, the state of port infrastructure, the level of environmental governance, and the port’s operating capacity. So far, methods for assessing sustainability performance have involved using the DEA model from an input-output perspective. The input refers to all the resources invested in promoting sustainability, and the output can be determined by the result of the port’s sustainability efficiency, which leads to a competitive port. Commonly used DEA models are CCR and BCC, which are radial and angular, unlike the SBM model, which is non-radial and non-angular [29]. In our paper, we assessed the sustainability efficiency of 10 port cities in China during and post-Covid-19. The COVID-19 outbreak began in China late in 2019 and spread around the world the following year. This had an unexpected impact on different sectors such as industry, maritime transport, and ports [30], prompting some countries to protect their land and take some environmental measures to control carbon emissions [31]. Thus, through the SBM super-efficiency model, the sustainability efficiency of 10 major port cities in China over the years 2018-2021 is assessed and the reason why ports are inefficient is also analyzed. At the same time, dynamic changes in its efficiency are explored using the Malmquist Productivity Index (MPI) model to improve the sustainability efficiency of port cities.
Hence, Section 2 describes the study sites, the inputs and outputs indicators, and the model adopted. Section 3 describes the SBM super-efficiency model and the MPI results obtained using, respectively, the DEA Solver 13 Pro software and DEAP 2.1 and their analysis, while Section 4 has the conclusion.
Material and Methods
Data Resource
China is the second-largest country in terms of surface area and is surrounded by water to the east. Its coastal ports play a pivotal role in the country’s development. Although ports promote economic development and employment in port cities, they also harm the environment of these cities. The sustainability of port cities is therefore becoming more and more important. The ten (10) Chinese port cities that represent the DMUs include the ports of Yingkou, Dalian, Xiamen, Yantai, Tianjin, Qingdao, Guangzhou, Shenzhen, Ningbo-Zhoushan, and Shanghai. All data were collected from the “China Statistical Yearbook (2019-2022)”, the port websites, and the “China State Planning Bureau”. These port cities were used as study samples to measure and analyze their sustainability performance. Fig. 1. below presents our selected 10 port cities.
Yingkou Port: The geographical coordinates of the port of Yingkou are 40°17′42″N latitude and 122°06′00″E longitude. It represents the nationally important comprehensive main hub port, the nearest seaport to the Northeast region and the eastern Inner Mongolia region, the largest cargo port in the Northeast region, and the main port of the Liaodong Bay Economic Zone. The size of Yingkou Port’s assets makes it the largest state-owned enterprise in Liaoning Province [32].
Dalian Port: The geographical coordinates of the port of Dalian are 121 ° 39′ 17 ″ E, 38 ° 5′ 44 ″ N. The port is located in the center of the Northwest Pacific Ocean. It is the most convenient port for the transshipment of goods from the Far East, South Asia, North America, and Europe. The Port of Dalian is an essential global port for the former industrial base in China’s northeast, as well as for China’s coastal ports [33]. The port has 346 square kilometers of open water and 10 square km of land. There are over 80 modern professional berths, including 40 berths above 10,000 tons.
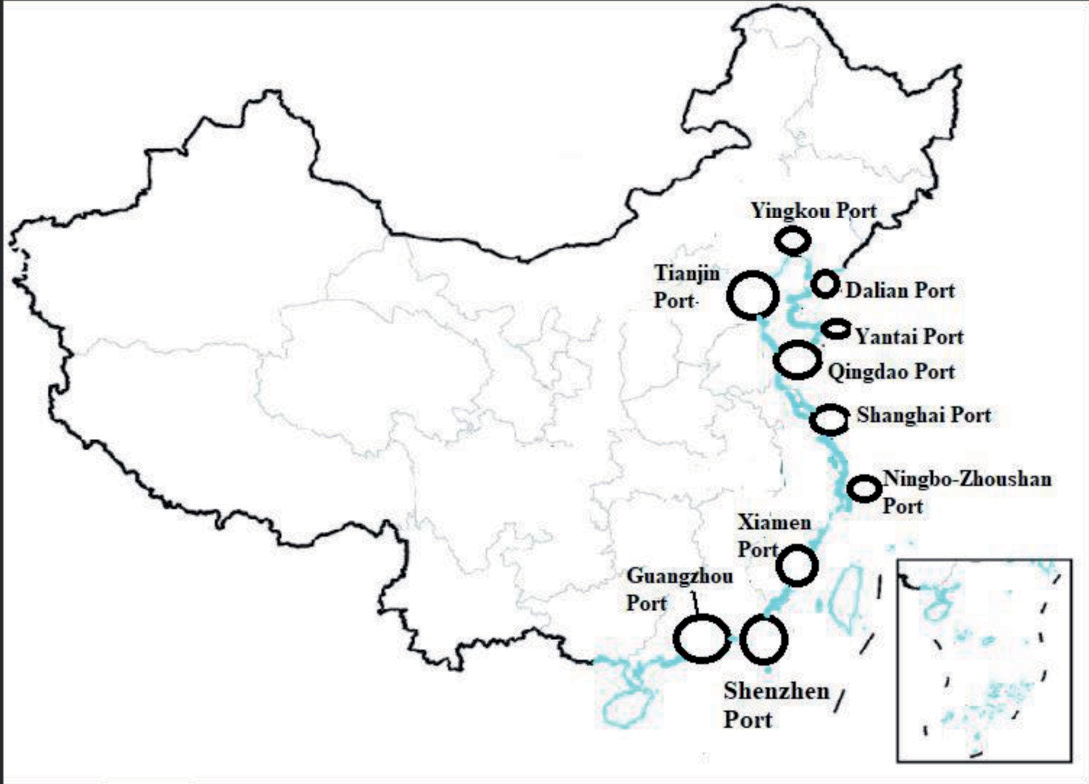
Xiamen Port: Located in the Chinese province of Fujian, it lies along the southeast coast of China and on the west coast of the Taiwan Strait. Its geographical coordinates are longitude 118° 04’ and latitude 24° 27’. It is located in the southern part of Fujian Province, at the mouth of the Jiu Long River. It is a major coastal port in China [34], a leading port with access to the global world by China, and one of the main seaports in Fujian province.
Yantai Port: Yantai Port is a seaport located on the Yellow Sea, near Yantai, Shandong, China. Founded in 1861, Yantai Port has grown from a primitive natural harbor to a hub of national river traffic and a major open coastal port in China. Its geographical coordinates are 37° 33’ 20” North and 121° 23’ 17” East. The port is one of 15 key ports in coastal cities as part of the “Belt and Road Initiative” [35].
Tianjin Port: The Port of Tianjin, also known as Tianjin New Port, is at the entrance to the Hai He River in Tianjin, China. Tianjin Port is the world’s highest deep-water artificial harbor [36], built by excavating the sea and filling land on muddy shoals. Its geographical coordinates are 117 ° 42 ′ 05 ″ E and 38 ° 59 ′ 08 ″ N. Tianjin Port has the most advanced container ships in the world to enter and exit the port.
Qingdao Port: Founded in 1892, Qingdao Port is located in Jiao Zhou Bay on the south coast of the Shandong Peninsula, with geographical coordinates of 120 ° 19 ′ 05 ″ E and 36 ° 04 ′ N. It is an international trading port and transit hub for China along the Yellow River basin and the Pacific West Coast [37]. In more than 130 regions and countries around the world, the port has developed commercial connections with more than 450 ports. It is now the world’s 8th busiest port in terms of container volume and 7th busiest in terms of total throughput.
Guangzhou Port: Positioned at the entrance of the Pearl River and its center, the port is bordered by Macau, the South China Sea, and Hong Kong, where the East River, West River, and North River converge into the sea. With its geographical coordinates of 113 ° 36 ′ E and 23 ° 06 ′ N, the port is the largest hub and container port in southern China. The port, which has a deep-water container terminal dedicated to the development of maritime transport activities [38], plays an important role in the Chinese economy, managing a range of activities such as loading and offloading, bonded warehousing, storage, and container freight services.
Shenzhen Port: It occupies a strategic position in the Pearl River Delta, in the Chinese province of Guangdong. The port is not only one of the largest in China but also offers great potential for development. It is one of the busiest ports in the world and the third busiest container port in the world (in terms of TEUs). Its geographical coordinates are 22.5012N and 113.8527E. Over the past 30 years, Shenzhen’s port logistics have had a considerable impact on transport infrastructure, attracting foreign investment and stimulating international trade [39].
Ningbo-Zhoushan Port: representing the most active port in China, it is located in the middle of the eastern coast of Zhejiang province, near the Yangtze River’s entrance. With its geographical coordinates of 29° 51’ 59.99” N and 121° 32’ 59.99” E, it is the first and currently the only port in the world with a cargo throughput of over one billion tons [40]. With a coastline 10 m deep and 333 km long, the port handles most of Zhejiang province’s imports and exports.
Shanghai Port: Located at the center of the coastline of mainland China and the mouth of the Yangtze River into the sea, Shanghai Port lies at the intersection of the Yangtze River, a horizontal axis running from west to east, and the coastline, a vertical axis running from north to south in China. Its geographical coordinates are 31° 14’ N latitude and 121° 19’ E longitude. Since 1843, the port has rapidly become the largest port in China and the largest container port in the world since 2010 [41]. The port benefits from its strategic position, good condition of the environment, rich and flourishing ecosystem, and comprehensive infrastructure and non-coastal distribution structures.
Container Throughput Analysis Through Data Analytics
More than 30 million infections were reported worldwide following the outbreak of COVID-19, negatively influencing the Chinese environmental health system and the global economy. From the first term of 2020, China was severely affected and endangered by the disease [42]. In 2020, unlike in 2019, the pandemic worsened, causing a 1.2% drop in the volume of global container traffic. However, it succeeded in rapidly halting its spread. Radical measures were taken to protect not only the health of the population but also the environment. In this view, Fig. 2. below shows the average results of the evolution of the monthly container throughput of our 10 selected port cities over the years 2018-2021, revealing the impact of the Covid-19 epidemic.
Fig. 2. compares the average volume of containers transiting through the ten ports before and after the lockdown (2018-2021) of the COVID-19 pandemic. Since December 2019, at the beginning of the pandemic, the impact has been felt slightly, with a decrease of 4.19% in container throughputs. This significantly decreased to 41% in February 2020, when the rapid spread of the epidemic led the Chinese government to take radical measures. Taking the port of Shanghai as an example, the measures led the port authorities to close the port for at least three months, resulting in a 100% drop in container throughput. World economies were severely affected by the epidemic, leading to the closure of many productive activities as a result of the measures taken to contain it. However, the recovery process appeared rapidly after March 2020, with an increase in the rate of 7.35% of the last recorded value of the container throughput. Although container throughput appeared to be relatively stable, in February 2021 the rate relapsed to 20.27%, followed by a rebound in March. This shows that port activities have recovered well since the outbreak. This analysis of the data observed has made it possible to clarify the effects of external shocks on ports’ container flow development.
Selected Inputs and Outputs Indicators
A port’s development promotes the growth of cities. Port sustainability efficiency is defined as the ratio between inputs (i.e., port resources) and actual effective outputs, including the social, economic, and environmental outcomes, of a port as a measure of its performance. In combination with the literature [43], [44], the index system is constructed from both the input and output perspectives. The appropriate choice of inputs and outputs is the cornerstone of an accurate assessment of port efficiency. The system of evaluation indices is constructed from many aspects, including environmental, economic, and social, to describe the efficiency of the sustainable development, operation, and management of the port scientifically and comprehensively. As shown in Table 1, the following variables represent our inputs and outputs.
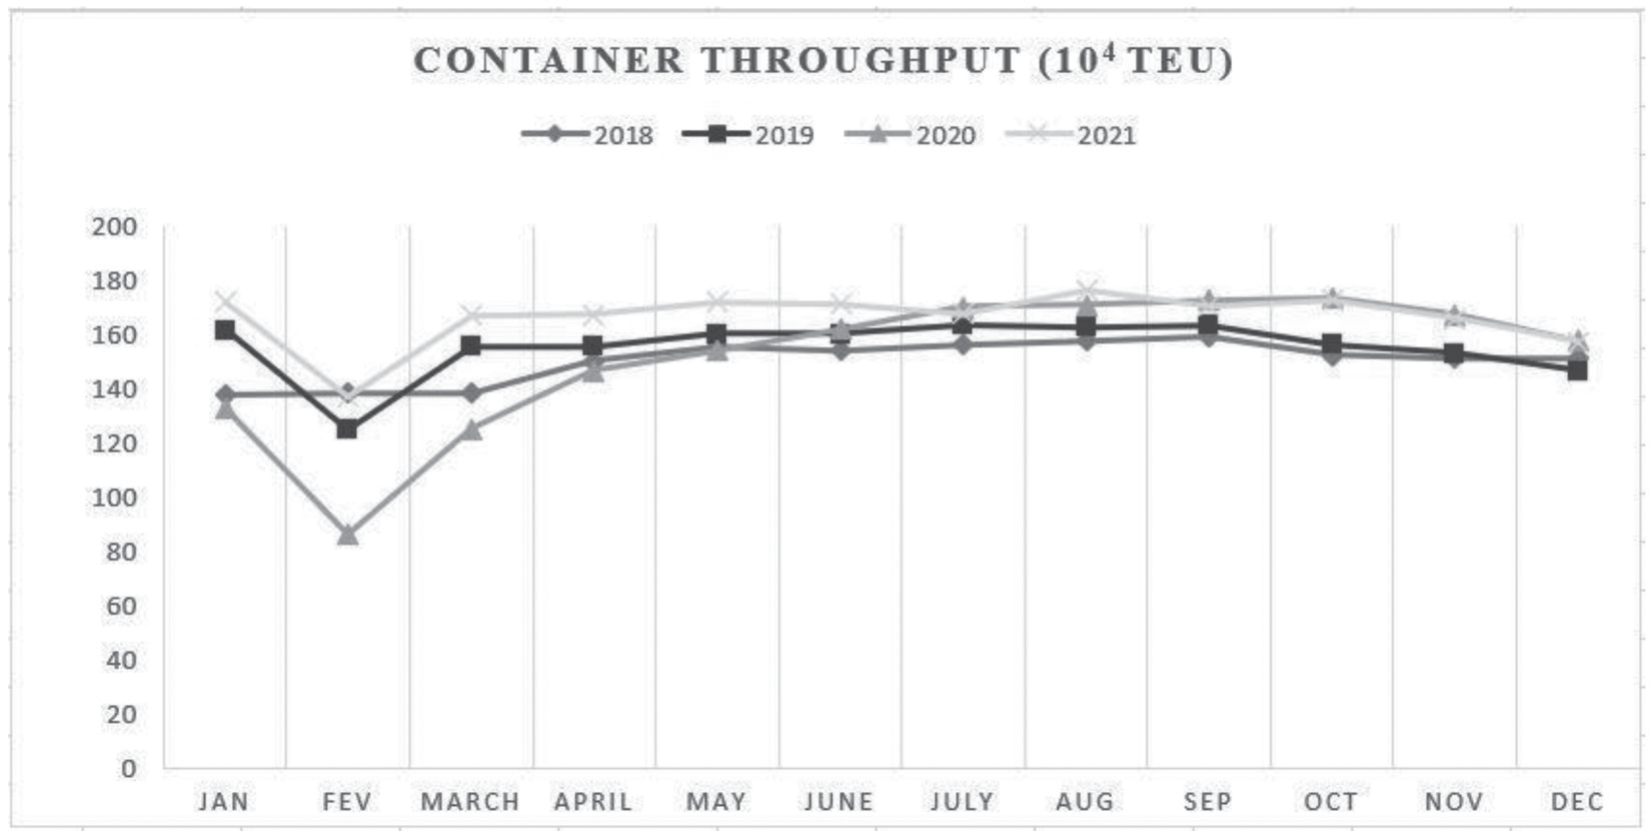
Table 1.
Inputs and Outputs indicators
Input indicators: the quay length, number of berths, labor population, and energy consumption were selected as our PCs’ input indicators. The length of the quay determines the vessels that can access the port and, in turn, the amount of cargo that can be processed efficiently. The sustainable development of port cities requires a balance of environmental, economic, and social indicators. Therefore, the quay length and the number of berths are selected as the economic input for sustainable development efficiency. Sustainable development efficiency is a crucial aspect of achieving long-term social well-being. By investing in the growth and empowerment of labor, organizations can foster a more sustainable and profitable future for both individuals and society as a whole, so the labor population is regarded as the social input. Sustainable development efficiency is a critical aspect of ensuring a better future for our planet. To achieve this, it is imperative to consider the environmental input, particularly in terms of energy consumption; therefore, the environmental input is illustrated by the energy consumption. A port city’s proper functioning depends on these inputs.
Output indicators: the cargo and the container throughput represent the economic output. Cargo throughput is an important indicator as it directly reflects the level of economic activity and trade in a given port. Container throughput enables efficient transportation and storage of goods. Higher container throughput signifies increased global business and economic activity, as well as the importance of a specific port as a hub for global commerce. While these output indicators provide valuable insights into the economic performance of port activities, it is equally essential to consider the environmental outputs associated with these operations. Air pollutants and water pollutants are two types of environmental outputs that have negative impacts on maritime ecosystems. Both of these pollutants are hazardous to the environment and can have long-term detrimental effects. In particular, they can lead to the destruction of essential habitats and the disruption of fragile marine ecosystems [45]. Among the air pollutants, we selected smoke dust (DUS) emissions, sulfur dioxide (SO2) emissions, and the average annual concentration of respirable fine particulate matter (PM2.5), while wastewater (WW) emissions represent water pollutants. DUS emissions originate from natural events like dust storms or wildfires, industrial activities, or combustion processes. Managing and controlling DUS is crucial to reducing air pollution and protecting human health. SO2 emissions result from the use of fossil fuels, including oil, gasoline, and coal. To reduce air quality degradation and its negative impacts, SO2 emissions have to be managed and regulated. PM2.5 is an important air quality indicator. PM2.5 has an important influence on health, such as cardiovascular and respiratory diseases. When managed, the annual average concentration of PM2.5 helps evaluate air quality, and its control measures efficiency. Wastewater emissions refer to the release of untreated water-containing pollutants into the environment. Managing wastewater emissions is critical to protecting water quality, public health, and aquatic ecosystems. Managing and reducing emissions of wastewater, smoke dust, and sulfur dioxide, as well as maintaining low levels of PM2.5, are key goals in environmental and public health protection efforts [46]. The study of the relationship between port throughput and economic indicators of PCs showed that throughput also influences their GDP [21]. The GDP is a crucial social factor that provides insights into a country’s economic growth and overall well-being. Therefore, the GDP represents our social output.
Assessment Model for Sustainable Development Efficiency: the Super-Efficiency SBM Model
Originally developed in 1978 by CCR (Charnes, Cooper, and Rhodes), [47], DEA helps to compare enterprises or organizations that use several inputs to produce several outputs. It is suitable for assessing the technical performance of DMUs (Decision-Making Units) that are homogeneous and belong to the same industry. When its efficiency value is one, a DMU is considered efficient in traditional models. If the efficiency value is inferior to one, the DMU is inefficient. Thus, a super-efficiency DEA model, proposed by [48], is capable of achieving an efficiency greater than 1, allowing comparisons between all the DMUs.
As demonstrated in [49], SBM models were used to formulate super-SBM models for evaluating efficiency. This is the best performer because it has the highest efficiency status, which is indicated by unity. DMU combines input and output factors and ranks n DMUs based on the result of super efficiency, and SBM efficiency is also called DMU
Eq. 3 below shows how the DMU efficiency is calculated:
In [49], the author first explains SBM efficiency and then shows super efficiency with the assumption of DMUs ( x0 , y0 ) . P is shown as follows:
The following Eq. 5. is a definition of the subset:
Distance
The super efficiency of DMU is defined by the optimal objective function
The author’s theory states that when the value for α and β is set to
(8)
Therefore,
It is clearly shown by comparing Eqs. 8 and 9,
inputs and outputs respectively;
output indicators;
factors;
Malmquist Productivity Index Model (MPI)
The MPI model is a widely used method to measure and analyze DMU productivity changes over time. It is a non-parametric approach that compares the productivity of different entities, such as ports, firms, or countries, based on a set of input and output variables [50]. The Malmquist productivity index model measures technical efficiency using the linear programming method [51].
In this paper, the MPI model is utilized to assess the performance changes in the 10 port cities over the years 2018 to 2021. The dynamic change of the total factor efficiency is presented as follows: Where: Tfpch is equivalent to the Total Factor Efficiency Productivity Techch is equivalent to Technical Change Effch is equivalent to Technical Efficiency Change Pech is equivalent to Pure Technical Efficiency Change Sech is equivalent to Scale Efficiency Change. The M0 Malmquist productivity change index is presented: (output-oriented; period = t and t+1)
(11)
(12)
Table 2.
Descriptive statistics on Input and Output Data over 2018-2021
This shows that it is between period t and period t+1 that technological and efficiency enhancements have taken place. Tfpch can therefore be defined as follows:
When Tfpch > 1, the Tfpch of period t+1 is higher than that of period t;
When Tfpch < 1, this indicates a decrease in Tfpch;
When Tfpch = 1, Tfpch is constant.
Results and Discussion
Results of the Assessment of Sustainable Development
Efficiency of Port Cities Based on Super-Efficiency
SBM
As mentioned the data collected were imported into DEA Solver 13 Pro software and the Super SBM Non-Oriented model was used under the constant to return to scale.
The statistical data on the input and output variables for the years 2018 to 2021 is shown in Table 2. Over this period, several trends have emerged. The average values of the variables presented different trends. First, let’s take a look at the quay length, the number of berths, and the labor population. These variables showed a steady upward trend from 2018 to 2020, indicating a constant expansion of infrastructure and workforce. However, by 2021, there was a noticeable decline in all three variables, suggesting a potential change in port operations or other influencing factors. In contrast, variables such as energy consumption, PM2.5 (particulate matter), DUS (dust emissions), and SO2 (sulfur dioxide) have followed a different trend. In 2018, these variables had relatively high average values, indicating potential environmental issues. However, in subsequent years, from 2019 to 2021, there was a decreasing trend in these variables, suggesting successful environmental management efforts and more sustainable management. Cargo throughput and WW (wastewater) emissions followed an interesting trend. In 2018, both variables had higher average values. However, in 2019, a decrease was observed. From 2020 onwards, these values began to increase year on year, perhaps reflecting changes in business models or wastewater management practices. Container throughput showed a slightly fluctuating trend. It increased from 2018 to 2019, decreased in 2020, and increased again in 2021. This indicates variations in container traffic and shipping dynamics over this period. Finally, GDP has grown steadily each year, suggesting an overall positive economic climate that could influence trends in other variables.
Statistical data provide in-depth information on port performance and its interactions with environmental, social, and economic factors from 2018 to 2021. Further analysis may reveal more in-depth information and help to understand the underlying causes of these trends.
The 10 PCs’ sustainability efficiency was evaluated over the years 2018-2021, and the results are given below in Table 3 and Fig. 3. They summarize the sustainability efficiency scores of 10 PCs over the years 2018-2021 using the Super SBM DEA model. Ports (p) with a sustainability efficiency value of p ≥ 1 are classified as “strong sustainability efficiency port cities”, ports with a sustainability efficiency value between 0.5 ≥ p ≥ 0.7 are classified as “medium sustainability efficiency port cities”, and ports with a sustainability efficiency value between 0.25 ≥ p ≥ 0.5 are classified as “weak sustainability efficiency port cities”. Table 3 and Fig. 3. illustrate that Yingkou (1.9174), Xiamen (1.4675), Yantai (1.0688), Tianjin (1.1009), Qingdao (1.3483), Shenzhen (1.2053), and Ningbo-Zhoushan (1.1074) are considered to be “extremely strong sustainability efficiency port cities ”. Dalian (0.7712), Guangzhou (0.5376), and Shanghai (0.5215) are considered “medium sustainability efficiency port cities” [52].
Based on the efficiency value of each port city over the years 2018-2021, the sustainability efficiency of each port city is established. Out of the ten PCs, seven (7) are sustainably efficient port cities, and three (3) are inefficient. Accordingly, the most sustainable ports, including Yingkou, Xiamen, Yantai, Qingdao, Tianjin, Shenzhen, and Ningbo-Zhoushan, participate in initiatives that contribute to social, economic, and environmental sustainability. As shown in Fig. 3., Yingkou Port ranked first in China in terms of sustainability efficiency over the years 2018-2021. This port is followed by the ports of Xiamen in the following sequence: Yingkou > Xiamen > Qingdao> Shenzhen > Ningbo-Zhoushan > Tianjin > Yantai > Guangzhou > Dalian > Shanghai. Those of Guangzhou, Dalian, and Shanghai are, however, found inefficient.
Table 3.
Result of evaluating the sustainability efficiency of 10 Chinese PCs over 2018-2021
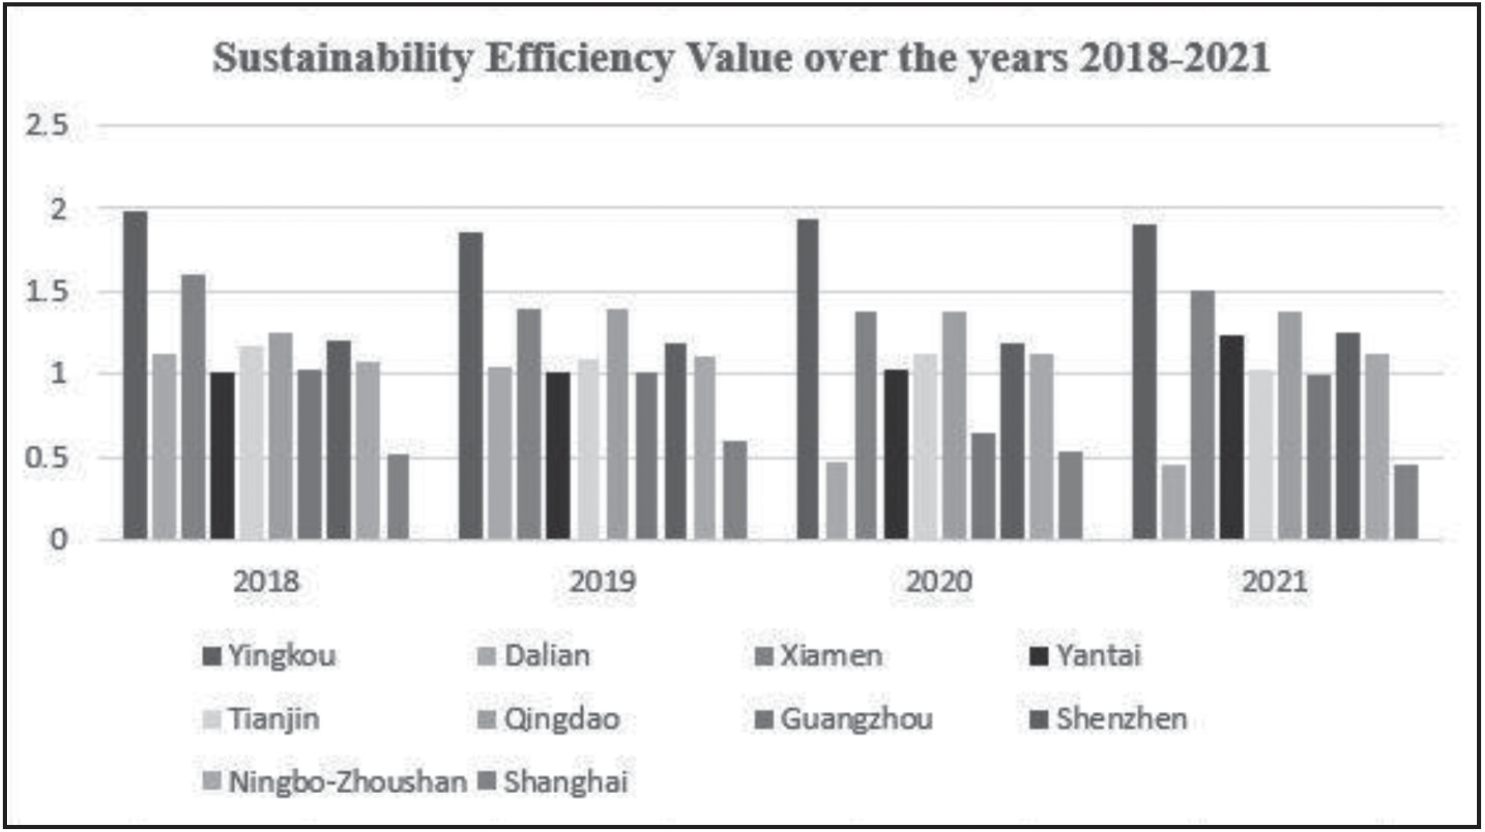
The results show that the overall average sustainability efficiency value of the 10 port cities over the years 2018-2021 is 1.143, which makes the DMUs effective. Among them, the average sustainability efficiency of 7 port cities, such as Yingkou, is higher than 1, which indicates that the DMU is effective and also serves as a benchmark for inefficient port cities, and the allocation and consumption levels of resource elements in the sustainable development process of these 7 port cities are reasonable. The average sustainability efficiency of 3 port cities, such as Guangzhou, is less than 1, which makes the DMU inefficient, indicating that there are insufficient outputs or redundant inputs in the sustainability process of these 3 cities, and corresponding measures should therefore be taken to improve efficiency. Analysis of Input Redundant and Output Insufficient in
DEA Inefficient Port Cities
As shown in Table 4, among the inefficient DMU port cities, there are varying degrees of redundancy and deficiencies in the sustainability efficiency of the port cities. The efficiency of a port city’s sustainability is influenced by various factors in terms of inputs and outputs.
In terms of inputs, the number of berths is the main factor affecting the efficiency of port city sustainability, with an average redundancy rate of 54.67%, which means that more than half of the berths in these port cities are underutilized, leading to inefficiencies and potentially higher costs. This is followed by the quay length, which represents the second factor with an average redundancy rate of 14.15%, suggesting that there is a moderate amount of excess capacity in terms of the length of the quay, which may also contribute to inefficiencies in the port city’s sustainability. Energy consumption is another input factor that affects sustainability. However, it has a relatively low average redundancy rate of 1.98%, indicating that the energy resources invested in environmental protection and sustainability are being used efficiently with a small amount of waste. Nonetheless, there is still room for improvement to optimize energy consumption further. Similarly, the labor population has a minimal average redundancy rate of 0.96%. indicating that the workforce employed in the port city is efficiently used with a small amount of waste. However, there is still a need for continuous improvement to ensure optimal utilization of labor resources.
In terms of output, the container throughput is the main factor influencing the efficiency of port city sustainability, with an average deficiency rate of 106.95%, which means that there is a substantial gap between the actual container throughput and the desired level, indicating inefficiencies in this area. Various factors contribute to the deficiency rate in terms of environmental outputs. The PM2.5 emissions have an average deficiency rate of 84.60%, indicating a significant gap between the desired and actual levels of these emissions. Similarly, DUS emissions have an average deficiency rate of 77.95%, while SO2 emissions have an average deficiency rate of 67.21%. These figures highlight the need for substantial improvements in reducing these harmful emissions for a more sustainable port city. The cargo throughput has an average deficiency rate of 34.46%, suggesting that there is a considerable gap between the desired and actual levels of cargo throughput, indicating a need for improvement in this area as well. Furthermore, wastewater (WW) emissions have an average deficiency rate of 10.52%, implying that there is still room for improvement in managing and reducing WW emissions to ensure better environmental sustainability. Lastly, the GDP growth of the port city has an average deficiency rate of 2.96%, indicating that the actual growth of the GDP falls short of the desired level, highlighting the need for measures to boost economic development and sustainability.
Table 4.
An average value of Inefficient DMU port cities’ input redundancy and output insufficiency rates over 2018-2021
In conclusion, the efficiency of a port city’s sustainability is influenced by various factors in terms of inputs and outputs. On one hand, energy consumption and labor population show relatively low redundancy rates, but there is still room for improvement. On the other hand, factors like the number of berths, quay length, container throughput, DUS and SO2 emissions, cargo throughput, WW emissions, and GDP growth require significant attention and improvements to enhance the overall sustainability of the port city. It’s essential to continue monitoring and evaluating these aspects to ensure continued progress and success in achieving sustainability goals. Results and Analysis of Sustainability Efficiency Change
Based on the Malmquist Index Model
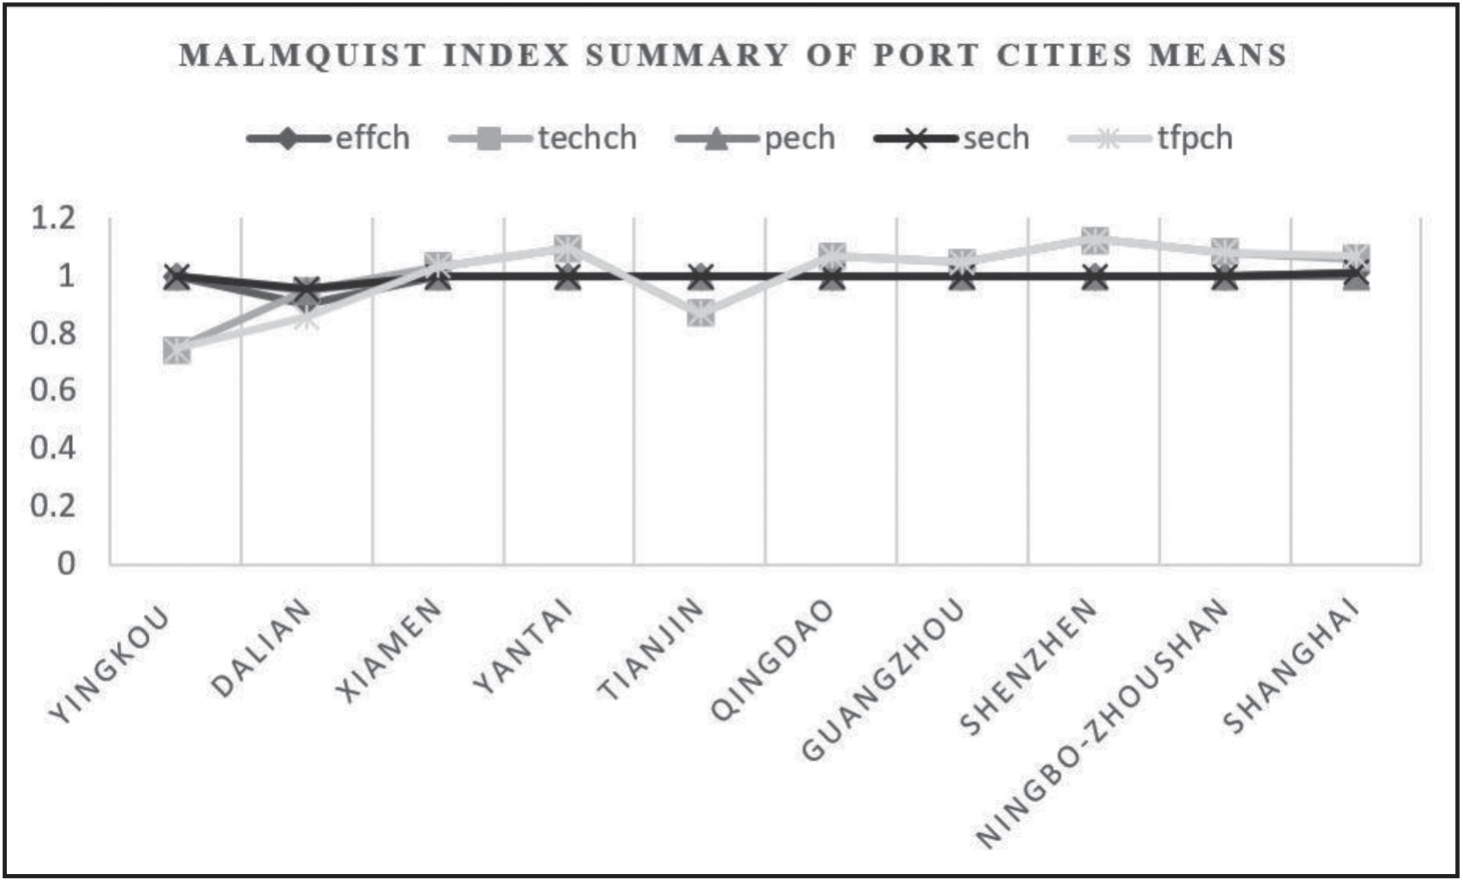
To further illustrate the dynamic changes in sustainability efficiency in port cities, the Tfpch of 10 port cities from 2018 to 2021 was calculated and indexed by the MPI model. The year 2018 was taken as the technical reference. The summary of the Malmquist index of annual geometric means is presented in Table 5. On average, Tfpch decreased by 0.8%, among which Effch, Pech, and Sech decreased by 0.9%, 0.5%, and 0.4%, respectively, and Techch increased by 0.1%. During the period 2018 to 2021, 7 (i.e. 70%) port cities had Tfpch > 1, indicating growth in Tfpch, and 3 (i.e. 30%) port cities had Tfpch < 1, indicating a deterioration in Tfpch. From Table 6 and Fig. 4., it can be seen that the most efficient port city is Shenzhen Port, which is largely the result of technical changes, demonstrating the use of advanced infrastructure or the implementation of the green port. Therefore, in Shenzhen Port, the main driving force of Tfpch is technological progress.
On the other hand, the results in Fig. 4. also indicate that the Tfpch values of Yingkou, Dalian, and Tianjin are less than 1. Corresponding measures need to be taken to prevent the continuous decline in sustainability efficiency.
Specific analysis of the data reveals that both Yingkou and Tianjin ports have witnessed a decline in technical changes. Yingkou Port experienced a significant decrease of 25.3%, while Tianjin Port’s decline was relatively lower at 13.1%. These declines indicate that both ports have moved back from their production possibility frontier, representing the maximum production that a port can achieve given its current resources and technology. This suggests a decrease in efficiency and productivity. In the case of Yingkou and Tianjin ports, the decline in technical changes indicates a decrease in their ability to utilize their resources efficiently and effectively. These ports must adopt innovation policies and talent introduction programs. Technological changes and setbacks are common challenges for ports, and embracing innovation is vital for their sustainability and efficiency. By investing in research and development, these ports can stay updated with the latest technological advancements and improve their operational processes. By attracting skilled professionals and experts in the field, the ports can benefit from their expertise and knowledge. These talented individuals can bring fresh ideas, implement innovative strategies, and contribute to the overall improvement of the ports’ operations. They can, therefore, regain their position on the production possibility frontier and increase their overall performance.
Table 5.
Malmquist Index Summary Of Annual Means Results
| Years | Effch | Techch | Pech | Sech | Tfpch |
|---|---|---|---|---|---|
| 2019 | 1.012 | 0.954 | 1.000 | 1.012 | 0.966 |
| 2020 | 0.970 | 1.009 | 0.992 | 0.978 | 0.978 |
| 2021 | 0.991 | 1.041 | 0.992 | 1.000 | 1.032 |
| mean | 0.991 | 1.001 | 0.995 | 0.996 | 0.992 |
Table 6.
Malmquist Index Model results of 10 Chinese port cities over the years 2018-2021
| Port cities | Efficiency |
|---|---|
| Yingkou | 0.747 |
| Dalian | 0.859 |
| Xiamen | 1.033 |
| Yantai | 1.098 |
| Tianjin | 0.869 |
| Qingdao | 1.067 |
| Guangzhou | 1.048 |
| Shenzhen | 1.127 |
| Ningbo-Zhoushan | 1.082 |
| Shanghai | 1.068 |
Dalian Port has witnessed a regression in various aspects, including Effch, Techch, Pech, and Sech. To address these challenges and propel the port toward sustainable growth, it is crucial to implement relevant policies that incentivize innovation and talent introduction. To overcome the regression in technological change, the port authority should actively promote research and development activities, encouraging collaboration between academia, industry experts, and technology companies. By fostering innovation, Dalian Port can stay ahead of the technological curve and drive positive change within the industry. They should implement policies that promote talent introduction, such as offering attractive incentives and creating a conducive work environment. They should also prioritize research and development in port city sustainability technology, including exploring new solutions for energy efficiency, waste management, reduction of emissions, and environmental conservation. By adopting sustainable technologies, Dalian Port can minimize its environmental impact and contribute to a greener future. To address pure technological efficiency changes and pure technological changes, Dalian Port needs to strengthen its sustainability management practices. The port authority should establish robust frameworks and policies to monitor and evaluate technological efficiency. This includes regularly assessing the port’s energy consumption, waste generation, and emissions. Dalian Port can identify areas for improvement and implement strategies to optimize its technological efficiency by monitoring these factors.
Conclusions
The evaluation of sustainable development efficiency in port cities is crucial for ensuring the long-term success of these cities. By examining economic, social, and environmental performance, port cities can identify areas for improvement and take steps to address these issues. Therefore, in this paper, we assessed the port cities’ sustainability efficiency through the super-efficiency SBM DEA and Malmquist Index models over the years 2018- 2021. Our research was constrained by the lack of available data on port cities. Due to the limited availability of data, we have focused our study on ten benchmark Chinese port cities. The conclusions are as follows: first of all, taking into account the data collected and the empirical result, the sustainability efficiency of seven port cities is found to be at a good level, i.e. efficient, and three sustainability inefficient. Then, the Malmquist Index results showed that port cities experienced a decline in the total factor efficiency productivity over the years 2018 to 2021, which mainly resulted from the low Effch, Pech, and Sech.
For the inefficient port cities, it was found that they were affected by the number of berths, quay length, container throughput, DUS and SO2 emissions, cargo throughput, water waste emissions, and GDP growth. Port authorities have to monitor and evaluate these aspects to ensure continued progress and success in achieving sustainability goals. There is a need to optimize management methods to improve the efficient use of funds and to redouble efforts to build capacity in environmental pollution prevention, ecological restoration, water control, and sustainable drainage. It was also found that the sustainability of Chinese port cities is less than 1, indicating that efficiency needs to be improved by optimizing port operations management, organization, and policy.
Our conclusion, therefore, allows us to put forward the suggestions below to provide benchmarks for the sustainable development of port cities:
– The implementation of green infrastructure and activities to reduce the impact of port operations on the environment. This involves the use of sustainable energy supplies, including wind and solar power, to decrease GHG emissions (Greenhouse gas emissions) and air pollution.
– The port city must be developed in a way that provides economic benefits to the local community and the country as a whole. This can be achieved by ensuring that the port is well connected to the rest of the country, providing employment opportunities, and promoting local businesses.
– Additionally, sustainable development requires the integration of port operations with the surrounding urban environment. This is achieved by creating green areas and parks, as well as by developing public transportation. It also involves the implementation of measures to mitigate noise and other negative externalities associated with port activities. The performance policy for port cities should be enhanced, enabling them to autonomously assess and regulate their internal performance.
Ultimately, a holistic approach incorporating environmental, economic, and social factors is necessary to achieve sustainability in port cities. By promoting green infrastructure, social equity, and urban integration, port cities can thrive in a way that benefits both their residents and the environment. In addition to inspiring further research on the sustainability of port cities, we hope that it will contribute to a more sustainable future for all.

