

Introduction
With the development of industrialization, the global ecosystem is facing serious threats. Environmental problems such as climate warming, excessive resource consumption, and increased pollution are frequent and seriously threaten the ecological and environmental balance [1]. The Global Climate Report shows that the global average temperature in 2023 has risen by about 1.1ºC compared with pre-industrial times, and it is expected to rise by more than 3ºC by the end of the 21st century. Against this background, in order to improve global ecological resilience, the member states of the United Nations have further promoted the implementation roadmap of the Paris Agreement, aiming to strengthen the emission reduction commitments of various countries and ensure that global warming is limited to 1.5ºC, thereby effectively alleviating the impact and pressure of climate change on the ecosystem. In addition, countries around the world have also introduced various environmental policies. The UK passed the Climate Change Act in 2008, which innovatively proposed the establishment of electronic personal greenhouse gas emission credit accounts and emission credit quotas. In 2011, the United States passed the Clean Energy Act, gradually transitioning from a carbon tax to a national carbon trading market. The European Union launched the European Green Deal in 2019, aiming to achieve carbon neutrality by 2050.
In response to international calls, China has issued a series of carbon reduction policies to enhance ecosystem resilience. As a new practice of green and innovative development concepts, carbon reduction pilot policies such as “low-carbon cities” and “new energy demonstration cities” undoubtedly play a supportive role in China’s sustainable development, but their focuses are different. For instance, the construction of a “low-carbon city” focuses on alleviating ecosystem pressure by reducing carbon emissions, while the “new energy demonstration cities” aim to foster sustainable urban transformation by accelerating the adoption and innovation of renewable energy technologies.
While considerable discourse exists within academia regarding the efficacy of the single pilot policies for both “low-carbon cities” and “new energy demonstration cities,” there is a notable gap in research concerning the dual pilot approach. Is the development of dual pilot cities more impactful than their single counterparts? What are the sequential pathways and mechanisms at play? Addressing these inquiries holds substantial importance. Consequently, this paper employs an asymptotic difference-in-differences model to investigate the influence of the carbon emission reduction dual pilot policy on urban ecological resilience, which is pivotal for refining carbon reduction pilot initiatives and advancing ecological sustainability.
This study seeks to address the following five pivotal inquiries:
(1) How does the dual pilot policy of carbon emission reduction affect urban ecological resilience in 285 cities in China?
(2) What distinguishes the carbon emission reduction “single pilot” policy from the “dual pilot” policy in enhancing urban ecological resilience? Within the trajectory of the carbon emission reduction dual pilot policy, which sequence proves more efficacious: transitioning to a “low-carbon city” pilot before adopting the “new energy demonstration city” designation or vice versa?
(3) Do industrial structure, scientific and technological research, and development levels play a mediating role in the carbon emission reduction dual pilot policy and ecological resilience?
(4) What are the differences in the impact of carbon reduction pilot policies on urban ecological resilience among 285 cities in China, between developed and ordinary cities, and between resource-based and non-resource-based cities?
(5) Is there dynamic heterogeneity in the effectiveness of carbon reduction pilot policies among 285 cities in China?
Literature Review
The etymology of the term “resilience” traces back to the Latin word “resilio”, which subsequently evolved into the English term “resilience,” denoting the notion of “returning to a prior state” [2]. In 1973, Holling was the first to broaden the application of “resilience” to the realm of natural ecology, thereby establishing the concept of ecological resilience [3]. Currently, the discourse surrounding urban ecological resilience primarily bifurcates into two theoretical frameworks: equilibrium theory and evolution theory. The equilibrium theory believes that urban ecological resilience is the process in which the urban ecosystem resolves crises to the greatest extent, reorganizes the system structure after being disturbed, and finally reaches a new ecological balance [4]. However, the evolution theory no longer emphasizes the restoration of the ecosystem to a balanced state but emphasizes the ability of the ecosystem to achieve sustainable development by adjusting the structure and changing the path. It has three important characteristics: resistance, adaptability, and resilience [5]. The existing methods for measuring the level of ecological resilience mainly include the indicator system evaluation method [6], the coupled coordination model analysis method [7], the comprehensive framework analysis method [8], the neural network simulation method [9], etc. Regarding the influencing factors and mechanisms of ecological resilience, existing research suggests that urbanization can affect ecological resilience through population growth, land use changes, and infrastructure construction [10]; climate change poses a significant threat to urban ecosystems, and building climate-adaptive cities through measures such as green innovation can enhance urban ecological resilience [11].
As the government and academia pay more and more attention to environmental issues, scholars have increasingly studied carbon reduction policies [12]. Internationally, in 2019, the European Union launched the Green Deal, aimed at promoting the transition of the European economy towards green and low-carbon development. This policy effectively enhanced Europe’s energy security and industrial competitiveness [13]. Following closely behind, the United States deployed a clean energy plan in 2021, which not only enhanced energy security but also created numerous job opportunities by promoting energy transition and reducing carbon emissions [14]. The many carbon reduction policies adopted by China have also received widespread attention [15], and the pilot policies of “low-carbon cities” and “new energy demonstration cities” are closely related to this manuscript. Existing literature can be divided into macro and micro perspectives. From a macro perspective, previous studies have found that low-carbon city pilot policies have spatial spillover effects, which can simultaneously enhance the environmental welfare performance of both the local and surrounding areas [16]. Meanwhile, the construction of low-carbon cities can significantly narrow the economic gap between non-central and central cities [17]. From a micro perspective, scholars have confirmed that low-carbon city pilot policies play a significant role in curbing corporate emissions [18], and low-carbon city pilots can promote the digital transformation of enterprises by alleviating financing constraints, promoting green output, and increasing demand for green products [19]. Secondly, research on the pilot policy of “New Energy Demonstration Cities”. Early relevant literature focused on analyzing the theory and methods of planning new energy demonstration cities [20], while later research shifted towards quantitative evaluation to measure the policy effects of pilot “new energy demonstration cities” [21]. Thirdly, research on the dual pilot policies for carbon emission reduction. At present, there is limited literature on dual policies [22]. Previous studies have explored the promoting effect of dual pilot policies for low-carbon and innovative cities on residents’ green lifestyle transformation [23].
The academic community has conducted many discussions on urban ecological resilience and carbon reduction policies, achieving fruitful research results. However, there is still room for further research: (1) Most existing literature explores the impact of a single policy perspective on ecological resilience, and there is little research analyzing the linkage effects of multiple policies on ecological resilience. For carbon reduction policies, various systems are usually closely linked and inseparable. If the implementation effect of a single policy is examined from an isolated perspective, biased conclusions may often be drawn. (2) Most of the literature featuring indicator system evaluation methods to measure ecological resilience uses a single method to calculate indicator weights, and the measurement results often have significant biases. Clarifying these research gaps provides a clearer direction and goal for the development of this article. The prospective marginal contributions of this paper are chiefly threefold: (1) Expanding the research perspective on the “synergistic effect” inherent in carbon reduction policies. By examining the interconnection between “low-carbon city” and “new energy demonstration city” initiatives, this study enhances the understanding of how these dual pilot policies collectively influence urban ecological resilience. (2) Pioneering an inquiry into the sequence in which carbon reduction policies exert their effects. By analyzing the order of implementing the carbon emission reduction “dual pilot,” this paper investigates whether prioritizing decarbonization or transformation is more effective in bolstering urban ecological resilience. (3) Based on using the game theory combination weighting method to measure urban ecological resilience, a difference-in-differences model was applied to explore the main mechanisms of the impact of carbon reduction dual pilot policies on urban ecological resilience from the perspectives of structural and technological effects and revealed the potential reasons for the heterogeneity of the empowering effects of the carbon emission reduction dual pilot policies.
Policy Background and Research Hypothesis
Policy Background
China is currently navigating a pivotal phase of sustainable economic transformation. Energy efficiency and emission reductions are strategic imperatives for fostering sustainable economic growth, and the Chinese government places significant emphasis on this initiative. In the 11th Five-Year Plan, the government set binding energy conservation objectives for the first time. Subsequently, during the United Nations Climate Change Conference in Copenhagen, it reiterated its pledge to cut carbon emissions per unit of GDP by 40%-45% relative to 2005 levels by 2020, highlighting its commitment to addressing climate change and promoting sustainable development. Against this backdrop, the Chinese government has implemented three waves of “low-carbon city” pilot initiatives. According to the World Wildlife Fund, a low-carbon city is a city that sustains energy consumption and carbon dioxide emissions at minimal thresholds while fostering vigorous economic growth. In 2010, China’s National Development and Reform Commission issued the “Notice on the Pilot Work of Low-Carbon Provinces and Cities,” launching the “low-carbon city” pilot program in five provinces, including Guangdong and Yunnan, along with eight cities, such as Shenzhen and Hangzhou. The scope of these pilots was further expanded in 2012 and 2017, increasing the number of pilot cities to 87.
Furthermore, to facilitate the transition of urban economic development models from traditional high-pollution sectors to high-value-added, low-resource-consuming clean energy industries, the Chinese government has been vigorously advancing the establishment of new energy demonstration cities over the past decade. In January 2014, China’s National Energy Administration released the pilot roster of “New Energy Demonstration Cities”, mandating these pilot cities to prioritize the adoption of clean energy, encourage diverse new energy sources, including wind, solar, nuclear, and geothermal energy, and enhance the development of smart grids to support the growth of emerging sectors such as electric vehicles and energy storage technologies. The “New Energy Demonstration City” pilot initiative serves as a crucial strategic measure to foster the growth of new energy industries, optimize energy structures, and facilitate green transformation. Its objective is to enhance energy efficiency and reduce carbon emissions by promoting the implementation and demonstration of new energy technologies in select cities.
Theoretical Analysis
Urban ecological resilience refers to the adaptive capacity of urban ecosystems to withstand, adapt, and recover in a timely manner when facing threats and oppression from themselves or the outside world. The carbon emission reduction dual pilot policy can bolster urban ecological resilience, manifested in the following three dimensions: First, the dual pilot can enhance the resistance of urban ecosystems. According to institutional economics theory, good institutional design helps to solve environmental problems and improve resource utilization efficiency [24]. Carbon emission reduction policies have established an effective carbon market mechanism through institutional innovations such as market-oriented means, which promote the rational allocation of emission rights and the effective use of resources, reduce the total carbon emissions of cities, and enhance the resistance of cities in the face of environmental uncertainties. Second, the dual pilot can enhance the adaptability of urban ecosystems. Carbon emission reduction policies can promote the transformation of urban economic structure to a green economy, forcing high-emission industries to reduce their scale or carry out technological transformation, while low-carbon industries receive more resource support and encourage the development of environmental protection industries such as clean energy and circular economy through resource allocation effects, making the urban economic system more diversified and environmentally friendly, which helps to enhance the stability and adaptability of the ecosystem. Third, the dual pilot can enhance the resilience of urban ecosystems. Carbon reduction policies are usually accompanied by government incentives for technological innovation, such as R&D subsidies and policy support for green technology applications, which encourage companies to invest in clean energy technologies such as solar and wind energy and energy-saving and emission reduction technologies, improve energy efficiency through technological innovation effects, reduce dependence on fossil fuels, and enhance the self-recovery ability of ecosystems in the face of environmental crises. Combining the above three paths, we propose research hypothesis 1:
Hypothesis 1: The dual pilot policy for carbon emission reduction can enhance urban ecological resilience.
The dual pilot policy for carbon emission reduction can enhance urban ecological resilience by promoting industrial structure upgrading. First, the dual pilot policy for carbon emission reduction can promote upgrading industrial structure. On the one hand, the carbon emission reduction dual pilot policy can play a demonstration effect by implementing low-carbon and new energy projects [25], highlighting the impact of green tech and renewable energy, inspiring other cities to emulate, and driving urban industrial structures toward greater eco-friendliness. On the other hand, according to the theory of environmental externalities [26], the dual pilot policy for carbon emission reduction can prompt enterprises to internalize environmental costs through environmental protection legislation and other means. This, in turn, encourages them to invest in clean technology and renewable energy, driving their transformation to a more eco-friendly industrial structure. Secondly, upgrading industrial structures can enhance the ecological resilience of cities. Based on the theory of ecological efficiency, industrial upgrading through clean production technology and circular economy models can optimize resource use, cut waste, and reduce cities’ reliance on natural resources and ecological strain. This enhances urban ecological resilience against environmental pressures. Therefore, we propose research hypothesis 2:
Hypothesis 2: The dual pilot policy for carbon emission reduction can enhance urban ecological resilience by promoting industrial structure upgrading.
The dual pilot policy for carbon emission reduction can enhance urban ecological resilience by promoting scientific and technological research and development compensation. First, the dual pilot policy for carbon emission reduction can promote compensation for scientific research and development. The dual pilot policy for carbon emission reduction has spurred demand for clean technology and renewable energy. It prompts governments to boost investment in related R&D and attracts private sector funding via incentives, creating a synergy that jointly propels technology innovation and R&D compensation. Secondly, on the one hand, technology R&D compensation provides important financial incentives for R&D institutions, significantly reducing the costs and risks of technological innovation, allowing R&D institutions to invest more resources in green technologies and ecological solutions, thereby optimizing resource allocation and improving Green innovation efficiency promotes the restoration and maintenance of urban ecosystems. On the other hand, increased R&D investment drives technological progress and eco-friendly project implementation, enhancing urban ecological resilience via a positive feedback loop. Therefore, we propose research hypothesis 3:
Hypothesis 3: The dual pilot policy for carbon emission reduction can enhance urban ecological resilience by promoting scientific and technological research and development compensation.
Materials and Methods
Data Sample
Explained Variable
Urban ecological resilience (eco-resilience). Referring to the study by Zhang C. [27], a comprehensive index system for urban ecological resilience is established, which assesses urban ecological resilience from three dimensions: resistance, adaptability, and recovery. (1) Resistance pertains to the capacity of urban ecosystems to endure external stressors, where indicators such as soil erosion degree and human disturbance index reflect external disturbance [28], and the share of wastewater discharge, SO₂ emissions, and smoke and dust emissions in relation to total industrial output serve as proxies for environmental load [29]. (2) Adaptability captures the ecosystem’s ability to maintain cyclical functions when facing disturbances. Indicators such as sewage treatment rate and solid waste utilization rate represent waste mitigation effectiveness [30], while metrics like air quality, urban greening rate, ecological land protection, and per capita park greenery signify the state of environmental stewardship [31]. (3) Resilience emphasizes the extent to which urban ecosystems recover following shocks, where intensity of environmental regulation and ecological governance investment serve as indicators of ecological governance investment [32], and the advancement of green technology level, green transformation of the three wastes, and green industry development denote ecological governance output. To mitigate the limitations of a single weight determination method, this study employs a game-theory-based combined weighting technique, incorporating subjective weights derived through the Analytic Hierarchy Process and objective weights obtained via the Entropy Weight Method, thereby enhancing the robustness and credibility of the evaluation outcomes. The estimated coefficients for subjective and objective weighting are 0.4891 and 0.5109, respectively. The weight values of each indicator are detailed in Table 1.
Core Explanatory Variables
Binary variables representing the carbon emission reduction dual pilot initiative (DID). The experimental group setting rule is that if a city is determined as a dual pilot city of “low-carbon city” and “new energy demonstration city”, the DID value in subsequent years is 1; otherwise, it is 0. The control group is the rest of the sample cities, and the DID value is 0. Similarly, the single pilot policy dummy variables of “low-carbon city” (carbon) and “new energy demonstration city” (energy) are set. The single pilot city is used as the experimental group. The city is assigned a DID value of 1 in the year and subsequent years of the policy establishment; otherwise, it is 0. The city where neither policy is implemented is used as the control group, and the DID value is 0.
Control Variables
In order to control for other overlooked factors that may affect urban ecological resilience, we have selected the following control variables: (1) Digitization: Prior researchers have discovered that digitization can enhance ecological efficiency and foster green sustainable development [33]. Therefore, we use the number of Internet users to measure the level of digitalization. (2) Opening up to the outside world: Some researchers argue that the growth of foreign trade can have a substantial impact on environmental concerns [34]. Therefore, we use the amount of foreign investment in the current year’s contract to measure the level of opening up to the outside world. (3) Population quality: Prior research has indicated that human capital is crucial in mitigating ecological degradation [35]. Therefore, we use education expenditure to measure the quality of the population. (4) Economic development: Scholars have found that economic growth has a significant impact on the ecological environment [36]. Therefore, we use the regional GDP growth rate to measure economic development. (5) Political will: A city’s political will may have an impact on improving its ecological environment. The construction of digital government reflects the government’s governance level, progressiveness, and attitude in the digital economy era, so we use existing research to measure political will by using the dummy variable of whether the city is a pilot of “e-government” reform [37]. (6) Governance structure: The ecological resilience of a city may be influenced by the local governance structure. Previous studies have shown that the reform of “streamlining administration, delegating powers, and improving services” can optimize the governance structure [38]. Therefore, we use the virtual variable of whether the city is a pilot for the “streamlining administration, delegating powers, and improving services” reform to measure the governance structure. (7) Local environmental history: The resilience of urban ecosystems may be affected by the local historical environment. Therefore, we use the lagged one period of the local environmental pollution index to measure the local historical environment. The calculation method is the average industrial wastewater, sulfur dioxide, and smoke emissions in the region in the previous year [39].
Table 1.
Urban Ecological Resilience Index Evaluation System.
Mechanism Variables
Referring to existing research [40], we identified the following mechanism variables: (1) Industrial structure enhancement. The industrial structure enhancement index serves to quantify the level of industrial development, with higher values indicating a more advanced industrial framework. The specific calculation formula is: industrial structure enhancement index = primary industry value added * 1 + secondary industry value added * 2 + tertiary industry value added * 3. (2) Scientific and technological R&D compensation. A city’s investment in scientific research can reflect the city’s scientific and technological R&D compensation to a certain extent. Therefore, we use scientific expenditure to measure the city’s scientific and technological R&D compensation.
Descriptive Statistics of Variables
Table 2 delineates the descriptive statistics for the variables. The article selected panel data from 285 cities in China as the research sample (the “China Urban Statistical Yearbook” includes statistical data from 300 cities in China, and we excluded 15 cities with significant data missing, such as Sansha, Danzhou, and Bijie, and selected the remaining 285 cities as the research objects). The average eco-resilience is quantified at 0.028, indicating that the typical ecological resilience level of the sampled cities from 2008 to 2022 is 0.028. Eco-resilience’s minimum, median, and maximum values are recorded at 0.005, 0.014, and 0.534, respectively. Notably, the maximum value is 38 times the median and 107 times the minimum, indicating that the ecological resilience of the majority of cities has considerable potential for enhancement. All data utilized in this study are sourced from the WIND database, CSMAR database, China City Statistical Yearbook, and other relevant resources. The subsequent measurement process in this article standardized all raw data presented in the Table 3. The formulas for standardization of positive and negative indicators are as follows:
Among them, Z+ and Z– represent the positive and negative normalized values of the sample, respectively, Xmin indicates the lowest value of the sample, whereas Xmax denotes the highest value of the sample.
Table 2.
Variable definitions.
Table 3.
Variable definitions.
Model Settings
Game Theory Combination Weighting Model
Game theory is a mathematical modeling method for studying conflicts and cooperation among rational decision-makers. Compared with other combination weighting methods, the game theory combination weighting method can minimize the deviation between subjective and objective weights and combination weights and maximize the value of subjective and objective weights. The core lies in determining the weighted combination weights of the Analytic Hierarchy Process (subjective weighting method) and the Entropy Weight Method (objective weighting method). This article uses the game theory combination weighting method to assign weights to the indicator system. The specific calculation steps are as follows:
Assuming that L methods are used to assign weights to two indicators separately, L sets of indicator weight vectors are obtained. Assuming that the weight vector obtained by the i-th weighting method is
In formula (3), α1 represents the weight of the indicators obtained by the Analytic Hierarchy Process (AHP) and ω1T represents the weight vector of the indicators obtained by the AHP. The index weights obtained by the entropy weight method are represented by α2, and ω2T is the index weight vector obtained by the entropy weight method. According to the equilibrium theory of game theory, the key to obtaining the optimal solution for weighted combination weights is to minimize the deviation between the indicator weight vector ω* and the weight vectors ωi determined by each weighting method. From this, the combined weights α1* and α2* of the Analytic Hierarchy Process (AHP) and Entropy Weight Method can be calculated, and the specific formula is:
In formula (4), when i = 1 and 2, ω1T represents the indicator weight vectors of the Analytic Hierarchy Process (AHP) and Entropy Weight Method, respectively. By combining formulas (4) and (5), α1* and α2* can be obtained. By substituting the two into formula (3), the combination weight vector ω* of the game theory combination weighting method can be obtained.
Benchmark Regression Model Setting
The double difference model utilizes individual data regression to assess the statistical significance of the policy’s impact. This traditional double difference model comprises two datasets: the treatment and the control groups. The asymptotic difference model is an extended form of the traditional difference-in-differences model, suitable for handling situations where policies or interventions are gradually implemented at different time points. Due to the phased establishment of China’s “low-carbon city” policy pilot and “new energy demonstration city” policy pilot, with some overlapping pilot cities, in order to investigate the impact of China’s dual pilot policies of “low-carbon city” and “new energy demonstration city” on urban ecological resilience, we employ the asymptotic difference-in-differences model to juxtapose the policy outcomes of pilot cities against those of non-pilot cities, establishing the following baseline regression model:
In formula (6), i and t represent cities and years, respectively; Eco – resilienceit represents urban ecological resilience; DIDit is the core explanatory variable, dual pilot. When the value is 1, this means that city i is a dual pilot of “low-carbon city” and “new energy demonstration city” in year t. In other cases, the value is 0. α1 represents the marginal contribution of the dual pilot projects to urban ecological resilience. If the value is positive, it means that the dual pilot projects can have a positive impact on urban ecological resilience. Xit is a series of control variables, μi is the individual fixed effect, γt is the time fixed effect, and εit is a random disturbance term.
Space Double Difference Model Setting
Furthermore, in order to estimate the spatial spillover effects of the carbon reduction dual pilot policy on urban ecological resilience, this paper sets up the following spatial double difference model for testing:
In formula (7), we constructed a spatial geographic inverse distance matrix for analysis of the spatial weight matrix, and the other variables are defined as above.
Results and Discussion
Parallel Trend Test
The double difference estimation approach yields robust conclusions by mitigating the disturbances caused by model endogeneity; however, it necessitates adherence to the parallel trend assumption. This implies that the samples from both the experimental and control groups should display an identical temporal trajectory prior to the policy’s enactment, with no significant disparities or relatively stable difference trends. Accordingly, this paper adopts the research framework of Wang Q [41] and conducts a parallel trend examination using the event study methodology. We designate the four years preceding the introduction of the carbon emission reduction dual pilot policy as the benchmark group, while the four years following its initiation serve as the control group. The specific model configurations are outlined as follows:
In formula (8) Ppre_n, Pcurrent, and Ppost_n represent the interaction terms of the dummy variables and the policy dummy variables before, during, and after implementing the carbon emission reduction dual pilot policy, βpre_n, βcurrent, and βpost_n are the corresponding observation coefficients. The changes in urban ecological resilience before and after becoming a dual pilot are shown in Fig. 1. It can be seen from Fig. 1 that the impact of becoming a dual pilot in the year and before on urban ecological resilience did not pass the significance test within the 99% confidence interval, which means that during this period, the treatment group and the control group had the same trend in the impact on urban ecological resilience, but one year after becoming a dual pilot, the disparity between the treatment group and the control group was substantial, and the policy effect was sustained, thus fulfilling the parallel trend assumption.
Benchmark Regression
This paper uses the incremental double difference estimation method to conduct a benchmark regression on the dummy variables of the dual pilot policies of “low-carbon city” and “new energy demonstration city” and urban ecological resilience. The results are shown in Table 4. Column (1) is a regression with the policy dummy variable, namely the dual pilot, as an explanatory variable, but no control variables are added. The econometric findings indicate that the regression coefficient is markedly positive at the 1% significance level. Gradually incorporating each control variable from column (2) to column (8) for regression, the estimated coefficients of DID passed the significance test at the 1% level, and the values were positive. This indicates that the dual pilot program significantly promotes the improvement of urban ecological resilience, and hypothesis 1 has been verified. Meanwhile, under the estimation of the bidirectional fixed effects model with all control variables added in column (8), the regression coefficient of the variable DID is 0.006, which is smaller than the 0.026 shown in column (1), indicating that the impact of policy effects has weakened to some extent, indicating that there are indeed factors affecting urban ecological resilience in the selected control variables in this article.
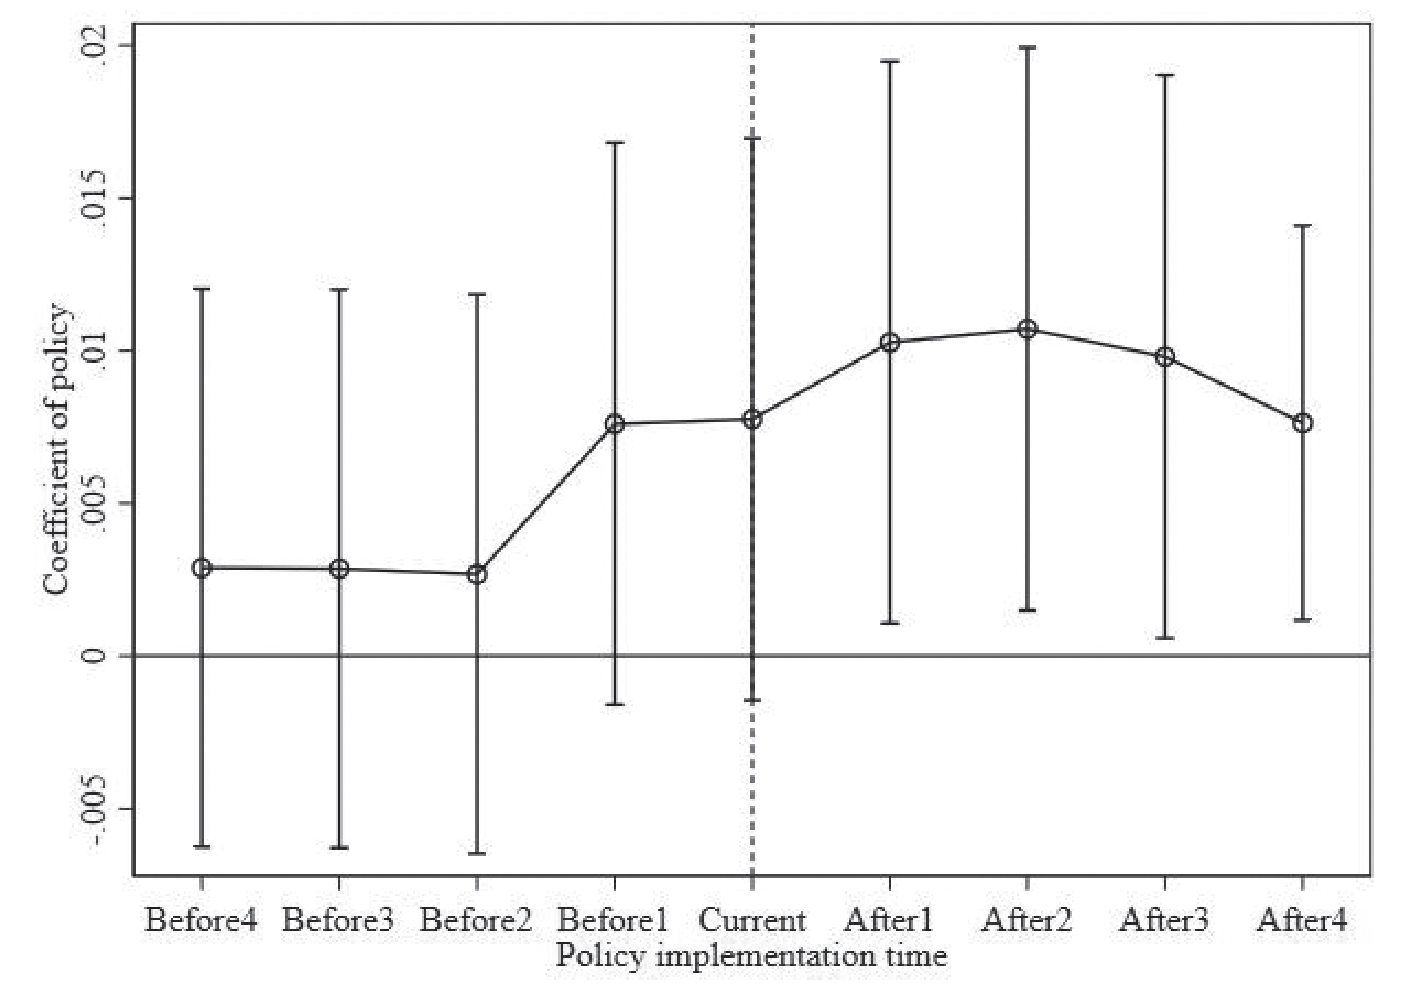
Table 4.
Benchmark regression results.
Robustness Test
Placebo Test
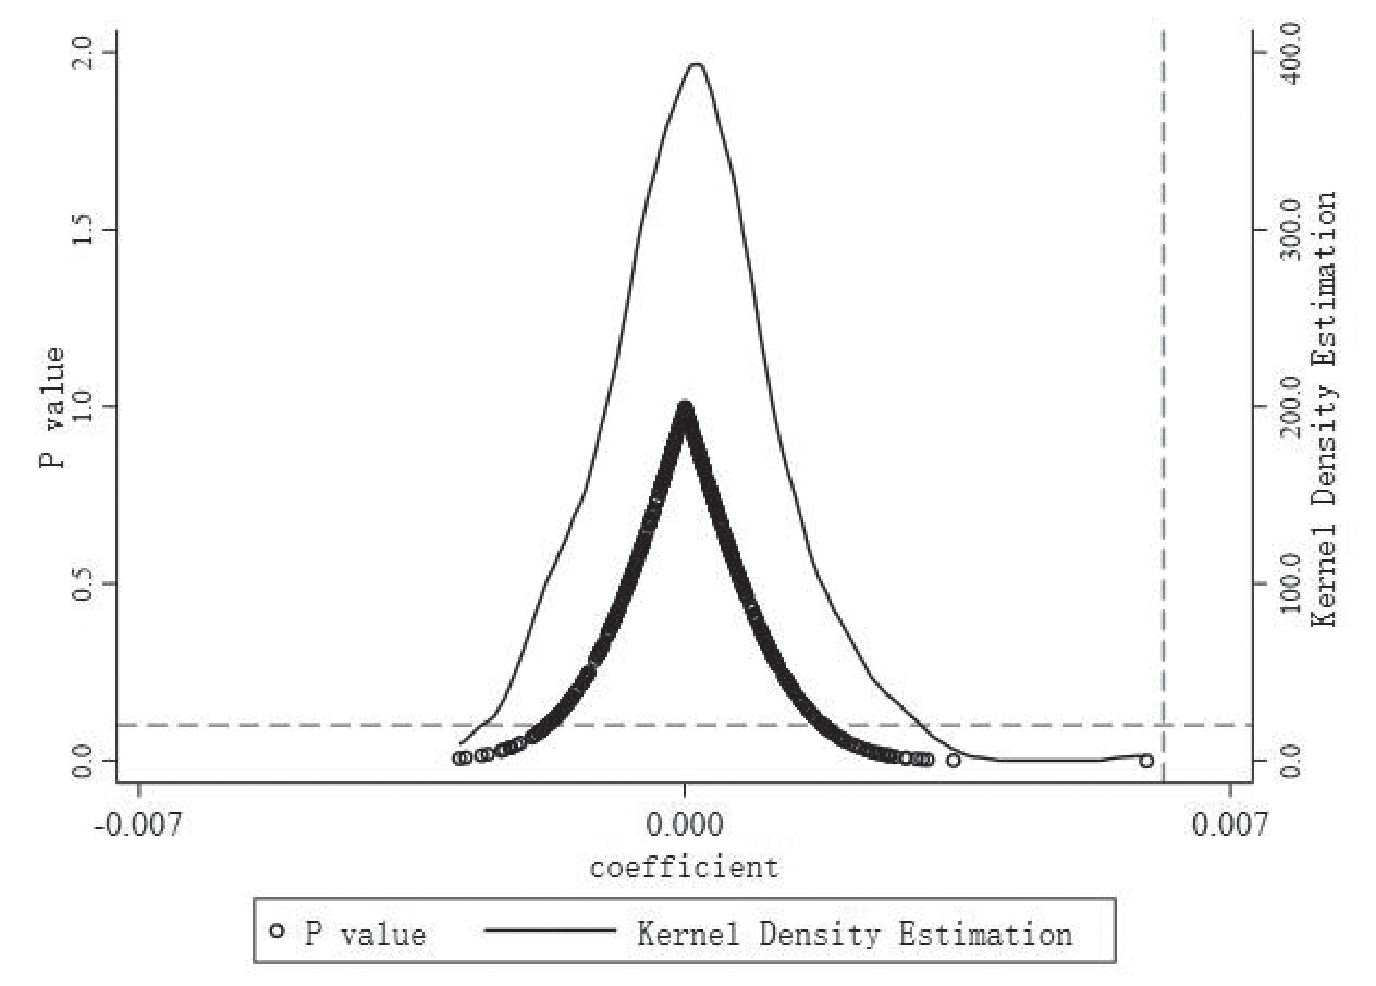
The presence of unaccounted confounding events may introduce distortions in the evaluation of the policy’s impact. Accordingly, we randomly selected a subset of individuals from the overall sample without replacement to act as “pseudo-treated individuals” and conducted regression analysis in accordance with formula (6). This procedure was executed 500 times to generate 500 estimated coefficients for the pseudo “double pilot”. Fig. 2 presents the findings from the placebo test. The estimated coefficients for the carbon emission reduction double pilot policy on urban ecological resilience within the random experimental group cluster are around 0, markedly deviating from the true coefficient of 0.006. Furthermore, the majority of the estimated coefficients yield P values exceeding 0.1, indicating that the estimated effect lacks statistical significance. This implies that the influence of the carbon emission reduction double pilot policy in enhancing urban ecological resilience remains unaffected by other unobserved factors, thereby affirming the robustness of the baseline regression outcomes.
Replace the Core Explanatory Variable
To avoid selective bias of the core explanatory variables, we excluded the “single pilot” sample cities and used the “no pilot” sample cities as the control group and the “dual pilot” sample cities as the experimental group to replace the core explanatory variables and estimate the regression results. As shown in column (1) of Table 5, the estimated coefficient of DID is 0.008 and significant at the 1% level. This result is basically consistent with the benchmark regression result, indicating that the conclusion that the carbon reduction dual pilot policy can enhance urban ecological resilience is robust.
Replace the Explained Variable
To ensure that the conclusion does not change due to measurement errors or differences in definitions of the dependent variable, we employed the entropy weight criterion method to reassess urban ecological resilience. Subsequently, the recalibrated urban ecological resilience was regressed against the independent variable. The regression findings are presented in column (2) of Table 5. At this juncture, the difference-in-differences (DID) approach and urban ecological resilience continue to exhibit a positive correlation at the 1% significance level. This indicates that the carbon emission reduction dual pilot policy can substantially enhance urban ecological resilience, thereby affirming baseline regression’s robustness.
Control-Related Policy Interference
During the sample period from 2008 to 2022, China successively issued multiple policy measures related to decarbonization and transformation, among which the pilot policies of “carbon emissions trading” and “innovative cities” are closely related to the content of this study. Given that the two aforementioned policies might influence cities’ decarbonization transformation, we introduced them as dummy variables for control and performed an additional regression analysis on the sample. The regression results are shown in columns (3) and (4) of Table 5. From this, it can be seen that after controlling for whether the sample cities implement “carbon emission trading” and “innovative city” pilot programs, the estimated coefficient value of DID is still significant at the 1% level, and the coefficient of the dummy variable of the “innovative city” pilot policy is also significantly positive. This indicates that the conclusion that the carbon reduction dual pilot policy can enhance urban ecological resilience still holds true after controlling for relevant policy interference, and the “innovative city” pilot policy also helps to improve urban ecological resilience.
PSM-DID Test
When creating dual pilot cities, the government might use criteria like urban development scale, natural resource endowment, and economic openness to select pilot cities, which could introduce selection bias into the samples and distort the benchmark regression results. We employ the PSM-DID methodology to conduct robustness tests to mitigate the endogeneity issues arising from this bias. Initially, we utilize Digitalization, Openness, Population, Economy, Politics, Governance, and History as matching variables, applying the kernel matching technique to align the samples. Subsequently, the matched samples undergo re-regression analysis. The regression outcomes are presented in column (5) of Table 5. The estimated coefficient of the difference-in-differences (DID) approach in column (5) aligns with the estimated coefficient from the benchmark regression and remains significantly positive at the 1% level, indicating that the carbon emission reduction dual pilot policy substantially enhances urban ecological resilience. This confirms the robustness of the benchmark regression.
Eliminate Weak Endogeneity Samples
Considering that the unequal distribution of resources due to different administrative levels of cities may bias the baseline regression results, we will exclude municipalities and provincial capitals, which are regional political and economic centers, from the sample. Then, we will examine the impact of the carbon reduction dual pilot policy on the ecological resilience of ordinary cities. The findings presented in column (6) of Table 5 indicate that after removing samples with weak endogeneity, the estimated coefficient of the difference-in-differences (DID) approach remains significantly positive at the 1% level, and the robustness test results align consistently with the baseline regression outcomes.
Further Discussion
Synergistic Effects of Dual Pilot Projects
(1) Analysis of the policy effects of the single pilot project
Initially, we examine the influence of the “low-carbon city” pilot on urban ecological resilience. We selected cities that adopted the “low-carbon city” strategy alongside those that did not implement either policy, categorizing the cities that embraced the “low-carbon city” strategy as the experimental cohort and the others as the control cohort for regression analysis. The outcomes are illustrated in Table 6. The regression coefficient for the independent variable presented in column (1) is 0.004, which is statistically significant at the 1% level. This coefficient is lower than the baseline regression coefficient of 0.006 noted in Table 4, suggesting that the “low-carbon city” pilot does enhance urban ecological resilience, albeit the effect is less pronounced than that of the dual pilot. In columns (2) and (3), when the independent variables are lagged by one and two periods, respectively, the coefficients still exhibit a positive correlation, indicating that the “low-carbon city” policy maintains a persistent effect in fostering urban ecological resilience.
Table 5.
Robustness test.
Similarly, examine the impact of “new energy demonstration cities” on urban ecological resilience (Table 7). The impact coefficient of the “New Energy Demonstration City” policy on urban ecological resilience during the implementation period is 0.003, which is significant at the 5% level. The coefficient value is also lower than the benchmark regression coefficient value of 0.006 in Table 4, indicating that the promotion effect of the “New Energy Demonstration City” single pilot on urban ecological resilience is weaker than that of the dual pilot. Columns (2) and (3) show that after lagging the independent variables by one and two periods, respectively, the regression coefficients of the independent variables are both 0.003, and the t-test value has increased. This indicates that the policy effect of “new energy demonstration cities” has a certain time lag in improving urban ecological resilience. The underlying reason is that the “new energy demonstration city” policy represents an innovative approach to ecological governance, with primary objectives centered on cultivating new energy industries for production and supply while promoting the adoption of new energy solutions for end-user demand. In the process of implementing this policy, local governments need to continuously explore implementation paths that are in line with the actual situation in the region. Therefore, the policy has a certain time lag in its effect.
(2) Analysis of the sequential effects of the carbon emission reduction dual pilot policy
In this section, we investigate the variations in the trajectories of the dual pilot initiative—specifically, whether initiating as a “low-carbon city” pilot followed by a “new energy demonstration city” pilot (path 1) or vice versa (path 2) proves to be more effective in enhancing urban ecological resilience. Table 8 presents the validation results for path 1. We designate the dual pilot cities that first adopt the “low-carbon city” pilot designation as the experimental cohort, while the cities that have not enacted the policy serve as the control cohort, upon which we conduct regression analysis. The findings reveal that the regression coefficients for the current period, one lag period, and two lag periods of policy implementation are 0.005, 0.005, and 0.004, respectively, all exhibiting statistical significance at the 1% level.
Table 9 is the verification result of path 2. We take the dual pilot cities that first become the pilot of the “new energy demonstration city” as the experimental group and the cities that have not implemented the policy as the control group and regress the samples. The results show that the regression coefficients of the current period, the first lag period, and the second lag period of policy implementation are 0.021, 0.020, and 0.020, respectively, all of which are significant at the 1% level. The DID coefficient value and its significance level of path 2 are significantly greater than those of path 1. This shows that the dual pilot cities that first become the pilot of “new energy demonstration city” and then become the pilot of “low-carbon city” have a stronger and faster ecological resilience improvement effect. The reason is that the pilot strategy of “new energy demonstration city” can promote the construction and application of the new energy industry on both the supply side and the demand side, helping cities transform and upgrade from traditional industrial models to new clean industrial models, provide clean energy to the market through renewable energy technology innovation, and change the energy consumption mix, thereby suppressing carbon emissions from the source, enabling cities to better respond to the call of carbon reduction policies and carry out carbon reduction actions more quickly, thereby more effectively improving urban ecological resilience.
Table 6.
Analysis of the policy effects of a single pilot project of “Low Carbon City”.
Table 7.
Analysis of the policy effects of a single pilot project of “new energy demonstration cities”.
Table 8.
Analysis of the coordination effect of Path 1.
Mechanism Testing
As mentioned in the previous section on the impact mechanism, the main mechanisms by which the dual pilot policies of “low-carbon cities” and “new energy demonstration cities” affect urban ecological resilience are structural and technical effects. Based on this, this section will further conduct an empirical test on the impact mechanism. Drawing on the identification strategy for impact mechanism testing in the studies of existing research [42, 43], we further introduce mediating variables based on model (6) and construct the following mechanism testing model:
Table 9.
Analysis of the coordination effect of Path 2.
In formulas (9) and (10), the intermediate variable Mit represents the industrial structure variable (Industrial) and the scientific research and development variable (Scientific), while the other variables have the same meanings as in model (6). The results of the mechanism test are shown in Table 10. It can be seen that the regression coefficients of the dual pilot program for Industrial and Scientific are 0.005 and 0.017, respectively, both of which are significantly positive at the 1% level. This indicates that the dual pilot program significantly promotes the improvement of industrial structure and scientific research and development level. Columns (2) and (4) represent the regression results of the dual pilot program on urban ecological resilience after adding mediator variables. The results show that after adding mediator variables, the regression coefficients of DID are 0.004 and 0.003, respectively, which are lower than the regression coefficient of 0.006 in the benchmark regression results and significant at the 1% and 10% levels, respectively. The regression coefficients of Industrial and Scientific on urban ecological resilience are 0.449 and 0.196, respectively, both significant at the 1% level, indicating that both mediating variables play a partial mediating role. The mechanism test results prove that the dual pilot program improves urban ecological resilience through industrial structure enhancement and technological research and development compensation, and hypotheses 2 and 3 are validated.
Table 10.
Mechanism Test.
Heterogeneity Test
We divided the total sample into three regions: the eastern, central, and western regions. Through group regression, we examined the heterogeneous impact of carbon reduction dual pilot policies on urban ecological resilience due to geographical differences. The test results are shown in Table 11. The results show that the impact of the carbon reduction dual pilot policy on the ecological resilience of central and western cities is significantly positive at the 1% level, but the effect on the ecological resilience of eastern cities is not significant. The reason is that the industrial structure of eastern cities is relatively diversified, with a high proportion of tertiary and high-tech industries. The adjustment effect of the carbon emission reduction dual pilot policy on their industrial structure is relatively limited, and the marginal effect of improving ecological resilience is relatively small. On the one hand, cities in the central and western regions have abundant clean energy resources such as wind, solar, and hydropower. The dual pilot policy of carbon reduction can promote the development and utilization of clean energy, optimize the energy structure, reduce dependence on traditional fossil fuels, and effectively enhance the ecological resilience of cities in the central and western regions. On the other hand, there are collaborative mechanisms such as industrial transfer and ecological compensation between central and western cities and eastern cities. The dual pilot policy of carbon emission reduction has promoted the improvement of these collaborative mechanisms, indirectly enhancing the ecological resilience of central and western cities.
We categorized first-tier and second-tier cities as developed urban centers, while third-tier and lower cities were designated as ordinary urban areas. Employing group regression, we examined the heterogeneous impacts of the carbon emission reduction dual pilot initiative on urban ecological resilience, taking into account variations in urban development levels. The results presented in Table 12 indicate that the dual pilot has markedly enhanced the ecological resilience of both developed and ordinary cities, with a more pronounced effect observed in developed areas. This disparity arises from the robust financial, technical, and talent resources available in developed cities, which facilitate the effective implementation of the carbon reduction dual pilot initiative. Furthermore, developed cities feature advanced industrial frameworks, where the tertiary sector and emerging industries characterized by green and low-carbon attributes constitute a significant portion of their economic evolution. Consequently, these cities are better positioned to bolster urban ecological resilience through decarbonization and transformation. Conversely, ordinary cities predominantly rely on traditional, high-pollution, and high-consumption industries, facing considerable pressure for industrial transition. Additionally, these cities often lack high-caliber talent and an environment conducive to green innovation, resulting in a comparatively subdued impact of the carbon emission reduction dual pilot initiative on their ecological resilience in the short term.
Table 11.
Regional heterogeneity test.
Resource-based cities are cities dominated by the extraction and processing of natural resources such as minerals and forests in the region. As China’s main pollutant discharge areas, resource-based cities face greater economic transformation and pollution pressure than non-resource-based cities due to path dependence. We divided the sample cities into resource-based and non-resource-based cities according to the “National Sustainable Development Plan for Resource-Based Cities (2013-2020)” issued by the State Council of China. Through grouped regression, we examined the heterogeneous impact of dual pilot policies for carbon emission reduction on ecological resilience due to differences in urban resource levels. The test results are shown in Table 13. The results show that the dual pilot policy of carbon emission reduction has significantly improved the ecological resilience of non-resource-based cities, but the effect on resource-based cities is not significant. The reason may be that resource-based cities need to balance national energy security and local economic development in the process of carbon reduction, making policy goals more complex and the path of ecological improvement more tortuous. On the contrary, the main goal of non-resource-based cities is to achieve green and high-quality development through carbon reduction, with relatively single policy objectives and more obvious ecological improvement effects.
Threshold Effect Test
Considering the important transition period from high-speed growth to high-quality growth in the economy, there may be dynamic heterogeneity in the effectiveness of dual pilot policies for carbon emission reduction, and the fiscal pressure on local governments may affect the incentive effect of policies. We use local fiscal revenue as the threshold variable and adopt a panel threshold model to test the threshold effect of carbon emission reduction dual pilot policies on urban ecological resilience. Firstly, we conducted a threshold existence test using 300 rounds of the “self-repeated sampling method”, and the test results are shown in Table 14. Local fiscal revenue only passed the single threshold test, with a threshold value of 6.149 and an F-value of 50.120, indicating that the process of the carbon emission reduction dual pilot policy affecting urban ecological resilience only has a single threshold for local fiscal revenue. Secondly, threshold effect regression was conducted. When the local fiscal revenue level did not cross the threshold value, the effect of the carbon emission reduction dual pilot policy on urban ecological resilience was not significant. However, when the local fiscal revenue level crossed the threshold value, the impact coefficient of the carbon emission reduction dual pilot policy on urban ecological resilience was 0.023, which was significant at the 1% level, indicating that as the local fiscal revenue level increased, the carbon emission reduction dual pilot policy effectively improved urban ecological resilience.
Spatial Overflow Test
(1) Spatial correlation test
The spatial econometric model assumes that the spatial weight matrix is known and fixed, but in practical applications, the selection of the spatial weight matrix may be subjective, and different weight matrices may lead to different analysis results. Based on a comprehensive consideration of the spatial characteristics of the research object and the research objectives, this article uses a spatial geographic inverse distance matrix and applies the Moran global index and the Moran local index for spatial correlation testing. The results of the global Moran’s index test are shown in Table 15. From this, it can be seen that the global Moran index results of urban ecological resilience are significantly positive, and the values show a decreasing trend during the sample period. This indicates that urban ecological resilience has spatial autocorrelation, and the level of agglomeration decreases over time. To provide a more intuitive analysis of the spatial correlation between cities, we have drawn a Moran scatter plot, as shown in Fig. 3. The graph shows that in 2008, the ecological resilience of most cities was concentrated in the third quadrant, exhibiting significant low agglomeration characteristics. In 2022, the ecological resilience of most cities was concentrated in the second and third quadrants, exhibiting low-high and low-low agglomeration characteristics. This indicates a positive spatial correlation in urban ecological resilience, and further spatial econometric models are needed to explore the spatial spillover effects of carbon emission reduction dual pilot policies on urban ecological resilience.
To select a suitable spatial econometric model, we conducted an LM test, a Hausman test, and a Wald test. Based on the test results in Table 16, this paper selects the spatial Durbin double difference model to verify the spatial spillover effect of carbon emission reduction dual pilot policies on urban ecological resilience. The W×DID coefficient reflects the spatial spillover effect of the carbon emission reduction dual pilot policy. The results show that the coefficient value of W×DID is 0.112 and has passed the significance test at the 1% level, indicating that the carbon emission reduction dual pilot policy has a significant positive spatial spillover effect on the ecological resilience of surrounding cities. We further use a partial decomposition of variable changes to decompose the estimated results into effects to avoid estimation bias that may occur with simple point regression. The decomposition results show that the direct effect of the carbon emission reduction dual pilot policy on urban ecological resilience is significantly positive at the 1% level, while the indirect effect (spatial spillover effect) and total effect are significantly positive at the 5% level, and the proportion of spatial spillover effect to the total effect is 99.04%. This indicates that the carbon emission reduction dual pilot policy has strong positive externalities and can achieve shared prosperity in the ecological resilience of adjacent cities through significant spatial spillover effects.
Table 15.
Global Moran Index Test Results.
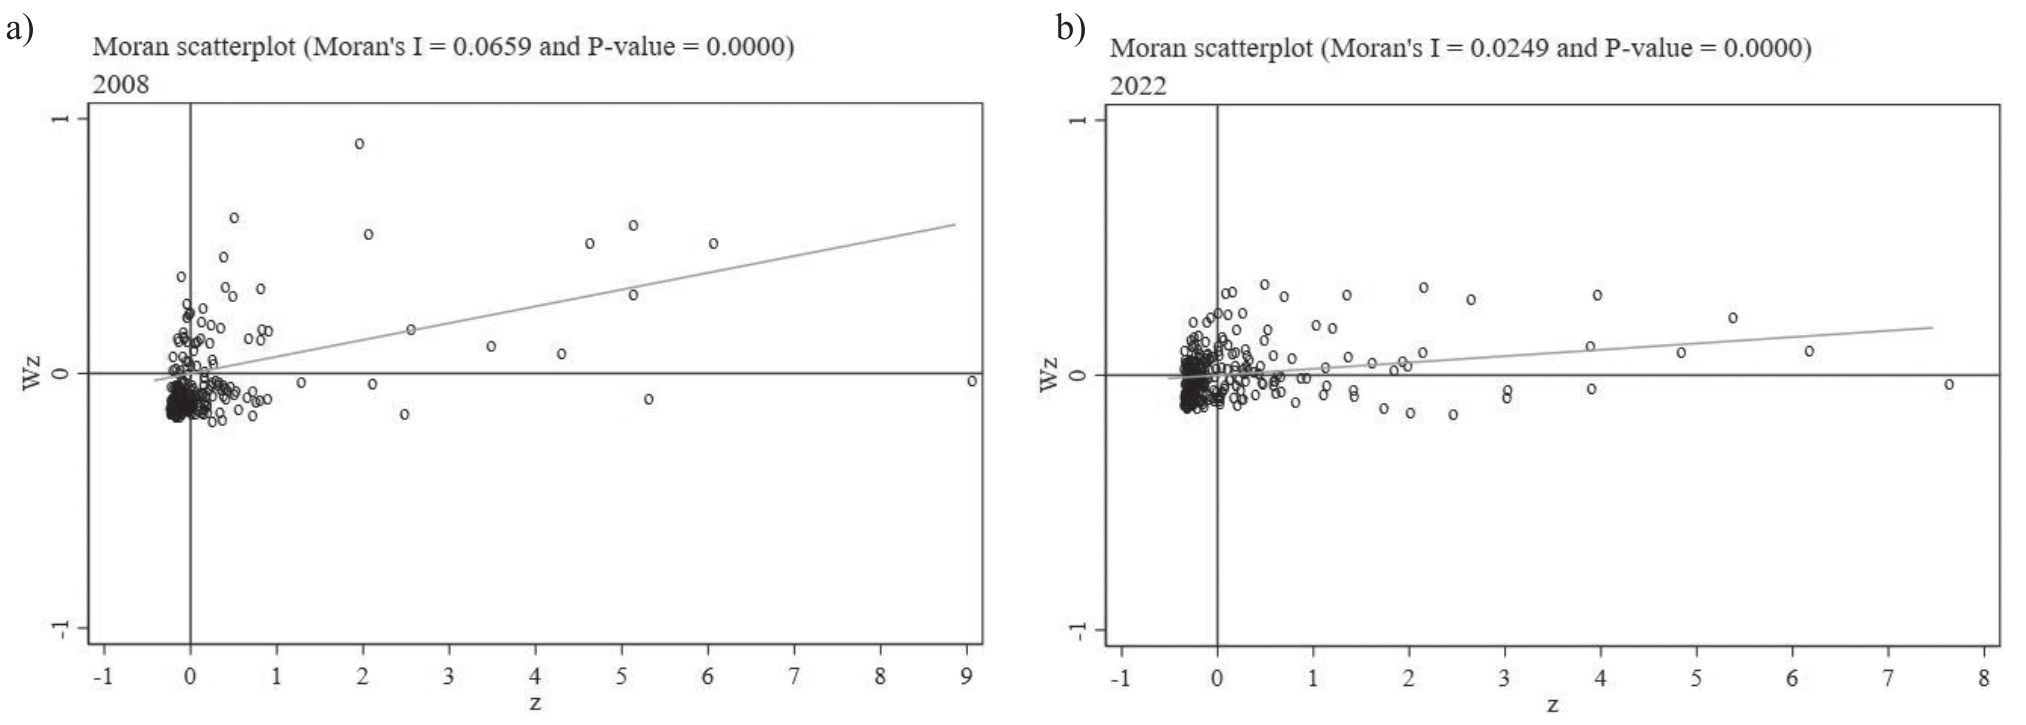
Table 16.
Regression results of spatial Durbin double difference model.
Conclusions
This paper posits the dual pilot policies of “low-carbon city” and “new energy demonstration city” as a quasi-natural experiment and uses the asymptotic difference-in-differences model to evaluate its impact on urban ecological resilience. The results indicate several key points: (1) The dual initiative of reducing carbon emissions substantially strengthens urban ecological resilience. (2) Compared to a single-pilot strategy, the dual-pilot approach has a more significant impact on improving urban ecological resilience. Particularly, cities that first adopt the “new energy demonstration city” status and then the “low-carbon city” status experience a more robust and swift enhancement in ecological resilience. (3) The main mechanisms by which the dual pilot policies for carbon reduction affect urban ecological resilience are structural and technological effects. On the one hand, the dual pilot policy can play a demonstrative role in promoting upgrading industrial structure, thereby adopting clean production technology and circular economy models to enhance urban ecological resilience. On the other hand, it can attract relevant investment, promote scientific and technological research and development compensation, and ultimately improve urban ecological resilience through technological progress. (4) The impact of carbon emission reduction pilot policies on urban ecological resilience exhibits heterogeneous characteristics. The dual pilot policy of carbon emission reduction has a significant effect on improving the ecological resilience of central and western cities but not on the ecological resilience of eastern cities. Compared to ordinary cities, the dual pilot policy of carbon reduction has a stronger effect on enhancing the ecological resilience of developed cities. The dual pilot policy of carbon emission reduction has significantly improved the ecological resilience of non-resource-based cities, but its effect on resource-based cities is not significant. (5) There is dynamic heterogeneity in the impact of carbon emission reduction dual pilot policies on urban ecological resilience. The policy effect significantly improves when the local fiscal revenue level crosses the threshold. (6) The spatial spillover effect analysis indicates that the carbon emission reduction dual pilot policy positively influences the ecological resilience of neighboring cities, contributing to a mutually advantageous outcome.
Recommendations
We predict that in the context of sustainable development, the pilot policies of “low-carbon cities” and “new energy demonstration cities” will also have cross-cutting and overlapping effects with other environmental protection policies implemented in the future. Therefore, the research direction in the future should shift from exploring the effects of individual policies to exploring the combined effects of multiple policies. Based on the above conclusions and predictions, we propose the following suggestions: (1) Pay attention to the synergistic effects and linkage mechanisms among environmental policies. It is necessary to optimize policy design and enhance policy coordination overall. For instance, when advancing new energy initiatives, integrating low-carbon transition strategies and fine-tuning policy combinations can minimize the incremental costs of individual policies, optimize resource distribution, and curb waste. This synergy can boost the overall efficacy of environmental measures, thereby mitigating urban environmental hazards and bolstering ecological resilience. (2) Develop environmental protection policies tailored to different regions based on their resource endowments and development stages. The eastern region, leveraging its industrial base, prioritizes green transformation and upgrading of traditional industries. The central and western regions capitalize on their strengths to actively nurture emerging clean industries. Developed cities leverage their technological innovation capabilities to accelerate the research and application of green technology. Ordinary cities focus on strengthening the cultivation and introduction of talent in the field of environmental protection and consolidating the talent foundation for green development. In addition, resource-based cities should actively explore opportunities for industrial transformation and break free from dependence on traditional resources. Non-resource-based cities can vigorously develop the new energy industry, injecting new impetus into regional sustainable development. (3) Maximize the impact of structural and technological dynamics. Pilot cities should aggressively pursue industrial structure enhancement to alleviate environmental stress from traditional, high-pollution sectors by fostering the growth of eco-friendly industries that offer high value and consume fewer resources. Simultaneously, technological advancement, as a key catalyst for economic growth, should be supported by more substantial policy incentives and resource allocation. This support can leverage the beneficial environmental externalities of technological progress, particularly in emission reduction and resource recycling, to reduce the incremental costs associated with environmental policies and expedite the achievement of policy objectives.

