

Introduction
Nature reserves serve as pivotal mechanisms for biodiversity preservation and the perpetuation of ecosystem functionalities, constituting integral components of the national ecological security strategy [1, 2]. The inception of nature reserve establishment in China dates back to 1956, and following nearly seven decades of development, an extensive network of nature reserves spanning diverse ecosystems and species has emerged, encompassing national, provincial, city, and county levels [2]. As of the close of 2021, China boasts over 11,600 nature reserves, collectively covering 18.5% of the nation’s land area, with 474 of these designated as state-level reserves, accounting for 9.3% of the country’s land expanse [3]. The ecological quality of vegetation within these nature reserves has been a subject of keen scrutiny since their inception. Vegetation Ecological Quality (VEQI) pertains to the capacity of vegetation to adapt to and rebound from environmental shifts, along with the extent to which vegetation contributes to ecosystem functions [4-6]. However, there remains a significant lack of research on the spatiotemporal characteristics and driving forces analysis of vegetation ecological quality within China’s national nature reserves. Hence, the monitoring and assessment of the spatiotemporal attributes of VEQI and its driving forces within nature reserves bear profound theoretical and practical import.
Advancements in satellite remote sensing technology in recent years have spurred rapid progress in the detection and analysis of vegetation ecology. Several scholars have conducted investigations into ecological transformations within nature reserves. Xu et al. employed three datasets encompassing soil retention rate (SR), net primary productivity (NPP), and habitat quality (HQ), and harnessed models such as RUSLE, CASA, and InVEST to evaluate ecological service quality within the national nature reserves situated in the Yangtze River Economic Belt [7]. On the other hand, Kan et al. delved into the spatial and temporal evolution of NPP and its responsiveness to climate fluctuations within the Qiang Lake National Nature Reserve, utilizing the Miami model, Thornthwaite Memorial model, and trend rate analysis method [8]. However, it is imperative to acknowledge that national nature reserves operate within intricate natural environments. Zhou et al. utilized NPP data to analyze the vegetation dynamics and their driving factors in 42 national nature reserves on the Qinghai-Tibet Plateau, revealing the impacts of climate change and human activities on vegetation changes [9]. Yan et al. found that the NPP of the Zoige Plateau wetland nature reserve was influenced by both climate change and human activities from 1990 to 2015. Human activities led to a reduction of wetland NPP by 22.37-36.45%, partially offset by the implementation of ecological restoration projects [10]. NPP, SR, and HQ, while informative, do not provide comprehensive insights into the dynamics of vegetation ecological management. Consequently, their findings are often subject to subjectivity. In response to this challenge, Qian et al. devised an index that holistically captures vegetation ecological quality, leveraging both vegetation cover and NPP. This approach is distinguished by its simplicity in calculation and reliance on objective data.
Prior research has elucidated that the dynamics of ecological quality are shaped by a confluence of natural factors and human activities [11–14]. Natural factors wield a predominant influence over vegetation’s ecological quality, with variables such as rainfall, temperature, and seasonal fluctuations exerting pronounced effects on vegetation. Moreover, changes within the ecosystem can engender reciprocal responses within the climate system [15]. In tandem, human activities exert a dual role in modulating vegetation’s ecological quality [16]. Activities such as deforestation, wetland drainage, and cropland expansion can precipitate vegetation loss and ecological quality degradation. In contrast, the establishment of national-level nature reserves in China has significantly contributed to the regional enhancement of vegetation ecological quality [5]. In recent years, the Chinese government has escalated investments in nature reserves, resulting in a discernible impact on the VEQI within these reserves, influenced by both human activities and natural factors [17]. However, a notable research gap persists regarding the spatiotemporal characteristics of ecological quality changes within nature reserves and the mechanisms underpinning them. Consequently, this paper investigates the VEQI within China’s national nature reserves as its focal point. It delves into the relative contributions of natural factors and human activities to VEQI changes from 2002 to 2022, employing metric scale trend analysis and the multiple regression residual method. Additionally, it employs the Hurst index to forecast the future trajectory of VEQI.
Building upon the comprehensive research review presented earlier, this paper seeks to address several critical inquiries: 1) To formulate the VEQI by synthesizing the collective impact of multiple indicators; 2) To elucidate the spatiotemporal evolution patterns and spatial distribution characteristics of VEQI across China over the preceding two decades and to prognosticate its future trajectories; 3) To undertake a quantitative analysis of the contributions made by China’s ecological restoration initiatives and climate change to the nation’s VEQI. This study serves as a pivotal bridge that spans the existing gaps in prior research efforts. It augments the body of knowledge by furnishing vital scientific data support for the dynamic assessment of VEQI within China’s national nature reserves. Anticipated outcomes include the provision of a robust scientific foundation for governmental entities to craft pertinent environmental protection policies.
Materials and Methods
Data Resource
The data utilized for this investigation encompassed a range of datasets, comprising China’s national nature reserve boundaries, administrative divisions [18], MOD13A2 normalized vegetation indices [19], MOD17A3 vegetation net primary productivity statistics [20], and climatic elements [21]. The preprocessing procedures encompassed data cropping, coordinate transformations, synthesis of annual records from monthly datasets, and standardization of spatial resolution and coordinate systems across all datasets. For comprehensive insights into the specifics of the data, please refer to Table 1 for detailed information.
Methods
Estimating the Fraction of Vegetation Cover (FVC)
Fraction vegetation cover (FVC) was calculated using MODIS NDVI monthly synthetic data based on the hybrid image element decomposition method in this study [22, 23], as shown below:
where, NDVIsoil denotes the normalized vegetation index for pure bare soil within the image element; NDVIveg signifies the normalized vegetation index for pure vegetation within the image element [24]. Considering the specific attributes of Chinese vegetation, the assigned values for NDVIsoil and NDVIveg in this study were 0.05 and 0.95, respectively [22–25].
Estimating Vegetation Ecological Quality Index (VEQI)
The vegetation ecological quality index (VEQI) is a comprehensive parameter that provides an integrated assessment of the ecological quality of vegetation. It is computed using a weighted method that combines the Net Primary Productivity (NPP) and Fraction of Vegetation Cover (FVC) for a particular area [22]. The specific formula for VEQI is presented below:
where, f1 stands for the weighting coefficient of the terrestrial vegetation cover. f2 stands for the weighting coefficient of NPP. Both f1 and f2 have been set to 0.5 in this study; NPPmax represents the maximum NPP achievable under the best local meteorological conditions during that specific time period. It serves as a reference value for converting NPP into a percentage. VEQI is a scalar parameter ranging from 0 to 100. A higher VEQI value indicates greater local vegetation production capacity and coverage, signifying better ecological quality.
Trend Analysis
The Theil-Sen Median trend analysis is a nonparametric statistical method employed for trend organized data to ascertain the trend’s direction, regardless of the data’s adherence to a normal or any specific distribution [25, 26]. In this study, we utilized this analytical technique to compute the VEQI trend within China’s nature reserves spanning from 2002 to 2022, employing the following formula:
where, Slope represents the trend of VEQI within the national nature reserve, with VEQIj and VEQIi denoting the values of VEQI in the jth year and ith year within the nature reserve, respectively. If Slope < 0, it signifies a declining trend in VEQI over the time series, indicating a deterioration in the ecological quality of vegetation during that period. Conversely, if Slope > 0, it indicates an increasing trend in VEQI over time, signifying an improvement in the ecological quality of vegetation.
In this study, we employed the Mann-Kendall test to assess the significance of the VEQI trend [27, 28]. The statistics S and ZSlope were computed as follows:
where, VEQIi and VEQIj represent the VEQI values for years i and j within the time series, and n is the length of the representative time series, which is 22 in this case. The test statistic ZSlope falls within the range of (-∞, ﹢∞). At a given significance level α, when |ZSlope| exceeds Z1-α/2, it indicates a statistically significant variation in the time series at the α level. For this study, α = 0.05 is employed to determine the significance of China’s VEQI change trend from 2002 to 2022 at the 0.05 confidence level. Specifically, when ZSlop e > 1.96, the trend is considered statistically significant.
Multivariate Regression Residual Analysis
In this study, we applied the multiple regression residual model to assess the relative contributions of climate change and national nature reserves (human activities) to VEQI changes [29]. VEQI served as the dependent variable, while independent variables included temperature, rainfall, actual evapotranspiration, potential evapotranspiration, water deficit, surface runoff, aridity index, atmospheric pressure, saturated water vapor pressure difference, shortwave downward radiation, wind speed, and soil moisture. Calculation of Predicted VEQI: Utilizing the regression model coefficients and climatic data, we calculated the predicted value of VEQI (VEQICC), representing VEQI under the exclusive influence of climate change. Calculation of VEQI Residual: Subsequently, we obtained the VEQI residual (VEQIHA) by computing the difference between the observed VEQI and the predicted VEQICC. This residual characterizes VEQI under the influence of national nature reserves only, and the calculation steps are detailed below:
where, VEQICC is the VEQI prediction based on the regression model, xi is the climate factor, and ai, and b are the parameters of the regression model. VEQIHA is the residuals, and VEQIobs are the observations.
Drivers of VEQI Changes
To elucidate the principal factors driving VEQI changes in China, this study quantified the contributions of climate factors and human activities as outlined in Table 2 [30–32]. Specific calculations are detailed in Table 2. CC (Climate Factors) signifies climate-related variables, while HA (human activities) represents anthropogenic influences. Slope(VEQIobs) denotes the trend in observed VEQI values, reflecting actual changes in VEQI. Slope(VEQICC) characterizes the trend in predicted VEQI values considering the impact of climatic factors, essentially the trend in VEQI under climatic influences. Finally, Slope(VEQIHA) portrays the trend in VEQI residuals, accounting for the influence of human activities on VEQI, which is essentially the trend in VEQI under the influence of these activities.
Hurst Analysis
The Hurst index, a statistical measure of long-term memory or autocorrelation in time series data, was originally formulated by Harold Edwin Hurst in the 1950s for studying river flow volatility [33–35]. The steps for calculating this index are outlined below:
Selection of Time Series Data: Initiate the process by selecting the time series data for analysis, ensuring that the dataset is of sufficient length to discern patterns of long-term memory.
Table 2.
Detailed description of data.
Data Decomposition: Decompose the time series data into distinct time scales, often achieved by computing cumulative sums or differences at various lags. This step captures autocorrelation across different time scales.
Computation of Cumulative Mean Function: For each time scale considered, compute the cumulative mean function (also referred to as the cumulative mean curve) for the dataset. This function is derived by cumulatively summing the data across different lags and dividing by the corresponding lag.
Calculation of Standard Deviation: Calculate the standard deviation of the data for each time scale.
Determination of the Hurst Index: Utilize the cumulative mean function and standard deviation values to compute the Hurst index.
When the Hurst index equals 0.5, it signifies a random wandering time series with no long-term memory, where each moment’s value is independent. A Hurst index of less than 0.5 indicates negative long-term memory, implying a downward trend. Conversely, a Hurst index greater than 0.5 suggests positive long-term memory, signifying an upward trend.
Results and Discussion
In order to assess the scientific validity and generalizability of the TSS-RESTREND model proposed in this study, we conducted a validation of the simulated VEQI values (Fig. 1). As depicted in Fig. 1, the R2 and slope for the simulated VEQI closely approach 1 when compared to the observed VEQI data for China’s nature reserves spanning the years 2002 to 2022. This suggests that the TSS-RESTREND model, as employed in this research, possesses robust scientific utility and broad applicability. It can effectively investigate the determinants of time series variations in VEQI and the contributing factors within China’s national nature reserves.
The Spatiotemporal Characteristics of VEQI
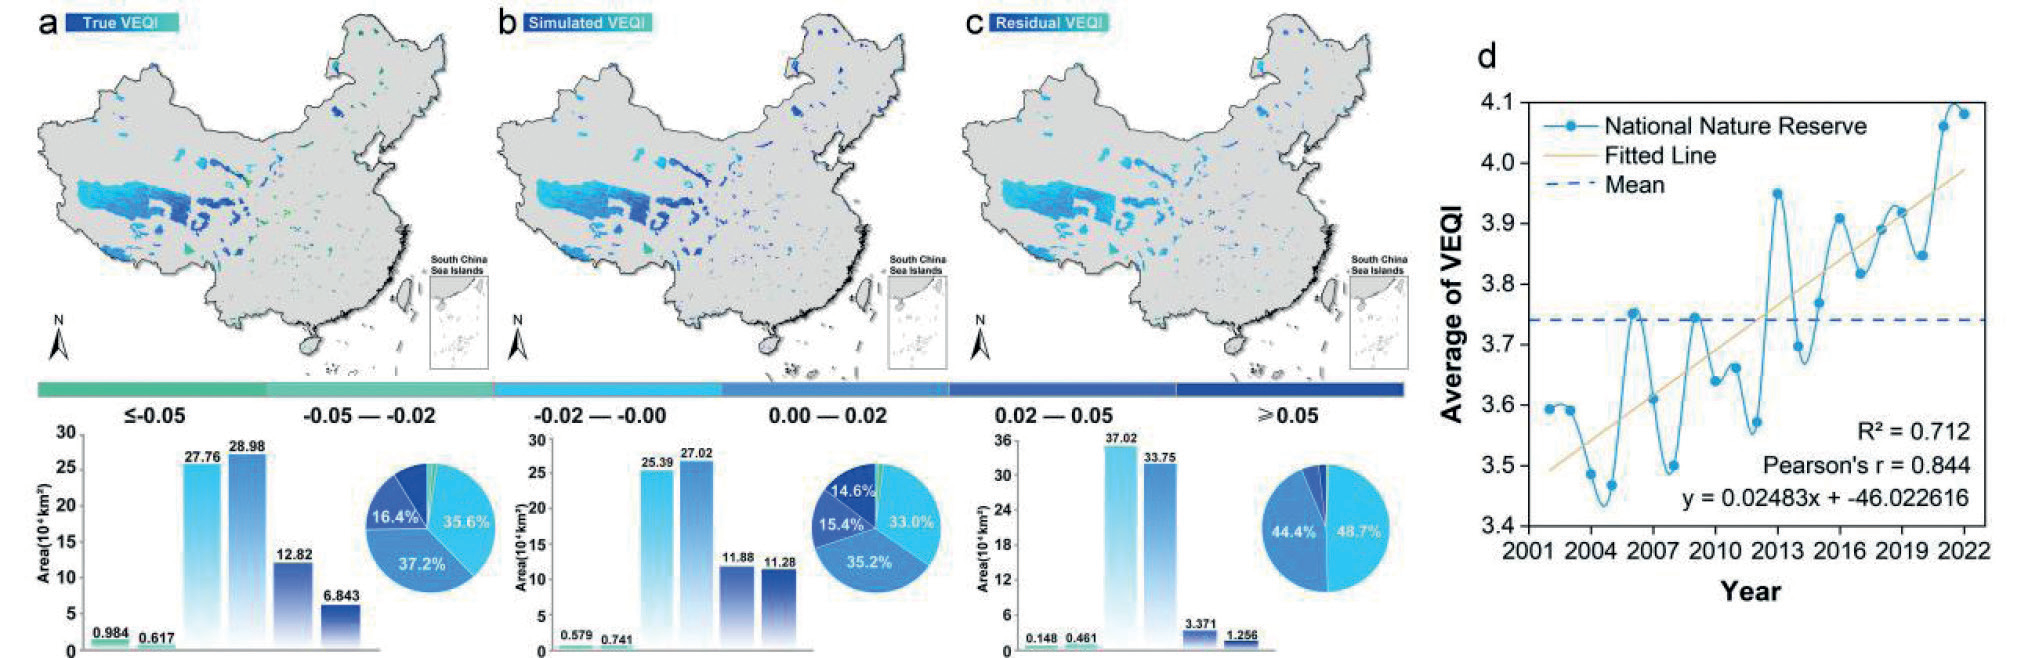
The average VEQI value for China’s national nature reserves between 2002 and 2022 stood at 3.741. An overall fitted linear trend reveals a statistically significant upward trajectory. Notably, the lowest recorded value occurred in 2006 at 3.468, while the highest value was observed in 2022 at 4.081, reflecting a substantial overall increase of 17.63%. This compelling trend underscores the considerable positive impact of China’s national nature reserves on VEQI over the past two decades [36], as visually depicted in Fig. 2d.
Fig. 2a illustrates the spatial distribution of VEQI trends in China’s nature reserves from 2002 to 2022. Notably, these trends exhibit substantial spatial heterogeneity. The majority of the trend rates fall within the ranges of -2×10⁻² yr-1 to 0 yr-1 (35.6%) and 0 yr-1 to 2×10⁻² yr-1 (37.2%), covering areas of 25.39×10⁴ km² and 27.02×10⁴ km², respectively. Furthermore, an area spanning 48.63×10⁴ km² displayed an increasing trend in VEQI (0 yr-1 to -5×10⁻² yr-1), while 29.36×10⁴ km² showed a decreasing trend in VEQI (-5×10⁻² yr-1 to 0 yr-1). Among these regions, 6.84×10⁴ km² exhibited a significant increase in VEQI (≥5×10⁻² yr-1), primarily concentrated in reserves such as Xilingol Grassland Reserve [37, 38], Sanjiangyuan Thermal Reserve [39, 40], and Qilianshan Nature Reserve in Gansu [41, 42]. Conversely, 0.98×10⁴ km² displayed a significant decrease in VEQI (≤- 5×10⁻² yr-1), mainly within Xilingol Grassland Reserve [39, 40], Sanjiangyuan Thermal Reserve [39, 40], and Qilianshan Nature Reserve in Gansu [41, 42]. Additionally, 2.5×10⁴ km² was mainly concentrated in the eastern region’s nature reserves, reflecting the influence of intensive human activities in these areas [43, 44].
Fig. 1.
Accuracy verification of simulated VEQI from 2002 to 2022. The sample points’ colour is mapped from 0 to 1. The simulated VEQI was obtained by constructing a multiple linear regression fit of the natural indicators to the observed EEQ.
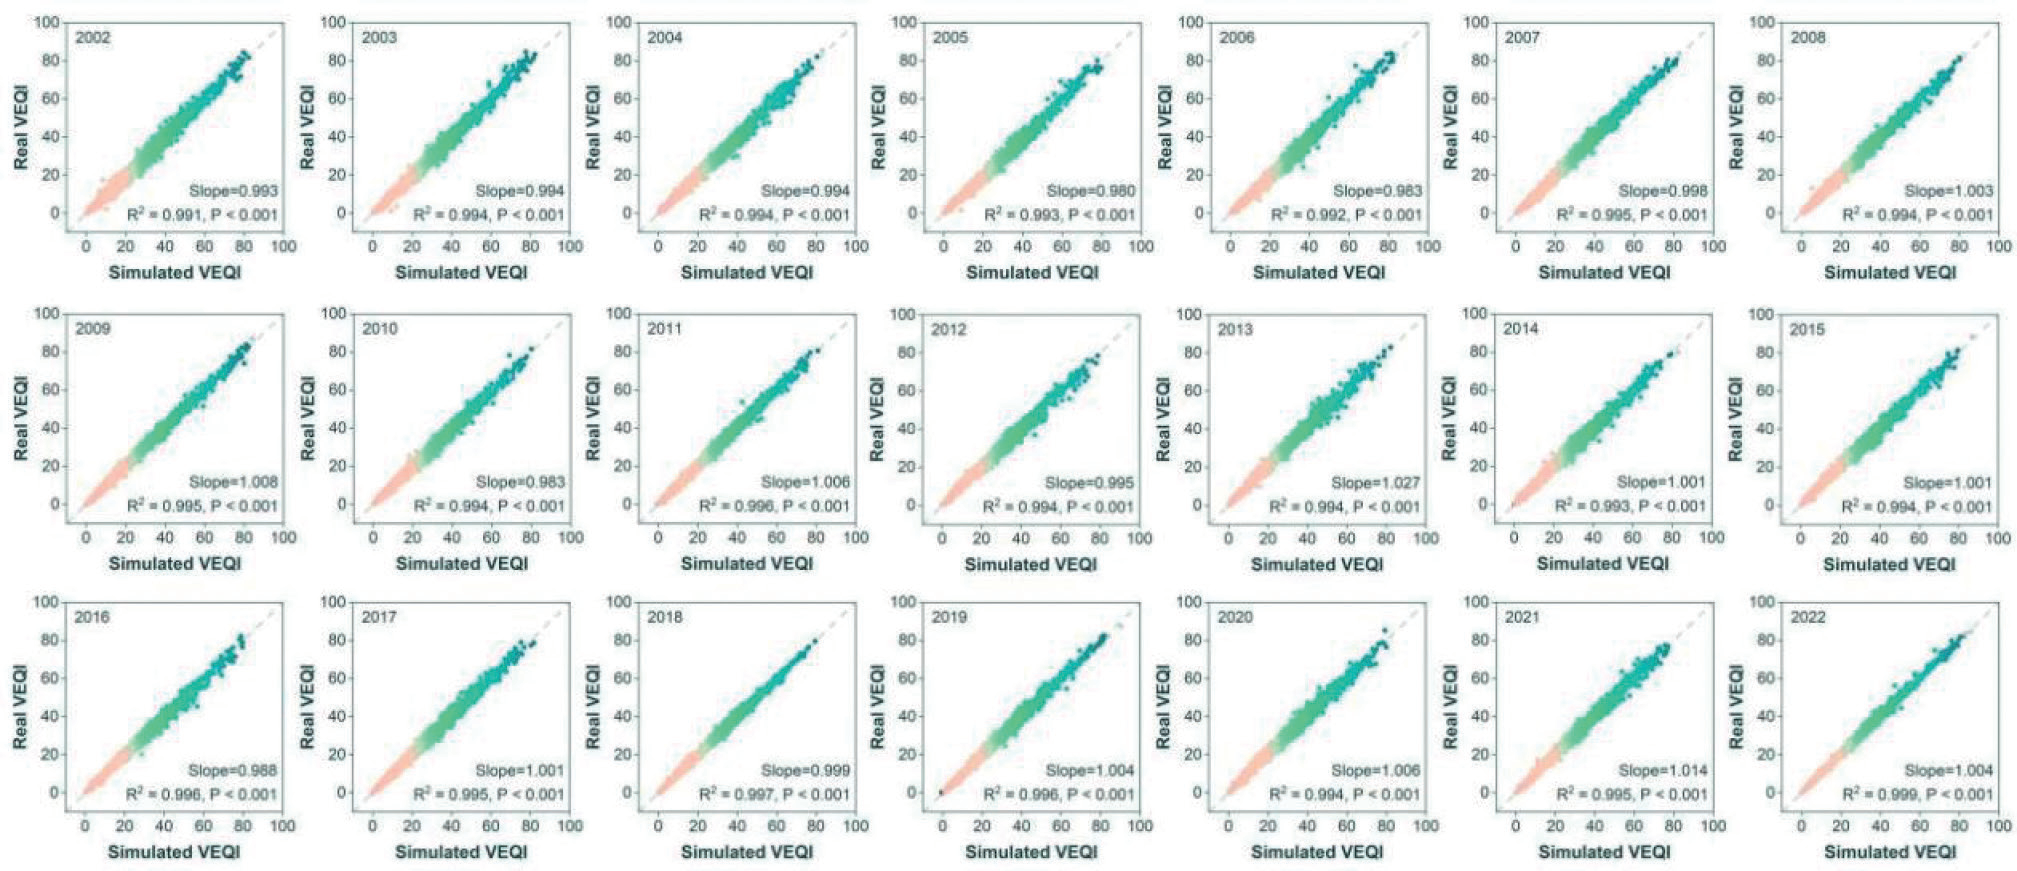
Fig. 2.
Spatial distribution map of driving factors of VEQI change in China’s nature reserves from 2002 to 2022. (a) Spatial distribution of observed VEQI trends within the national nature reserve. (b) Spatial distribution of residual VEQI trends within the national nature reserve. (c) Spatial distribution of simulated VEQI trends within the national nature reserve. The residual VEQI is taken as the difference between the simulated VEQI and the observed VEQI. The three trends of VEQI are obtained from the Theil-Sen median. (d) Interannual variation of VEQI in nature reserves of China during 2002-2022.
Among the 243 nature reserves encompassed in this study, a noteworthy 205 (84.0% of the total) exhibited positive trends in VEQI changes. The most striking improvement in VEQI was observed in the Huize Black-necked Crane Nature Reserve [45], registering a remarkable trend value of 48.9×10⁻² yr-1. It was closely followed by the Dongzhai Harbor Nature Reserve [46], which displayed a substantial upward trend with a value of 46.9×10⁻² yr-1. In contrast, 38 nature reserves (15.6% of the total) experienced decreasing trends in VEQI. Among these, the most significant decrease was recorded in the Leigongshan Nature Reserve [47], with a no trend value of -19.9×10⁻² yr-1. The Baishuihe Nature Reserve also displayed a declining trend with a value of -11.3×10⁻² yr-1.
Furthermore, considering that natural reserves represent areas with relatively minimal human footprint, referencing previous studies, we observed a significant downward trend in VEQI in regions with larger human footprints, such as urban areas, over the past two decades [22, 23, 48]. This indirectly validates the role of natural reserves in protecting vegetation within their boundaries. Additionally, we found that VEQI in other natural areas outside of reserves showed an increasing trend, largely attributed to the implementation of significant ecological restoration projects in China since the twenty-first century. Based on the findings of this study and previous research, it is evident that areas with smaller human footprints generally exhibit an upward trend in VEQI, while those with larger human footprints tend to experience a decline [22, 23, 48]. Therefore, we conclude that while the establishment of natural reserves contributes to promoting VEQI, it is not the sole factor. The underlying reason behind this phenomenon is the collective implementation of ecological protection measures, including natural reserves and ecological restoration projects.
Residual Analysis
Fig. 2a depicts the observed VEQI trends within the national nature reserves, while Fig. 2b illustrates the simulated VEQI trends within the national nature reserves based on climate data. Fig. 2c presents the residual VEQI trends within the national nature reserves. An examination of Fig. 2 reveals a notable degree of consistency between the observed and simulated VEQI trends. It is worth highlighting that the simulated VEQI trends exhibit a more pronounced increase in VEQI across various regions. This observation suggests that the fluctuations in VEQI within the purview of the national nature reserves during the specified timeframe are predominantly driven by natural factors [49].
Referring to Fig. 2b, it is evident that the VEQI influenced by natural factors exhibits a similar pronounced spatial similarity as the true VEQI change trend. The predominant trend rates are primarily distributed in the range of -2×10⁻² yr-1 to 0 yr-1 (33.0%) and 0×10-2 yr-1 to 2×10⁻² yr-1 (35.2%), covering areas of 25.39×10⁴ km2 and 27.02×10⁴ km2, respectively. A total of 210 out of 243 nature reserves within the study’s scope, show a positive trend in VEQI change influenced by natural factors, accounting for 86.4% of the total. Notably, Shaanxi Ziwuling Nature Reserve [50] displays the most substantial improvement in VEQI, with a trend value of 39.08×10⁻² yr-1, followed closely by the Huize Black-necked Crane Nature Reserve [45] at 39.06×10⁻² yr-1. Conversely, 33 nature reserves demonstrate decreasing trends in VEQI changes, constituting 13.6% of the total. Among these, Leigongshan Nature Reserve exhibits the most significant decline in VEQI, with a trend value of -19.15×10⁻² yr-1.
Referring to Fig. 2c, it becomes evident that the overall trend rate of VEQI influenced by human activities significantly deviates from the true VEQI change trend. The primary trend rates are predominantly distributed within the range of -2×10⁻² yr-1 to 0 yr-1 (48.7%) and 0 yr-1 to 2×10⁻² yr-1 (44.4%), covering areas of 37.02×10⁴ km2 and 33.75×10⁴ km2, respectively. Within the study’s scope encompassing 243 nature reserves, a total of 188 nature reserves exhibit positive trends in VEQI changes influenced by human activities, constituting 77.4% of the total. Notably, Hanzhong Crested Ibis Nature Reserve [51] showcases the most substantial improvement in VEQI influenced by human activities, with a trend value of 15.46×10⁻² yr-1, closely followed by Hebei Wuling Nature Reserve [52] at 14.03×10⁻² yr-1. Conversely, 55 nature reserves demonstrate decreasing trends in VEQI changes, making up 22.6% of the total. Among these, Cat’er Mountain Nature Reserve [53] records the most significant decline in VEQI influenced by human activities, with a trend value of -6.57×10⁻² yr-1. In summary, the influence of natural factors on VEQI changes surpasses that of human activities, with the spatial distribution of the trend in natural factors closely mirroring the VEQI trend.
Contribution of Human Activities and Natural Factors
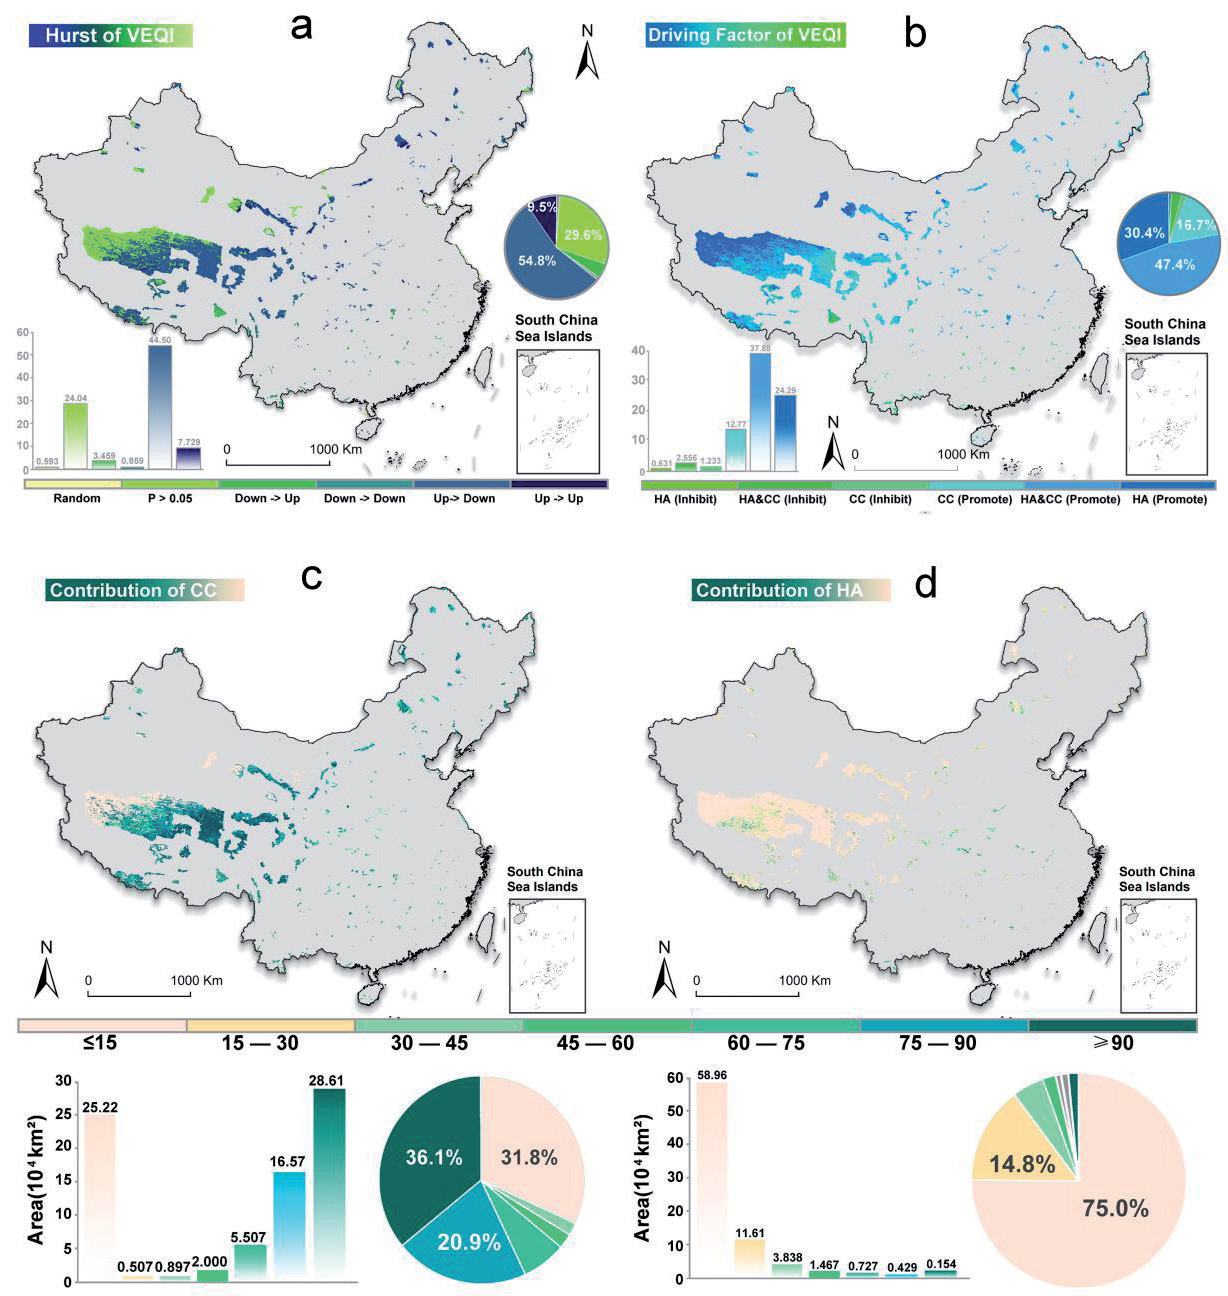
Fig. 3 illustrates the contributions of natural factors and human activities to the VEQI changes in China’s national nature reserves from 2002 to 2022. This analysis encompasses the influence of climatic factors alone (CC), the influence of human activities alone (HA), and the combined influence of both (HA&CC). From Fig. 3, it is evident that the region where human activities and climate change jointly contribute to promoting VEQI at the national level spans 37.88×10⁴ km2, accounting for approximately 47.4% of the total area. This region is primarily distributed in the eastern part of the Qianghu Nature Reserve, Coco Sili Nature Reserve, Qilian Mountain Nature Reserve in Gansu, and Xilinguole Grassland Nature Reserve. Conversely, the area where human activities and climate change jointly have an inhibitory effect on VEQI covers 2.56×10⁴ km2, constituting roughly 3.2% of the total area. It is mainly concentrated in the Yarlung Zangbo Grand Canyon Nature Reserve, Xishuangbanna Nature Reserve, East Dongting Lake Nature Reserve, and nature reserves located in the southeastern region.
The area where VEQI changes are primarily driven by human activities encompasses 24.29×10⁴ km2, accounting for about 30.4% of the total area. This concentration is mainly observed in the western part of Qiang Lake Nature Reserve, Ananbe Wild Camel Nature Reserve, Yanchi Bay Nature Reserve, Minqinlian Nature Reserve, and Abi Lake Wetland Nature Reserve. In contrast, regions where VEQI is inhibited by the combined effects of climate change and human activities encompass about 2.56×10⁴ km2, accounting for 0.8% of the total area, primarily concentrated in Xishuangbanna Nature Reserve and Selincuo Nature Reserve.
The region where VEQI changes are mainly driven by climate change factors spans 14.01×10⁴ km2, accounting for approximately 17.5% of the total area. Within this area, regions contributing to VEQI changes cover 12.77×10⁴ km2, constituting about 16.7% of the total area. These regions are mainly concentrated in Sanjiangyuan Nature Reserve, particularly in its eastern part, Hanas Nature Reserve, and Everest Nature Reserve. Conversely, regions with an inhibitory effect encompass about 1.23×10⁴ km2, accounting for approximately 1.5% of the total area, and are primarily concentrated in Yarlung Zangbo Nature Reserve, Gaoligong Nature Reserve, and Leigongshan Nature Reserve. In summary, the VEQI of national nature reserves exhibited an overall increasing trend. The joint influence of natural factors and human activities played a significant role in driving VEQI changes in Chinese nature reserves [54].
Contribution of Human Activities and Climate Change to VEQI Changes
The impact of natural factors and human activities on VEQI changes exhibits pronounced spatial heterogeneity, with climate change contributing significantly more than human activities [55-57], as depicted in Fig. 3. The influence of natural factors on the VEQI of national nature reserves surpasses that of human activities. Notably, natural factors account for the largest proportion, with an area exceeding 90%, covering 28.61×10⁴ km2 (36.1%) of the total area. Within this category, the Cocoanutili Nature Reserve demonstrates the highest contribution of natural factors to VEQI changes. Conversely, 25.22×10⁴ km2 (31.8%) of the national nature reserves exhibit a dampening effect on VEQI changes due to natural factors, with the buffer zone of Qiang Lake Nature Reserve and the Annambe Wild Camel Nature Reserve showing the least impact on VEQI changes (Fig. 3a). As indicated in Fig. 3b, approximately 75.0% of the area within national nature reserves across the country experiences a contribution of human activities to VEQI changes of less than 15%, encompassing an area of roughly 58.96×10⁴ km2. The area where human activities contribute to VEQI changes within national nature reserves is 1.31×10⁴ km2 (31.8%). Primarily, this influence is concentrated in the southeastern region of China’s nature reserves and the southwestern region of Qianghu Nature Reserve. In summary, the impact of natural factors on VEQI changes is more pronounced than that of human activities and exhibits a distribution pattern akin to that of VEQI change trends [56–59].
Trends in VEQI for Protected Areas
In pursuit of China’s national nature reserves’ sustainable development goals, it is imperative to investigate the prospective trends in VEQI within their boundaries. Employing the Hurst index rescaling range method, this study scrutinized historical data spanning from 2002 to 2022 within China’s national nature reserve boundaries, yielding the results presented in Fig. 3. The future trajectory of VEQI within these reserves, spanning the period from 2002 to 2022, exhibits spatial heterogeneity mirroring the trend changes observed previously (Fig. 2). Of these, regions that experienced an upward trend in the past two decades encompassed 52.2×10⁴ km2 (64.3%), indicating a noteworthy enhancement in vegetation ecological quality within the national nature reserves over the last twenty years [60, 61]. The most prominent increases were predominantly observed in Qianghu Nature Reserve in the eastern part of the country, Cococli Nature Reserve, and Xilingol Grassland Nature Reserve, situated in the northeastern region. As depicted in Fig. 3, areas showing an expected rise in the future spanned 11.2×10⁴ km2 (14.0%), with 7.7×10⁴ km2 (14.0%) overlapping with regions that had experienced past and future increases. These overlapping areas were primarily concentrated in Xilingol Grassland Nature Reserve, Dalai Lake Nature Reserve, and Yanciwan Nature Reserve, signifying an anticipated rise in VEQI for these nature reserves. In summary, the majority of regions within China’s national nature reserves exhibited a discernible upward trend in VEQI between 2002 and 2022, with 14.0% of the area anticipating an upward trend in the future.
Fig. 3.
(a) Spatial distribution map of predicted short-term VEQI using the Hurst exponent model. (b) Spatial distribution map of driving factors of VEQI change in China’s nature reserves from 2002 to 2022. (c) Spatial distribution map of natural factors on VEQI change trend in China’s nature reserves from 2002 to 2022. (d) Spatial distribution map of human activities on VEQI change trend in China’s nature reserves from 2002 to 2022.
Based on the preceding studies, a noticeable upward trend in VEQI within national nature reserves across the country was identified [60, 61]. The most remarkable enhancement in VEQI occurred in the Black-necked Crane Nature Reserve, boasting a trend value of 48.9×10⁻² yr-1, closely followed by the Dongzhai Harbor Nature Reserve with a trend value of 46.9×10⁻² yr-1. The Black-necked Crane National Nature Reserve is situated in southwestern China, within the Himalayas, characterized by high terrain with an average altitude exceeding 3,500 meters. This alpine region endures harsh climatic conditions, marked by protracted and frigid winters, brief yet balmy summers, and substantial snowfall. The reserve rigorously adheres to environmental protection policies established by national laws and regulations, including the Law of the People’s Republic of China on the Protection of Wildlife and the Regulations of the People’s Republic of China on Nature Reserves. These measures prohibit illicit logging, development, and polluting activities, thereby preserving the integrity of its vegetation. Moreover, the recent rise in temperatures at higher altitudes has contributed to snowmelt, augmenting water availability and encouraging vegetation growth. The reserve has embarked on a comprehensive vegetation restoration initiative, particularly targeting alpine flora, resulting in increased vegetation diversity. Conversely, Dongzhai Harbor Nature Reserve, situated in Hainan Province, China, represents a tidal wetland environment. The climate is characterized by mild humidity, featuring four distinct seasons, warm summers, cold winters, and evenly distributed precipitation. This wetland setting provides conducive conditions for soil quality and ample moisture availability, fostering the flourishing of wetland vegetation. Stringent environmental protection measures, enforced by the government, effectively restrict industrial and agricultural activities within the reserve’s boundaries, minimizing disturbances to the local vegetation.
The most notable decline in VEQI was observed in the Leigongshan Nature Reserve, registering a trend value of -19.9×10⁻² yr-1, closely trailed by the Baishuihe Nature Reserve, with a trend value of -11.3×10⁻² yr-1. Leigongshan Nature Reserve, situated in the central region of Qiandongnan, Guizhou Province, spans across the four counties of Leishan, Taijiang, Jianhe, and Rongjiang. Notably, it serves as the watershed for both the Yangtze River and Pearl River water systems. This unique positioning exposes the reserve to an uneven distribution of water resources. Depending on the side of the watershed, the reserve may be influenced by either the Pearl River or Yangtze River water systems. Consequently, certain areas benefit from a relatively stable water supply, while others grapple with susceptibility to droughts or water scarcity, ultimately impacting the overall health of the vegetation. The VEQI decline witnessed in the Baishui River Nature Reserve stems from a complex interplay of factors. Geographically nestled in the mountainous and hilly terrain of Guizhou Province, the reserve experiences a subtropical humid climate marked by pronounced seasonal temperature and precipitation fluctuations. These environmental factors collectively exert influence on the health and ecological quality of the local vegetation. Seasonal climatic variations result in fluctuating water supplies for vegetation, characterized by abundant summer rainfall but drier winters. The subtropical climate intensifies this challenge, with soaring summer temperatures and heightened rates of evapotranspiration, leading to increased soil moisture evaporation and rendering vegetation more susceptible to water deficits. Furthermore, the diversity of soil properties also contributes to variations in vegetation’s capacity to utilize water.
Policy Implications
Based on the preceding research and analysis, we propose the following recommendations:
1. Differentiated Conservation Measures: Given the spatial heterogeneity evident in the distribution of VEQI within nature reserves, tailored conservation strategies should be devised. In areas experiencing pronounced VEQI decline, concerted efforts must be channeled toward ecological restoration and protection. This entails initiatives like reforestation, afforestation, soil and water conservation projects, and erosion control measures. Conversely, regions where VEQI remains stable or exhibits growth can prioritize management actions aimed at preserving and fortifying existing ecosystem conditions. These measures encompass preventing illegal logging, managing tourist influx, and regulating the sustainable utilization of natural resources.
2. Monitoring and Early Warning System: Establishing a routine monitoring and early warning system is essential for promptly detecting VEQI trends. Leveraging remote sensing technology, GIS, and ecological surveys facilitates the acquisition of precise data, enabling swift identification of areas necessitating immediate intervention and management.
3. Policy Support: Governmental bodies should extend policy support to incentivize and reward endeavors that enhance vegetation’s ecological quality. This might involve implementing eco-compensation mechanisms and eco-subsidy policies, among other measures.
4. Climate Adaptation Strategies: Considering the impact of climate change on vegetation’s ecological quality, it is imperative to formulate climate adaptation strategies. This is particularly crucial in response to escalating temperatures and shifting precipitation patterns. Proposed strategies encompass the introduction of climate-resilient plant species, water management techniques to address precipitation deficits, and other pertinent measures.
Limitation
In this study, we investigated the spatiotemporal changes in the Vegetation Ecological Quality Index (VEQI) within Chinese national nature reserves from 2002 to 2022. It is noteworthy that the establishment times of national nature reserves in China vary, with many reserves being gradually established between 2002 and 2022. Therefore, future research could involve comparing VEQI changes before and after the establishment of reserves to further analyze the role of national nature reserves in vegetation ecological restoration. Furthermore, a noteworthy limitation in our analysis pertains to the impact of human activities. The results obtained from the residual analysis provided a broad overview but lacked specificity regarding the distinct effects of various human activities on VEQI. This limitation hinders a comprehensive understanding of ecological changes. To address this, future research efforts could benefit from the utilization of more extensive datasets and advanced methodologies. These approaches would facilitate the quantification of the contributions of diverse human activities, such as carbon emissions and urban expansion, to VEQI. Additionally, broadening the scope of investigation to compare differences among various countries and regions will be crucial for deriving universally applicable conclusions.
Conclusions
In this study, we focused on China’s national nature reserves as the research subject, aiming to analyze the relative contributions of natural factors and human activities to VEQI changes from 2002 to 2022. This analysis was conducted using trend analysis with a metric scale and the multiple regression residual method. Additionally, we predicted future VEQI trends utilizing the Hurst index.
The key findings are as follows:
The average VEQI value within China’s national nature reserves from 2002 to 2022 stood at 3.741. An evident upward trend was observed in the overall fitted straight line, signifying a remarkable 17.63% increase. Notably, an extensive area of 48.63×10⁴ km2 exhibited an upward VEQI trend (0 yr-1×10⁻² yr-1), while 29.36×10⁴ km2 displayed a declining trend (-5×10⁻² yr-1-0 yr-1). These results highlight a significant overall upward trajectory for VEQI within China’s nature reserves during the 2002–2022 period.
An area measuring 2.56×10⁴ km2, constituting about 3.2% of the total area, exhibited a concurrent inhibitory effect on VEQI due to both human activities and climate change. Meanwhile, a region covering 14.01×10⁴ km2, accounting for approximately 17.5% of the total area, witnessed VEQI changes driven by climate change factors. Overall, the VEQI in China’s nature reserves displayed an upward trend, with natural factors and human activities playing pivotal roles in driving these changes.
The VEQI in national nature reserves generally exhibited an upward trajectory, largely influenced by the combined impact of natural factors and human activities in Chinese nature reserves. Specifically, regions where natural factors accounted for over 90% of VEQI changes covered 28.61×10⁴ km2 (36.1%). Similarly, areas where human activities contributed over 90% to VEQI changes encompassed 28.61×10⁴ km2 (36.1%). Notably, the area where human activities dominated, contributing over 90% to VEQI changes, was limited to 0.154×10⁴ km2 (0.19%).
Future VEQI trends within China’s national nature reserves between 2002 and 2022 exhibited marked spatial heterogeneity akin to the observed change trends. Over the past two decades, a substantial area, amounting to 52.2×10⁴ km2 (64.3%), experienced an increase. This suggests a significant uptrend in vegetation ecological quality within the national nature reserves during this period.

