

Introduction
Human survival and development are impacted by the indirect and long-term consequences of the ecological environment during the process of social development, since human production activities are directly tied to the ecological environment. The modern ecological exchange costs are higher and impact faster than in the past, with greater depth, accelerated broadly by means of human activity [1]. The desire to protect the environment has been universally acknowledged [2, 3] and has been the center of attention in specific research over the last forty years [4]. Various worldwide initiatives have been proposed and acted upon, such as the Millennium Ecosystem Assessment, the Convention on Biological Diversity, etc., however, ecosystems continue to be broken [5].
Global lake ecosystems, for example, are under great risk [6]. Lakes include almost ninety percent of the Earth’s freshwater, host more than 100,000 species, embody biodiversity [7], and supply crucial elements to ecosystems for thousands and thousands of human beings internationally [8, 9]. Over the centuries, many lake ecosystems have seen continuous degradation driven by numerous disturbances in the world’s environmental climate [10], with extreme aquatic biodiversity loss and shifts in lake thermal zones found globally [11]. In addition, with some studies predicting extra local weather impacts and growing areas of human activity in the future, coupled with the legacies of the past, a growing range of socio-ecological unknowns are anticipated to emerge [12].
As one of the primary factors in the city’s ecological environment, lakes promote the ecological surroundings and microclimate rules [13]. A significant natural wetland located in the lower reaches of the Yangtze River, Chaohu Lake, is the fifth-largest freshwater lake in China and one of the “three rivers and three lakes” in the country’s water air pollution prevention and management program. It acts as a crucial aspect of maintaining Yangtze River’s ecological protection [14, 15]. Since the turn of the century, the county of Hefei City around Chaohu Lake has experienced significant GDP growth, and urbanization and industrialization have broken the ecological surroundings and natural resources as a consequence, hindering the sustainable use of herbal resources. Unlike typical lake problem-solving practices, city lakes will need to be approached from an extra-macroscopic point of view [16], and the study of ecological environmental drivers and spatial and temporal variability in the vicinity around Chaohu Lake is a macro-segment of ecological environmental modifications from the standpoint of the county.
The constructed indicator system is calculated using specific models or formulas, and the indicators are evaluated based on the numerical value of the calculation results, which can be used as a method for making decisions about how to keep the ecological environment and other research objects sustainable [17]. The weights in the TOPSIS approach are normally subjectively assigned by means of specialists and students or calculated by using mathematical equations [18, 19], and the entropy weight approach [20, 21] offers goal-weighting to decide the techniques to categorize the significance of every indicator. The entropy weight TOPSIS technique can enhance the reliability and accuracy of decision-making results. This approach is extensively used in ecological and environmental sectors [22]. For example, the GRA-TOPSIS method was used by Gulishengmu et al. to thoroughly assess the WRCC and de-quantify the WRCC in the oasis city of Shihhezi in the Northwest Manas River Basin, which provides scientific references to strengthen the arid-area oasis city center and promote the oasis city’s sustainable development [23]. To address the resource and environmental carrying capacity of the Loess Plateau, Zhang et al. analyzed and applied the entropy weight TOPSIS approach to analyze typical cities in 24 natural zones of the Loess Plateau [24].
Remote sensing science has the benefits of vast spatial monitoring, quick reassessment capabilities, and low information price [25, 26]. For instance, Shan and coworkers used the ecological index (EI) and the remote sensing ecological index (RSEI) to assess the quality of ecological prerequisites in Changde’s metropolis [27, 28]; Xu and others studied the modern land cowl sorts and ecological stipulations in Xiongan New Area, and the influences of quite a number features, which included land cover, population growth, and city development, based on the ecological prerequisites of the precedent of the Xiongan vicinity in northern China, the usage of an approach based totally on the remote sensing ecological index (RSEI) blended with NDVI, normalized difference salinity index (NDSI), humidity, and (LST) to verify the base ecological conditions [29].
At present, specialists and pupils have made more than a few studies on Chaohu Lake, however, there are no longer any ongoing solutions for the ecological surroundings of the Chaohu Lake area. In view of this, this study takes the ecological surroundings of the Chaohu Lake vicinity as the object of research, and via consulting the Hefei Statistical Yearbook and applicable records platforms, it counts the applicable facts on the ecological surroundings of the vicinity in the previous 5 years and conducts an indicator device of the ecological surroundings drivers of the region. This is constructed, evaluated, and analyzed using the TOPSIS method. Then, we captured the data and examined the temporal and spatial fluctuations in the local natural surroundings using ArcMap 10.7. The goal is to acquire complete evaluation outcomes for the purpose of offering theoretical backing for the management of Chaohu Lake’s ecological surroundings.
Scope and Methods
Scope of the Study Area
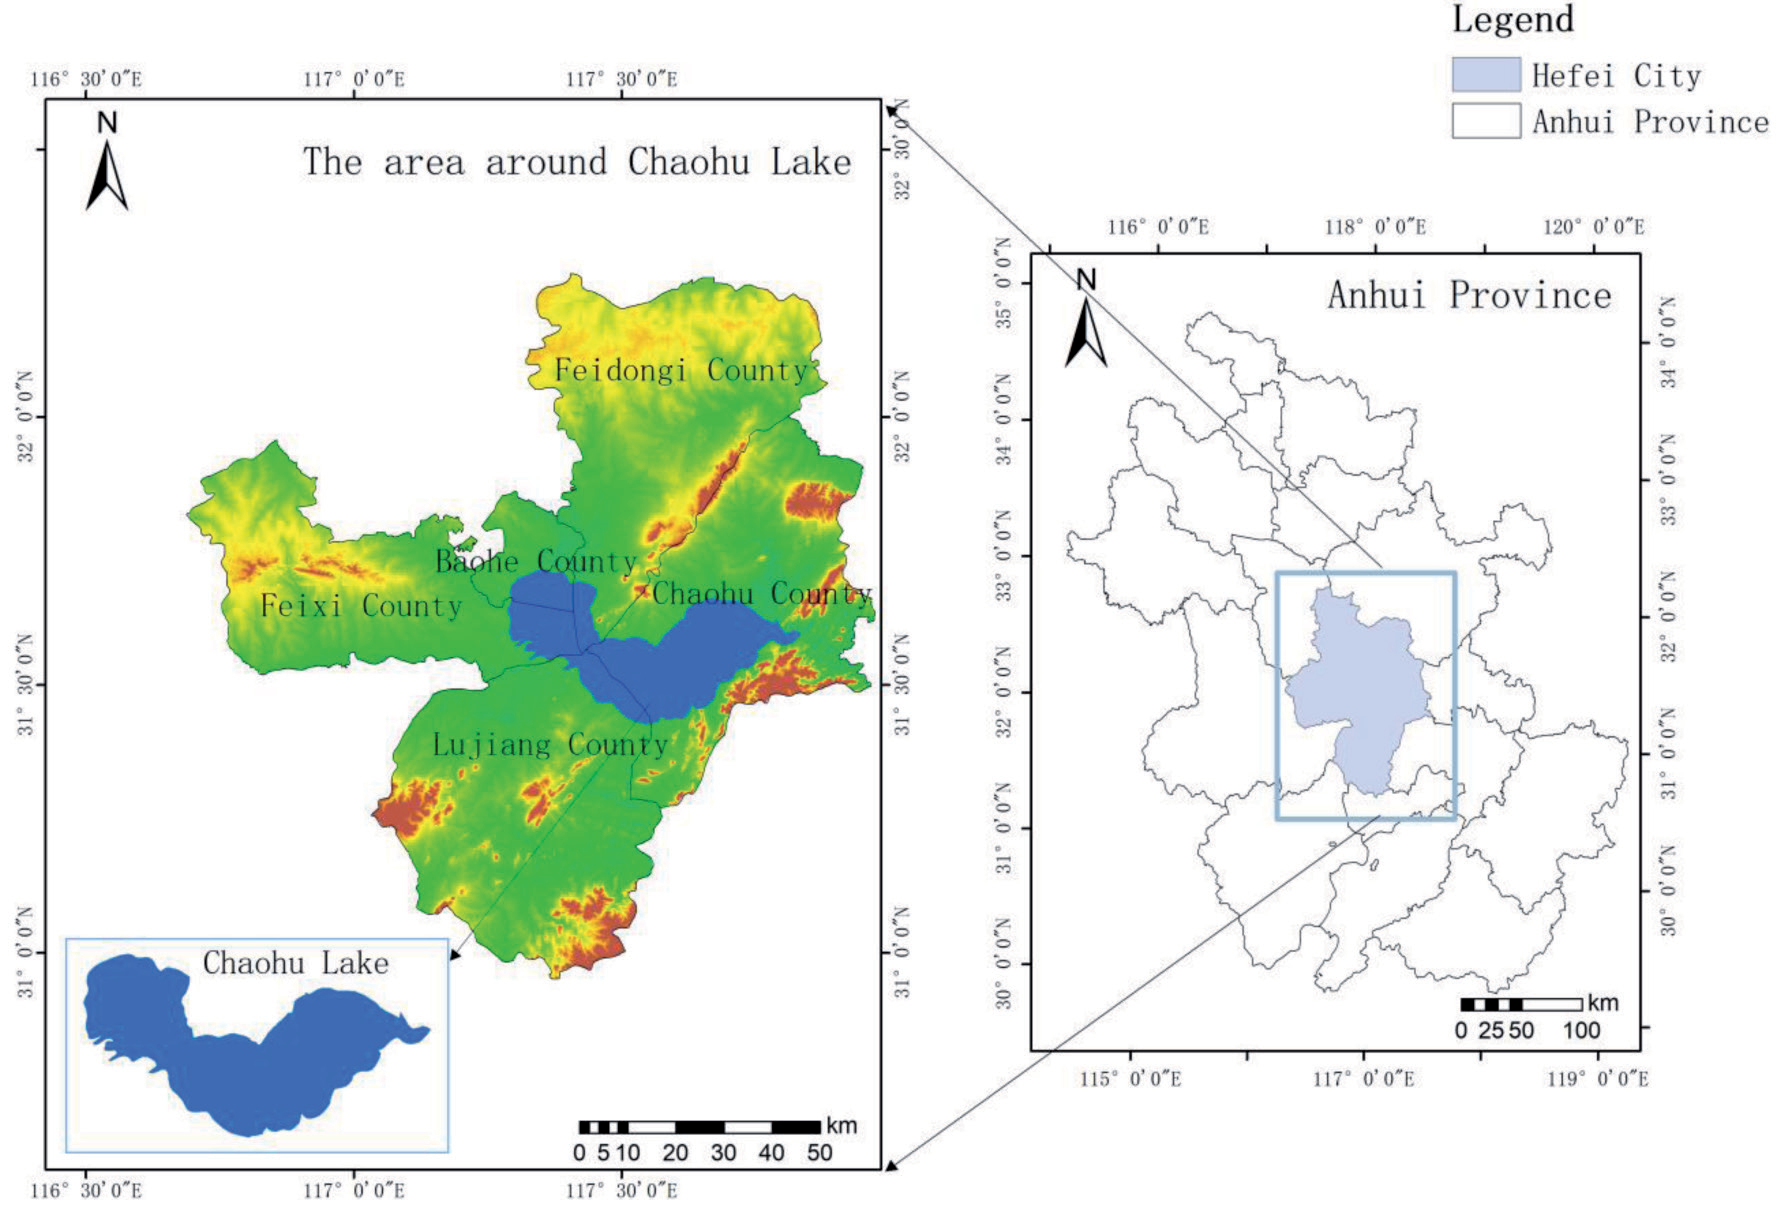
The study region is the vicinity around Chaohu Lake (Figure 1), and the Chaohu Lake basin is located in the province of Anhui, in the southern part of Hefei City, encircled by Lujiang County, Feixi County, Feidong County, Chaohu City, and Baohe District [30]. The basin of Chaohu Lake, which has a total area of 13,486 square kilometres and is 75 percent below sea level, is in the Yangtze River’s lower reaches [31]. The scenic area around Lake Chaohu has a variety of landform types, including mountains, hills, and plains. From inside to outside, its main characteristics are lakes, plains, hills, and mountains. The geomorphological patterns of the Chaohu Lake Scenic Area differ noticeably, and the regional topography is more intricate. The terrain and landforms typically exhibit the traits of a lengthy east-west and a slender north-south. With landscape features like the Hangbu River, Wanfo Lake, and Mushan Island, the Chaohu Lake Scenic Area is abundant in plant and fishery resources. Through the improvement of entertainment tourism, it brings incredible financial and ecological costs to the neighboring residents.
There are 17 counties and five cities inside the Chaohu Lake basin. From the 1980s onwards, with population growth, fast financial improvement, and social activities, the collective air pollution load of Chaohu Lake itself and the level of water air pollution in Chaohu Lake grew increasingly serious. Through the supervision and administration of the Anhui Province Chaohu Lake Management Bureau and different authorities’ agencies, Chaohu Lake’s water quality, which, on average, flows at a rate of 4 billion cubic meters per year into the Yangtze River through the Yuxi River, has been maintained at a stable level of category II [32], with a solid contribution to the environmental advantages of the Yangtze River major stream. The water quality of the entire lake remains at Class Ⅳ, and in contrast with the equal duration in 2022, the eutrophic index of the top and western halves of the lake, and the complete lake, have decreased, and the western half of the lake has accelerated from reasonable eutrophication to moderate eutrophication status. In terms of wetland ecological characteristic enhancement, the biodiversity survey of the wetlands around the lake in 2021 confirmed that the plant sources amounted to 119 families, 362 genera, and more than 560 species, and the chook sources amounted to 18 orders, 73 households, and 303 species. Oriental white storks, green-headed ducks, black-faced spoonbills, and different country-wide treasures have reappeared in Chaohu Lake, and this year, a host of websites in Chaohu Lake additionally discovered the significantly endangered species of yellow-breasted buntings. 800 miles of Chaohu Lake are turning into a fowl paradise. However, the administration of Chaohu Lake is a long-term project, and taking the place around Chaohu Lake as the study object is of excellent importance to the safety and enhancement of the ecological surroundings of Chaohu Lake.
Methods
The entropy weighting technique is a goal-weighting approach that clearly demonstrates the value of each indicator and prevents the influence of subjective factors on the outcome. Currently, this technique is broadly used in the study of indicator gadget contrast [33]. TOPSIS is a well-known technique to deal with the ranking problem of alternatives from the best to the worst. In TOPSIS calculation, the entropy method is used to calculate the weights of all criteria, which can effectively avoid the influence of human subjective factors [34]. For this reason, this paper calculates indicator weights based totally on the entropy weight TOPSIS technique to check ecological and environmental drivers as follows:
Step 1: Ecological environment indicators include a variety of inconsistent data types and unit types, and there may be positive and negative indicators between indicators. Therefore, after raw data collection is completed, the negative indicators need to be inverted, after which the data is normalized. To normalize all the indicators to [0, 1], the minimum-maximum value method is selected as the data normalization method.
Included among these rij is the standardized value for each indicator. rij∈[ 0、1 ]; Xij is the assessment index for every city over several years.
Step 2: Calculate the entropy value.
In the equation,
Step 3: Calculate indicator weights
Step 4: The establishment of a standardized decision matrix, denoted as V, is proposed.
Step 5:Find the perfect answers, both positive and negative:
Step 6:Determine the separation between the positive and negative ideal solutions for each city in different years:
where D+ and D- represent, respectively, the distances between ideal solutions that are positive and negative.
Step 7: Calculate the overall evaluation score:
The proximity of the analyzed target object to the ideal solution is one of these - Cj a larger value of Cj means that the evaluation object is closer to the ideal value and vice versa.
Data and Indicators
Data Sources
The riding pressure indicator device developed in this study includes 21 indicators within the time range of 2018-2022. The most important sources of information and facts used in this study are:
The records of water resources, ecological land use, meteorological warning signs, and air quality come from the Hefei Municipal Statistical Yearbook and the statistical bulletin on county (city) economic and social development nationally in the Statistical Yearbook. Second, the relative humidity statistics in the meteorological warning signs have been taken from the historic information of the Hefei Weather Network (2018-2022). All statistical manipulations have been carried out in SPSSAU and Excel software, and all spatial analyses and mapping has been carried out using ArcMap 10.7 software. In addition, there are considerations for the timeliness, referability, and accuracy of the data. In this study, the ecological environmental drivers and spatial and temporal variants in the circum-Chao Lake vicinity have been investigated in the last 5 years (2018, 2019, 2020, 2021, and 2022).
Construction of the Indicator System
The ecological surroundings device is a complicated gadget containing multiple ecological and social environmental factors. This research takes into account the relevant Ecological Environment Status Index (EI) indicators and combines relevant statistical data with the ecological surroundings of the Chaohu Lake location, considers the effect of elements such as air, climate, hydrology, etc., and selects 21 comparison warning signs from three components to assemble a three-level indicator machine consisting of the goal layer, the criterion layer, and the program layer (Table 1):
Among them, air quality, meteorological indicators, water resources, and ecological land use are the guideline layers of ecological environment drivers (EI) in the Chaohu Lake area:
Table 1.
EI Indicator System for the Chaohu Ring Region
(1) Air quality labeled as B1, including average annual PM2.5 concentration (C1); average annual PM10 concentration (C2); average annual nitrogen dioxide concentration (C3); average annual sulfur dioxide concentration (C4); exhaust gas treatment rate (C5); and annual number of days to achieve air quality objectives (C6). There are four negative indicators and two positive indicators. In general, the lower the annual average concentrations of nitrogen dioxide, sulfur dioxide, PM2.5, and PM10 in a region, the better its air quality, and the higher the annual number of days that the air quality goals are met and the rate of treatment of exhaust gases in a region, the better its air quality.
(2) Meteorological indicators labeled B2 include annual extreme high temperature (C7); annual extreme low temperature (C8); annual average temperature (C9); annual sunshine hours (C10); and annual relative humidity (C11). There are three negative indicators and two positive indicators. Due to current global warming and extreme high temperatures and extreme low temperatures, the ecological environment around Chaohu Lake is being negatively impacted by rising averages. The longer the hours of sunshine and the higher the relative humidity, the more conducive to the ecological stability of the region.
(3) Water resources are labeled as B3, including total water supply from water supply projects (C12); annual precipitation (C13); irrigated area of arable land (C14); expenditure on agricultural, forestry, and water construction (C15); total water abstraction by industry (C16); and the centralized treatment rate of urban sewage treatment plants (C17). The indicators are all positive, and water resources are essential to ecological advancement. As a matching water resource’s amount increases, so does the ecological environment’s quality.
(4) Ecological land is labeled B4 and includes: area of planted forests (C18); area of built-up areas (C19); built-up areas’ percentage of green space (C20); and area of forest cover (C21). There is one negative indicator and three positive indicators. The size of the built-up area indicates how urbanized the area is, and its growth directly affects the ecology. The area of planted forests, the greening coverage of built-up areas, and the area covered by forests reflect society’s efforts to improve the ecological environment, and the stronger the efforts, the higher the corresponding value.
Discussion and Conclusions
Comprehensive Evaluation of the Chaohu Rim Region 2018-2022
From 2018-2022 (labeling 2018-2022 as H1, H2, H3, H4, and H5, respectively), the EEIF (Ecological Environment Influencing Factors) composite index of the Chaohu Rim area decreases from 0.568 to 0.398. The EEIF composite indexes of the Chaohu Rim area for the years 2018-2022 are 0.568, 0.395, 0.405, 0.352, and 0.398 (Table 2). This shows that China is consistently deepening insights into inexperienced development, proposing precise environmental and ecological safety strategies, and adopting ecological environmental safety measures. However, Hefei City, as the capital of Anhui Province, is stepping up its efforts to develop, and the development of Chaohu Lake is additionally accelerating, which inevitably impacts the ecological surroundings to a positive extent. Overall, the ecological surroundings of the Chaohu Lake region suggest a small rebound trend:
(1) The composite index of EEIF in the circum-Chao Lake region showed a significant decrease in 2018-2019. In terms of indicator weights, the weight coefficient of the annual cultivated irrigated area (C14) accounts for the highest proportion, reaching 0.1682, and the weight coefficients of other indicators are between 0.02 and 0.06. Moreover, the irrigated area of arable land (C14), which is a negative indicator, increased from 90.57 to 384.52 thousand hectares in one year, with a cumulative increase of 293.95 thousand hectares, which resulted in the ecological environment index declining, and the annual precipitation (C13) fell from 5324.50 mm to 3467.60 mm, with a total decrease of 1856.90 mm, and the positive indicator of annual precipitation (C13) caused a decrease in the ecological environment index. The three negative indicators of average annual PM2.5 concentration (C1), average annual PM10 concentration (C2), and annual average concentration of sulfur dioxide (C4) decreased by 13.60 μg/ m3 , 25.80 μg/ m3 , and 12.00 μg/ m3 , respectively, which pushed the ecological environment index upward. The annual extreme low temperature (C8) rose from -44 degrees Celsius to -24 degrees Celsius, the annual sunshine duration (C10) rose by 483.7 hours, the expenditure on agriculture, forestry, and water construction (C15) rose by 1,548.69 million yuan, and the area of planted forests (C18) rose by 2,495.8 hectares. The rise of the four positive indicators, annual extreme low temperature (C8), annual sunshine hours (C10), expenditure on agriculture, forestry and water construction (C15), and area of planted forest (C18), increased the ecological environment index. Although the number of positively influencing indicators is greater than the number of negatively influencing indicators, on the whole, negative factors are much more influential than positive factors. This is related to the fact that Hefei City has been vigorously promoting urban modern agriculture since 2018. The integration of machinery into agricultural development has led to a continuous rise in the quality, efficiency, and competitiveness of agriculture in Hefei. Between 2018 and 2019, Hefei’s total grain output reached 3,013,500 tons, an increase of 86 percent compared to 1987, the total power of agricultural machinery reached 4,850,000 kilowatts, and the comprehensive level of mechanization of major crops reached 81.7 percent. Vigorously developing agriculture is driving rural economic development in Hefei City, and the irrigation efficiency of agricultural arable land is dramatically improving while the area of arable land is expanding, with a significant impact on the ecological environment.
(2) There is a slight increase in the composite index of the EEIF in the Chaohu Ring in 2019-2020. In terms of negative factors, the negative indicators have an increase of 4.96 micrograms per cubic meter in the sulfur dioxide annual average concentration (C4), and an increase of 46,034,111,000 cubic meters in the total amount of water withdrawn by industry (C16); and the positive indicators are a decrease of 16.30 degrees Celsius in the annual extreme low temperature (C8), a decrease of 626.50 hours of annual sunshine (C10), and a decrease of 11,657,700 artificial afforestation area (C18) hectares. In terms of positive factors, the negative indicators PM2.5 annual average concentration (C1) decreased by 37.48 micrograms per cubic meter, PM10 annual average concentration (C2) decreased by 42.1 micrograms per cubic metre, and average annual nitrogen dioxide concentration (C3) decreased by 36.99 micrograms per cubic metre; and the positive indicators annual number of days of compliance with the air quality standards (C6) increased by 196 days, annual precipitation (C13) increased by 2310.3 mm, annual precipitation (C13) increased, expenditure on agriculture, forestry, and water construction (C15) increased by 98.502 million yuan, and the area covered by forests (C21) increased by 6257.67 hectares. Overall, the positive impact is slightly higher than the negative impact, which is attributable to Hefei City accelerating the construction of urban environment, landscaping, and parks in 2019, strongly implementing the construction of projects such as the Ecological Demonstration Zone around Chaohu Lake, urban double repair and water environment treatment, and promoting and encouraging the application of new energy and green travel, so as to curb the negative ecological impacts of the area around Chaohu Lake and allow the city to build while maintaining ecological environment sustainability.
(3) There is a small decrease in the EEIF composite index of the Chaohu Ring in 2020-2021. In terms of indicator data, the negative indicator PM10 annual average concentration (C2) increased by 30.6 µg/ m3, the total amount of industrial water withdrawal (C16) increased by 26,271,434,000 cubic meters; the positive indicator total water supply from water supply projects (C12) decreased by 119,671,800 cubic meters, the annual precipitation (C13) decreased by 1,411.7 millimeters, the area of planted forests (C18) decreased by 2739.4 hectares, the expenditure on agriculture, forestry, and water construction (C15) increased by 217.18 million yuan, and the area covered by forests (C21) is 47,776.33 hectares. In addition to the rest of the indicators, there are no significant changes. The reason for this is that in 2020, Hefei City was actively coping with the impact of the epidemic through industrial modernization and upgrading, supporting excellent economic growth, and it gained obvious results. The city’s GDP grew by 4.3 percent year-on-year at comparable prices, so the ecological environment was marginally affected. At the same time, Hefei is also pursuing the concept of green development, so that the socio-economic rebound will not lead to a huge decline in the ecological environment.
(4) There is a small rebound in the EEIF composite index for the Chaohu Rim from 2021 to 2022. In terms of positive influencing factors, the average annual PM10 concentration (C2) decreases by 14 micrograms per cubic meter, the average annual level of nitrogen dioxide (C3) decreases by 10 micrograms per cubic meter, the annual extreme low temperature (C8) rises by 15.4 degrees Celsius, the expenditure on agriculture, forestry, and water construction (C15) increases by 195.42 million yuan, and the total volume of industrial water abstraction (C16) decreases by 31.0768 million cubic meters. In terms of negative influencing factors, the annual extreme high temperature (C7) rises by 19.9 degrees Celsius, the annual relative humidity (C11) decreases by 19.59% RH, and the area covered by forests (C21) decreases by 50,808.4 hectares. The positive impact is higher than the negative impact, which pushes the ecological environment index up. This is related to the policy of ecological civilization construction vigorously implemented in Hefei City in 2021. The Hefei Ecological Environment Bureau deeply promotes the comprehensive treatment of Chaohu Lake, strengthens ecological environment law enforcement and supervision, and reinforces the “control of coal”, “control of gas”, “control of vehicles”, “control of the environment”, and “control of the environment”. “Control vehicle”, “control dust”, “control burning” and the other five “control” governances have been impacted by the integration of scientific and technological means of ecological environmental management. Consequently, the Chaohu Lake region’s ecological environment has been slightly improved.
Comparison of One City, One District, and Three Counties around Chaohu Lake
Five-Year Aggregate Comparison
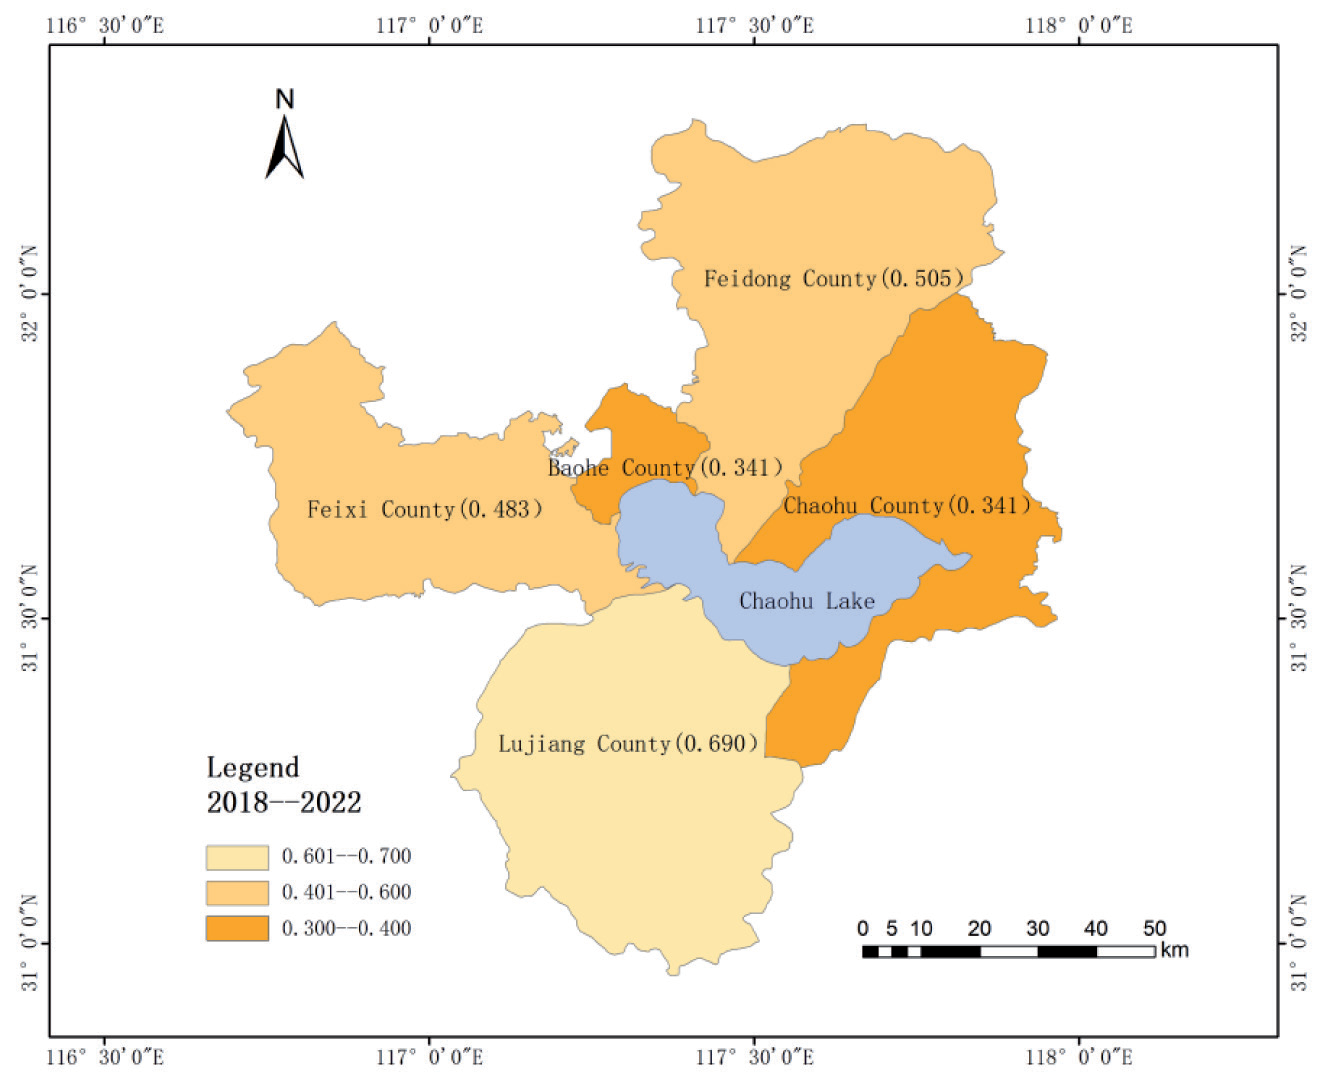
In this study, the entropy weight TOPSIS method was used to determine the full relative proximity of one city, one district, and three counties around Chaohu Lake during the five-year period from 2018 to 2022. Using ArcMap 10.7 software, the ecological environment’s proximity is divided into three different time intervals, and the distribution map of the five-year comprehensive evaluation level of each area is drawn (Figure 2). This is a precise reflection of how the spatial distribution traits of the natural environment surrounding Chaohu Lake can be obtained.
The Lujiang County area around Chao Lake has the best ecological conditions from 2018 to 2022, which has a relative proximity of 0.690, much higher than the other four regions, and has the best comprehensive ecological environment. The second is Feidong County and Feixi County, with relative proximity of 0.505 and 0.483, respectively, indicating that the comprehensive ecological environment of Feidong County and Feixi County is relatively close. The last is Baohe District and Chaohu City; which has a relative proximity is 0.341, and the worst comprehensive ecological environment. The main reason is related to the economic level of each area, Lujiang County GDP for Hefei City 9 districts and counties is the lowest, while the population of Lujiang County in Hefei City districts and counties is the lowest, the corresponding degree of industrial pollution is the smallest, ecological and environmental impact is the weakest. Baohai District GDP is second only to Shushan District, located in Hefei City, with districts and counties in 2nd place and population in 3rd place, due to the economic level of the leading demand for resources, so that the ecological environment has the greatest impact. Regarding population and economic development, Feidong County and Feixi County are close to one another, and both are in the middle of Hefei City districts and counties, with moderate impacts on the ecological environment.
The GDP of Chaohu City is located at the bottom level among the districts and counties in Hefei City, but the ecological environment composite index during the five-year period is the same as that of Baohe District. The reason for this is that a large quantity of industrial wastewater, domestic sewage, and agricultural sewage was discharged into Chaohu Lake, so that the water quality of Chaohu Lake has been notably damaged. Chaohu City in the Baohe District, Feidong County, Feixi County, and Lujiang District account for the longest shoreline of the Chaohu Lake lakes. The ecological and environmental impacts of Chaohu City are also the largest. On this basis, the economic level is not dominant among the districts and counties in Hefei City, and the lack of funds to improve the ecological environment has led to a low scoring on the comprehensive ecological environment index.
Five-Year Year-by-Year Comparison
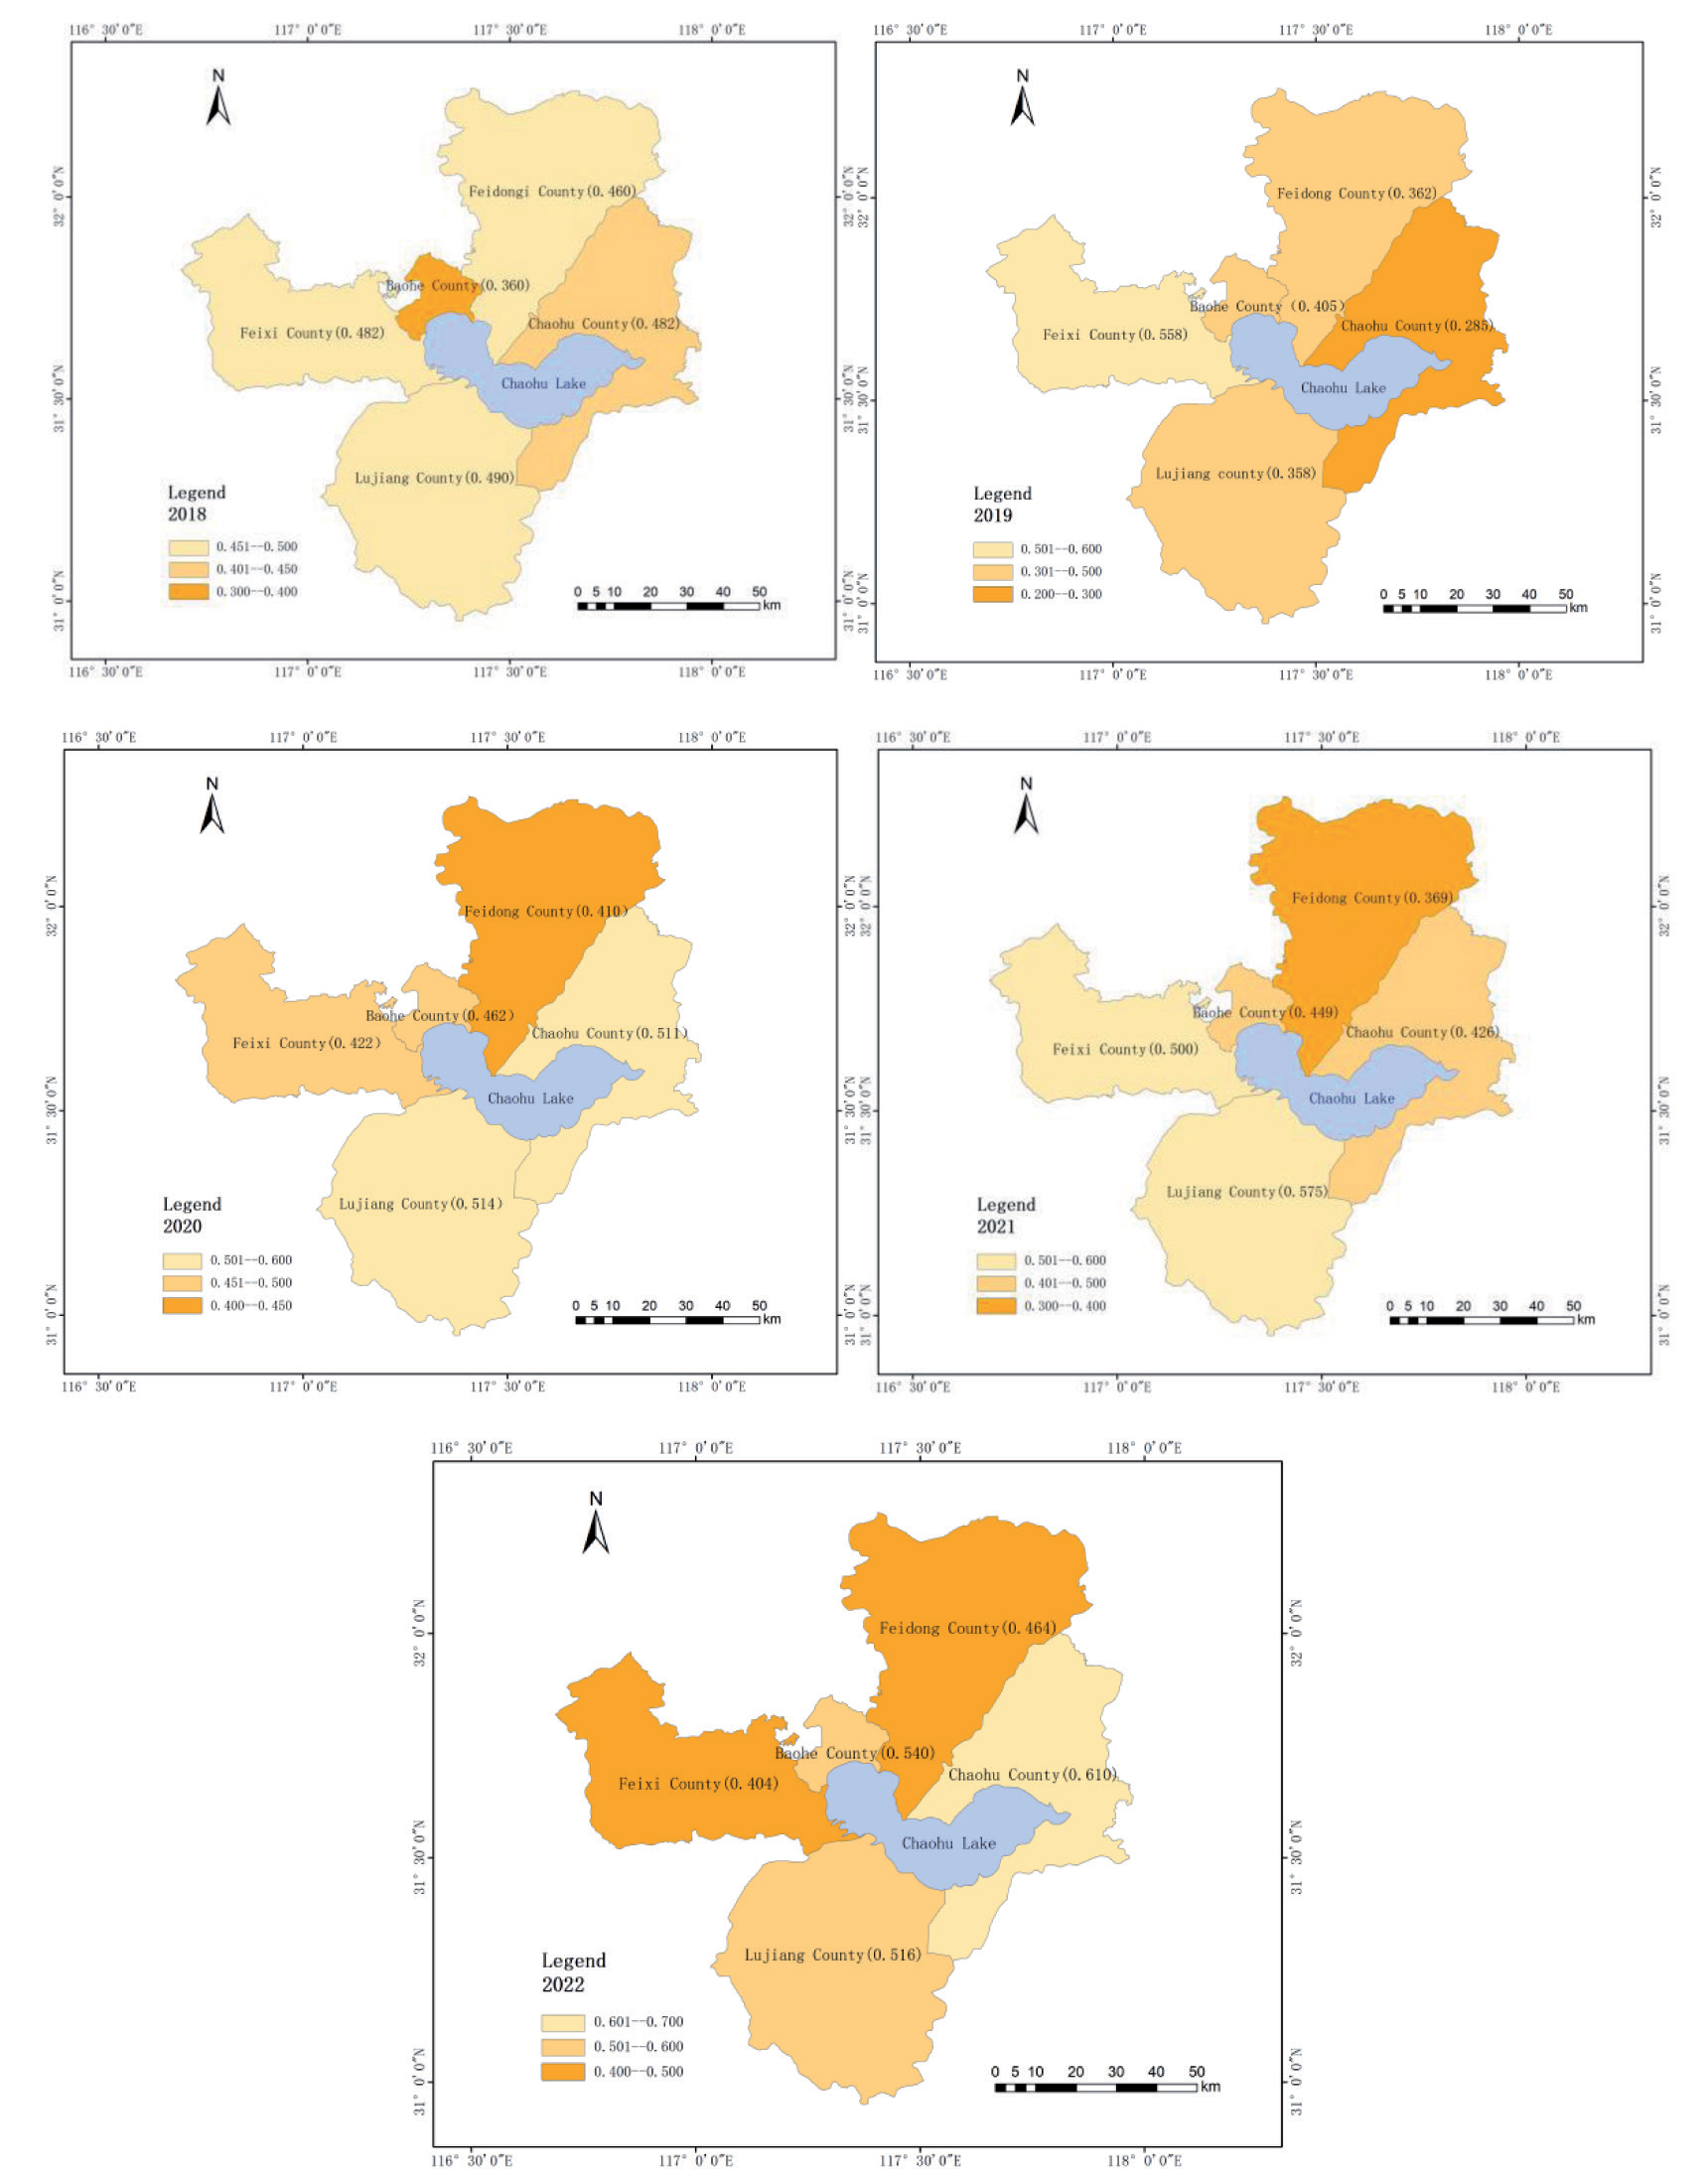
The relative proximity of one city, one district, and three counties around Chaohu Lake in 2018, 2019, 2020, 2021, and 2022 were calculated using the entropy weight TOPSIS method. Using ArcMap 10.7 software, the year-by-year relative proximity of the ecological environment was divided into three different intervals, and the distribution of evaluation grades of each area in the same year was plotted (Figure 3).
(1) From 2018 to 2022, Baohe District’s relative proximity will be 0.360, 0.405, 0.462, 0.449, and 0.540, respectively, demonstrating an ongoing upward trend. The ecological environment of Baohe District is the lowest in comparison with the other four regions in 2018, and then it is steadily improving in the following years, which is related to the importance of Baohe District in green eco-construction in the past five years. In 2022, Baoha District, Hefei City, initially completed the preparation of a five-year construction implementation program for the park city (city) area, and increased the capital investment in gardening and greening through government-led, social financing and other diversified modes. Since 2021, it has completed the addition of a new greening area of 531,300 square meters and upgraded the quality of the greening of key city parks, such as the Inter River Ecological Park and the level of infrastructure construction. These initiatives have brought effective improvements to the ecological environment of Baohe District.
(2) The relative proximity of Chaohu City from 2018 to 2022 is 0.412, 0.285, 0.511, 0.426, and 0.610, respectively, with an overall increase in ups and downs. The relative proximity of Chaohu City in 2022 reaches the highest value, and it is also the highest relative proximity value of the various regions in the last five years, which indicates that the city of Hefei’s thorough management of Chaohu Lake’s ecological environment has obvious benefits. Comprehensive management has obvious results. In 2014, the Chaohu Lake Basin was approved as the first batch of national ecological civilization advance demonstration zones, and the Chaohu Lake Basin’s comprehensive management and restoration of water ecology was subsequently the focus of a pilot project launched by Hefei City, which established ten major wetlands around the Chaohu Lake and implemented the Chaohu Lake ecosystem protection and restoration project, so that water quality in the city of Chaohu Lake would reach its best since records began (by 2022). The development plan of Chaohu City has begun to shift to the eco-tourism industry, entrepreneurial parks, and agricultural parks. Government support, ecological environment management, and development transformation have improved the ecological environment of Chaohu City.
(3) The relative proximity of Feidong County from 2018 to 2022 is 0.460, 0.362, 0.410, 0.369, and 0.464, respectively, with an overall horizontal fluctuation. The relative proximity of Feidong County in 2018 and 2022 is basically unchanged, and the relative proximity in 2019 and 2021 is at a lower level. This is due to the fact that Feidong County vigorously develops its economic level, and promotes the comprehensive reshaping of the industrial pattern with major projects, but it does not pay enough attention to green ecological development, which makes the ecological and environmental conditions in Feidong County lacking.
(4) The relative proximity of Feixi County for the years 2018-2022 is 0.482, 0.558, 0.422, 0.500, and 0.404, respectively, showing small fluctuations overall. The overall relative proximity of Feixi County during the five-year period is above 0.400, and the relative proximity in 2020 and 2021 reaches above 0.500, but the relative proximity in 2022 is the lowest across the five years. The reason for this is that the economic level of Feixi County is constantly improving, the growth of the manufacturing sector is leading the way in the nation’s counties, and it is pursuing high-quality development. But there are deficiencies in ecological environmental governance, which makes the ecological environmental level of Feixi County unstable and unbalanced.
(5) The relative proximity of Lujiang County in 2018- 2022 is 0.490, 0.358, 0.514, 0.575, and 0.516, respectively, and the overall trend shows a slight increase. The relative proximity of Lujiang County in the last three years has been maintained above 0.500, which is related to the strict control of Lujiang County in recent years in minimizing environmental impact, making every effort to protect the green water and green mountains. Lujiang County strictly urges mining enterprises to control the increment of damaging the environment at the source, in accordance with the «Program for Geological Environment Protection and Land Reclamation in Mines». At the same time, Lujiang County has been adhering to green development for the past ten years and is actively developing tourism projects, and these initiatives boost Lujiang County’s ecological and environmental quality and show a small improvement.
Discussion and Conclusions
Discussion
Importance of Ecosystem Assessment
Continuous adjustments in human activities and local weather systems have drastically affected and altered the ecological surroundings on one-of-a-kind scales [35]. Moreover, there are considerable regional variations in financial development, which is introduced by the guidance of authorities insurance policies [36]. Economic improvement and ecological improvement are both inhibited. Excessive financial improvement will inevitably injure the ecology, which will constrain financial improvement. This may include natural disasters, environmental pollution, and aid scarcity [37, 38].
The evaluation of ecological surroundings drivers should consider the present-day repute of ecological surroundings in the study vicinity by acquiring facts on the spatial distribution of every important factor, such as water resources, land resources, environment, and ecological environment. By contrasting the ecological quality of the surrounding environment, it is viable to predict the improvement of ecological surroundings and recognize the particular elements affecting the surroundings as an end result of financial improvement and human activities. It is given to neighborhood governments for reference and proposes reasonable and efficient measures to protect the ecological environment.
Status of the Regions around Chaohu Lake
Based on the above analyses, it is determined that the universal ecological circumstances of the Chaohu Lake Rim region is declining, the ecological surroundings of every location, indicating a rebound trend. In this regard, this study places the following points for specific regions:
(1) The average scenario of Feidong County and Feixi County is similar across population size, ecological surroundings, and monetary standing. In current years, Feidong County and Feixi County have been vigorously advertising financial development, and at the same time have taken corresponding moves to preserve and enhance the ecological environment, so that the ecological surroundings are maintained. However, the ecological surroundings as a total have no longer been appreciably improved. Feidong County and Feixi County have to make stronger administrations for the ecological surroundings on the basis of the unique foundation.
(2) Baohe District and Chaohu City have the worst ordinary ecological surroundings circumstances in 5 years. Baohe District has suffered the most negative impact on its ecological environment due to its economic development, far surpassing the other four regions. The ecological environment of Chaohu City is most negatively impacted by the water quality of Chaohu Lake, which has the lake’s longest shoreline. At the same time, the monetary investment of the districts and counties of Hefei City lags behind, as do the average ecological surroundings in different regions. However, a 12-month evaluation discovered that the ecological surroundings of Baohe District and Chaohu City confirmed a widespread upward trend, which suggests that the region, when realizing that the ecological surroundings are out of the equation, made well-timed countermeasures to inhibit the deterioration of the problem, so that the ecological surroundings have been elevated.
(3) The universal ecological surroundings of Lujiang County are the largest among the 4 regions, however, industrial improvement lags behind. Thus, Lujiang County changed its development goal, using the advantages of the ecological environment to create an eco-city and develop eco-tourism projects, which also promote the economic development of Lujiang County from the other side.
(4) The average ecological surroundings stage in the Chaohu Lake Ring region was at its best in 2018, and the relative proximity of the ecological surroundings in the following 4 years has been maintained at the relative degree stage. Keeping the ecological surroundings at a sure degree indicates that Hefei City has made efforts to control the ecological environment, however, there is no apparent style of rebound overall, and the administration wishes to be strengthened. In particular, there is a focus on industrial and agricultural improvement in the surroundings, which is intuitively obvious. The proper administration of industrial and agricultural waste has to be increased, the safety of ecological environments and ecological wetlands has to be strengthened, and the ecological crimson line administration mechanism ought to be strictly implemented.
Conclusions
This study calculates the relative proximity of the ecological surroundings in the circum-Chao Lake vicinity from 2018-2022, demonstrates the regional ecological environment’s drivers and characteristics of spatial and temporal divergence, and has the following key conclusions:
(1) The ecological surroundings in the Chaohu Lake vicinity are typically average, being the finest in 2018 while indicating a sizable decline in 2019. In this respect, Hefei City is advertising city current agriculture, and a massive quantity of equipment is dedicated to agricultural development. While enhancing the irrigation effectivity of agricultural arable land, the location of arable land is additionally expanding, again affecting the ecological environment. However, as time went on, the ecological environment did not continue to deteriorate, and the relative proximity of the ecological surroundings used to be maintained at around 0.400, with an upward trend in 2022. In 2021, the Hefei City Bureau of Ecology and Environment deeply pushed ahead the complete remedy of Chaohu Lake, reinforced the ecological surroundings regulation enforcement and supervision, bolstered the “control of coal”, “control of gas”, “control of vehicles”, “dust control”, and “burning control” of the “five control” governances, so for Hefei City, the complete administration of the ecological surroundings has begun to bear fruit. The authorities ought to formulate applicable insurance policies on ecological surroundings safety and give a boost to supervision.
(2) Comparing the ordinary ecological environment degree of every vicinity in the course of the five-year period, Lujiang County is the best, followed by Feidong County and Feixi County, and Baohe District and Chaohu City are the worst. The reason for this is that the financial stage of Lujiang County is the lowest in Hefei City, with a small resident population, and the weakest has an impact on the ecological environment. Feixi County and Feidong County have comparable ordinary monetary and demographic conditions, and are positioned in the center of Hefei City’s districts and counties, with reasonable ranges of ecological impact. Baohe District has the easiest degree of monetary development, and therefore has the biggest negative effect on the ecological environment. Chaohu City is the most affected because of Chaohu Lake, and at the same time, the financial stage is lagging when compared to Hefei City districts and counties. The basic ecological surroundings lag behind different regions.
(3) The rising and falling conditions of ecological surroundings in male or female dominated areas are especially obvious, such as Chaohu City and Baohe District displaying a rising trend, and Feixi County displaying a falling trend. The relative proximity of the ecological surroundings in Chaohu City rose with the aid of 0.198, the most impressive rise. Hefei City carried out a pilot water ecology complete remedy and restoration for the Chaohu Lake Basin, and hooked up ten foremost wetlands around Chaohu Lake, so that the water quality of Chaohu Lake City will rose to significant levels in 2022, and the ecological surroundings of Chaohu Lake City have been appreciably improved. Followed through Baohe District, up 0.180, in the previous 5 years, Baohe District has invested a lot of cash into landscaping and greening, including Inter River Ecological Park and different key city parks to enhance the quality of greening and the degree of infrastructure construction, Baohe District’s ecological environment has been successfully improved. However, the ecological surroundings of Feixi County reached its peak 2019, and reached its lowest point in 5 years in 2022, with a distinction of 0.145. Due to the non-stop enhancement of the financial development of Feixi County, it is actively engaged in incredible development, and the manufacturing enterprise has reached the forefront of regions in the country, however it has overlooked ecological surroundings management, therefore, Feixi County, in contrast to different regions, has to pay greater interest to the upkeep and enhancement of the ecological environment.
(4) Combining the weighting coefficients of the symptoms for every 12 months and for the five-year period as a whole, the 4 indicators, namely, the common annual awareness of nitrogen dioxide (C3), the common annual attention of sulfur dioxide (C4), the common annual temperature (C9), and the irrigated region of arable land (C14), will have an impact on the ecological surroundings from 2018 to 2021. Among the weighting coefficients of the indications in 2022, there are no notable statistics to consider, and the weighting coefficients of the indications are all under 7 percent, with the typical ecological surroundings stabilizing. This shows that the enhancement of the ecological surroundings has no longer provided notable results, and Hefei City remains the center of attention on the above 4 warning signs to enhance the quality of the ecological environment.

