

Introduction
China’s 14th Five-Year Plan emphasizes environmental protection, the acceleration of green and low-carbon development, and the continuous improvement of environmental quality [1]. Industrialization, a necessary phase in the economic development of every country and region, has typically involved unsustainable energy consumption and extensive exploitation of natural resources, resulting in long-term negative impacts on the ecological environment [2, 3]. Historically, economic growth has been considered the primary factor influencing environmental pollution [4, 5]. When income levels are low, environmental quality tends to decline with economic growth, whereas, at higher income levels, environmental quality improves with economic growth, displaying an inverted U-shaped relationship between economic growth and environmental pollution [6]. Numerous studies have validated this hypothesis from various perspectives.
Since Marshall proposed the theory of industrial agglomeration in 1890, the impact of industrial agglomeration on productivity has attracted widespread attention from scholars [7-9]. This is particularly true in rapidly industrializing and urbanizing developing countries, where industrial agglomeration is widely accepted as a key driver of economic growth. However, while industrial agglomeration promotes economic growth, it also significantly impacts the ecological environment [10, 11]. According to the theory of agglomeration externalities, industrial agglomeration reduces production and transaction costs, increases labor productivity, and promotes knowledge dissemination and technological innovation through inter-firm learning and exchanges. This can enhance resource use efficiency and improve the ecological environment. Conversely, industrial agglomeration can lead to concentrated production and population, increasing total energy consumption and concentrated pollutant emissions, negatively impacting environmental quality [12-14].
Empirical research on the opposing effects of industrial agglomeration on environmental pollution yields varied conclusions. One view suggests that industrial agglomeration improves environmental quality. Effiong’s research indicates that industrial agglomeration has significant positive externalities on the ecological environment [15]. Otsuka et al. found that manufacturing agglomeration improved Japan’s energy efficiency and reduced pollutant emissions [16]. Similarly, Han et al.’s study on panel data from Chinese cities reached the same conclusion [17]. Chen et al. argued that the agglomeration of industrial enterprises could effectively reduce CO2 emissions per unit of economic output [18].
Another perspective posits that industrial agglomerations exacerbate environmental pollution. Pandey and Seto found that the expansion of industrial land due to agglomeration significantly deteriorated water quality in India. Liu et al. discovered that although the negative environmental effects of industrial agglomeration in China weakened after entering the “new normal,” it still exacerbated industrial pollution levels [19]. Dong et al. demonstrated that industrial agglomeration intensified environmental pollution, with the degree of impact varying significantly across regions [20]. Another view suggests that the relationship between industrial agglomeration and environmental pollution is not simply linear and may exhibit U-shaped or inverted U-shaped characteristics [21].
In this context, industrial agglomeration plays a dual role in its impact on the environment, further complicating the relationship between economic development and ecological sustainability [22]. On the positive side, industrial agglomeration can lead to increased resource efficiency, reduced production costs, and enhanced technological innovation, all of which contribute to improved environmental quality. Concentrated industries benefit from economies of scale, shared infrastructure, and knowledge spillovers, which can foster the development of cleaner technologies and more sustainable practices. For instance, agglomerated firms often have better access to resources and information that enable them to adopt more efficient production methods, thereby reducing their overall environmental footprint [23].
However, the concentration of industrial activities also has potential negative consequences for the environment. Agglomeration can result in higher energy consumption and increased emissions of pollutants due to the intensified industrial activities within a specific region. The clustering of industries can exacerbate local environmental degradation, leading to issues such as air and water pollution, increased waste generation, and the overexploitation of natural resources. Moreover, the environmental impact of industrial agglomeration is often magnified in regions with inadequate regulatory frameworks or weak enforcement of environmental standards, where the negative externalities of industrial concentration are not effectively mitigated.
Existing literature provides a valuable foundation for understanding these dynamics. However, there is a relative paucity of studies that incorporate economic growth, industrial agglomeration, and ecological environment quality into a unified analytical framework to explore their interrelationships. This study analyzes the coupling coordination degree between industrial agglomeration, industrial added value, and ecological environment quality using the coupling coordination degree model and the Logarithmic Mean Divisia Index (LMDI) model. It aims to explore the spatiotemporal changes in industrial agglomeration, ecological environment quality, and industrial economic development in China and quantitatively analyze the dominant factors influencing changes in the coupling coordination degree. The findings are intended to provide theoretical references and scientific suggestions for formulating regional sustainable development strategies and ecological protection policies in China.
Materials and Methods
Data Sources
This study conducts a statistical analysis of data from 31 provinces in China (excluding data from Hong Kong, Macau, and Taiwan due to data availability issues). The data on industrial agglomeration levels, such as total industrial output and industrial labor force numbers, are sourced from the “China Industrial Statistical Yearbook” from 2004 to 2023. Data on ecological environment quality, such as forest coverage rate, per capita water resources, and per capita arable land area, are obtained from the “China Environmental Statistical Yearbook” from 2004 to 2023. Other relevant data, such as provincial gross domestic product (GDP) and total labor force, are drawn from the “China Statistical Yearbook” from 2004 to 2023.
Research Methods
Measurement of Industrial Agglomeration Level
AGG represents the degree of industrial agglomeration, reflecting the level of industrial concentration. The AGG indicator is calculated using the Location Quotient (LQ) index. The formula for calculating LQ is as follows:
Where ei represents the total industrial output of region i, Ei represents the gross domestic product (GDP) of region i, and j represents the provinces of China. A Location Quotient (LQ) equal to 1 indicates that the industrial activity in the region has the same level of concentration as the reference area. An LQ less than 1 indicates a lower level of industrial agglomeration in the region, while an LQ greater than 1 indicates a higher level of industrial agglomeration.
Evaluation of Ecological Environment Quality
This study constructs an indicator system for evaluating ecological environment quality and calculates the weight of each indicator using the entropy weight method [24]. To ensure the evaluation indicators are scientifically sound, several principles were followed. The selected indicators should make the indicator system clear and easy to understand while ensuring reliable results with as few indicators as possible. Additionally, easily accessible indicators should be chosen to minimize evaluation costs. When selecting evaluation indicators, the characteristics of the evaluated object must be clearly defined to ensure the constructed indicator system has a reliable scientific basis. It is crucial to ensure that related indicators at the same level maintain their independence and do not overlap. Indicators should complement each other to ensure sufficient accuracy in the evaluation results. When selecting indicators, it is important to understand the specific causes and characteristics of the indicators at different levels. Research should start from a broad perspective, capturing the overall picture before delving into detailed aspects to ensure accuracy. This creates a hierarchical indicator system that is clear, understandable, and easy to interpret. The final conclusions should be comparable over time and across regions to identify differences and their causes, and the indicators should be easily quantifiable to ensure the reliability of the evaluation results.
Based on these principles, this study selects forest coverage rate, per capita water resources, per capita arable land area, and the number of days with air quality of Grade II or above to construct an evaluation indicator system for ecological environment quality using the entropy weight method. As the entropy weight method is a commonly applied approach, the specific calculation process is not demonstrated here. The entropy weight method is a statistical technique used to determine the weight of each indicator in a comprehensive evaluation system [24]. Unlike subjective weighting methods, the entropy weight method is based on the degree of variation or disorder among data points. Indicators with greater variability are assigned higher weights, reflecting their relative importance in the evaluation process. This method ensures an objective assessment of the indicators by quantifying the information contained within the data. Using the weights obtained from the ecological environment quality evaluation system, we calculate the comprehensive score of ecological environment quality using the following formula:
Where Si is the comprehensive score of ecological environment quality, Wj represents the weight of the j-th indicator, and X'ij represents the standardized data value.
Tapio Model
The “decoupling” theory originated from the concept of “decoupling” in physics and was first proposed by the OECD to describe breaking the link between “environmental pollution” and “economic goods.” The Tapio decoupling model uses an elasticity analysis method based on the time period to derive a decoupling elasticity coefficient, which dynamically reflects the decoupling relationship between variables, thereby making the analysis results more accurate and objective [25, 26]. Based on the decoupling elasticity coefficient method proposed by Tapio in studying the relationship between economic development, traffic capacity, and carbon emissions in Europe, this study constructs a corresponding decoupling index model according to the relationship between industrial agglomeration level, ecological environment quality, and industrial added value:
Where εAGG, S represents the decoupling index between industrial agglomeration level and ecological environment quality, and εAGG, G represents the decoupling index between industrial agglomeration level and industrial added value. ΔAGG denotes the difference in industrial agglomeration level between the current period (2022) and the base period (2003), ΔS denotes the difference in ecological environment quality between the current period and the base period, and ΔG denotes the difference in industrial added value between the current period and the base period.
Coupling Coordination Degree Model
The coupling coordination degree model is primarily used to reflect the state of coupling coordination achieved through the interactions between two or more systems under the influence of internal and external factors [27, 28]. This model not only reflects the intensity of coupling between systems but also the strength of coordination between them. When both the coupling degree and coordination degree between systems are high, the system is considered to have achieved a positive coupling. The coupling coordination degree model is used to quantify the coupling coordination degree among the levels of industrial agglomeration, ecological environment quality, and economic development in China. The formula is as follows:
Where I, E, and G represent the industrial agglomeration level, ecological environment quality, and industrial GDP, respectively. The coupling degree (C) indicates the degree of interaction and influence between the systems. The comprehensive coordination index (T) indicates the overall development level of the systems. The coupling coordination degree (D), which combines C and T, provides a more comprehensive evaluation of the development status of the two systems. The coefficients α, β, and γ represent the relative importance of the three subsystems: industrial agglomeration level, ecological environment quality, and industrial GDP, respectively. In this study, the entropy weight method is used to determine the specific values of α, β, and γ. Additionally, based on Zeng et al.’s research, this study classifies the coupling coordination degree into four categories (Table 1).
LMDI Model
Index Decomposition Analysis (IDA) is a method for quantitatively analyzing the impact of various influencing factors on dependent variables. It has been widely used in past studies, particularly in the fields of energy consumption, carbon emissions, and environmental changes. Among the many IDA models, the Logarithmic Mean Divisia Index (LMDI) model overcomes the issues of “zero” values and residuals in the decomposition process, making it one of the most ideal decomposition methods [29]. The LMDI model is also simple in structure, highly applicable, and easily combined with other models. Referring to the study by Chen et al., this research effectively combines the coupling coordination degree model and the LMDI model. The calculation formula is as follows:
Where 0 represents the starting year (2003), t represents the ending year (2022), and ΔD represents the change in the coupling coordination degree from the start year to the end year. ΔDc and ΔDt represent the contributions of the coupling degree and the comprehensive coordination index to the change in the coupling coordination degree, respectively.
Results and Discussion
Spatiotemporal Changes in China’s Industrial Agglomeration Level
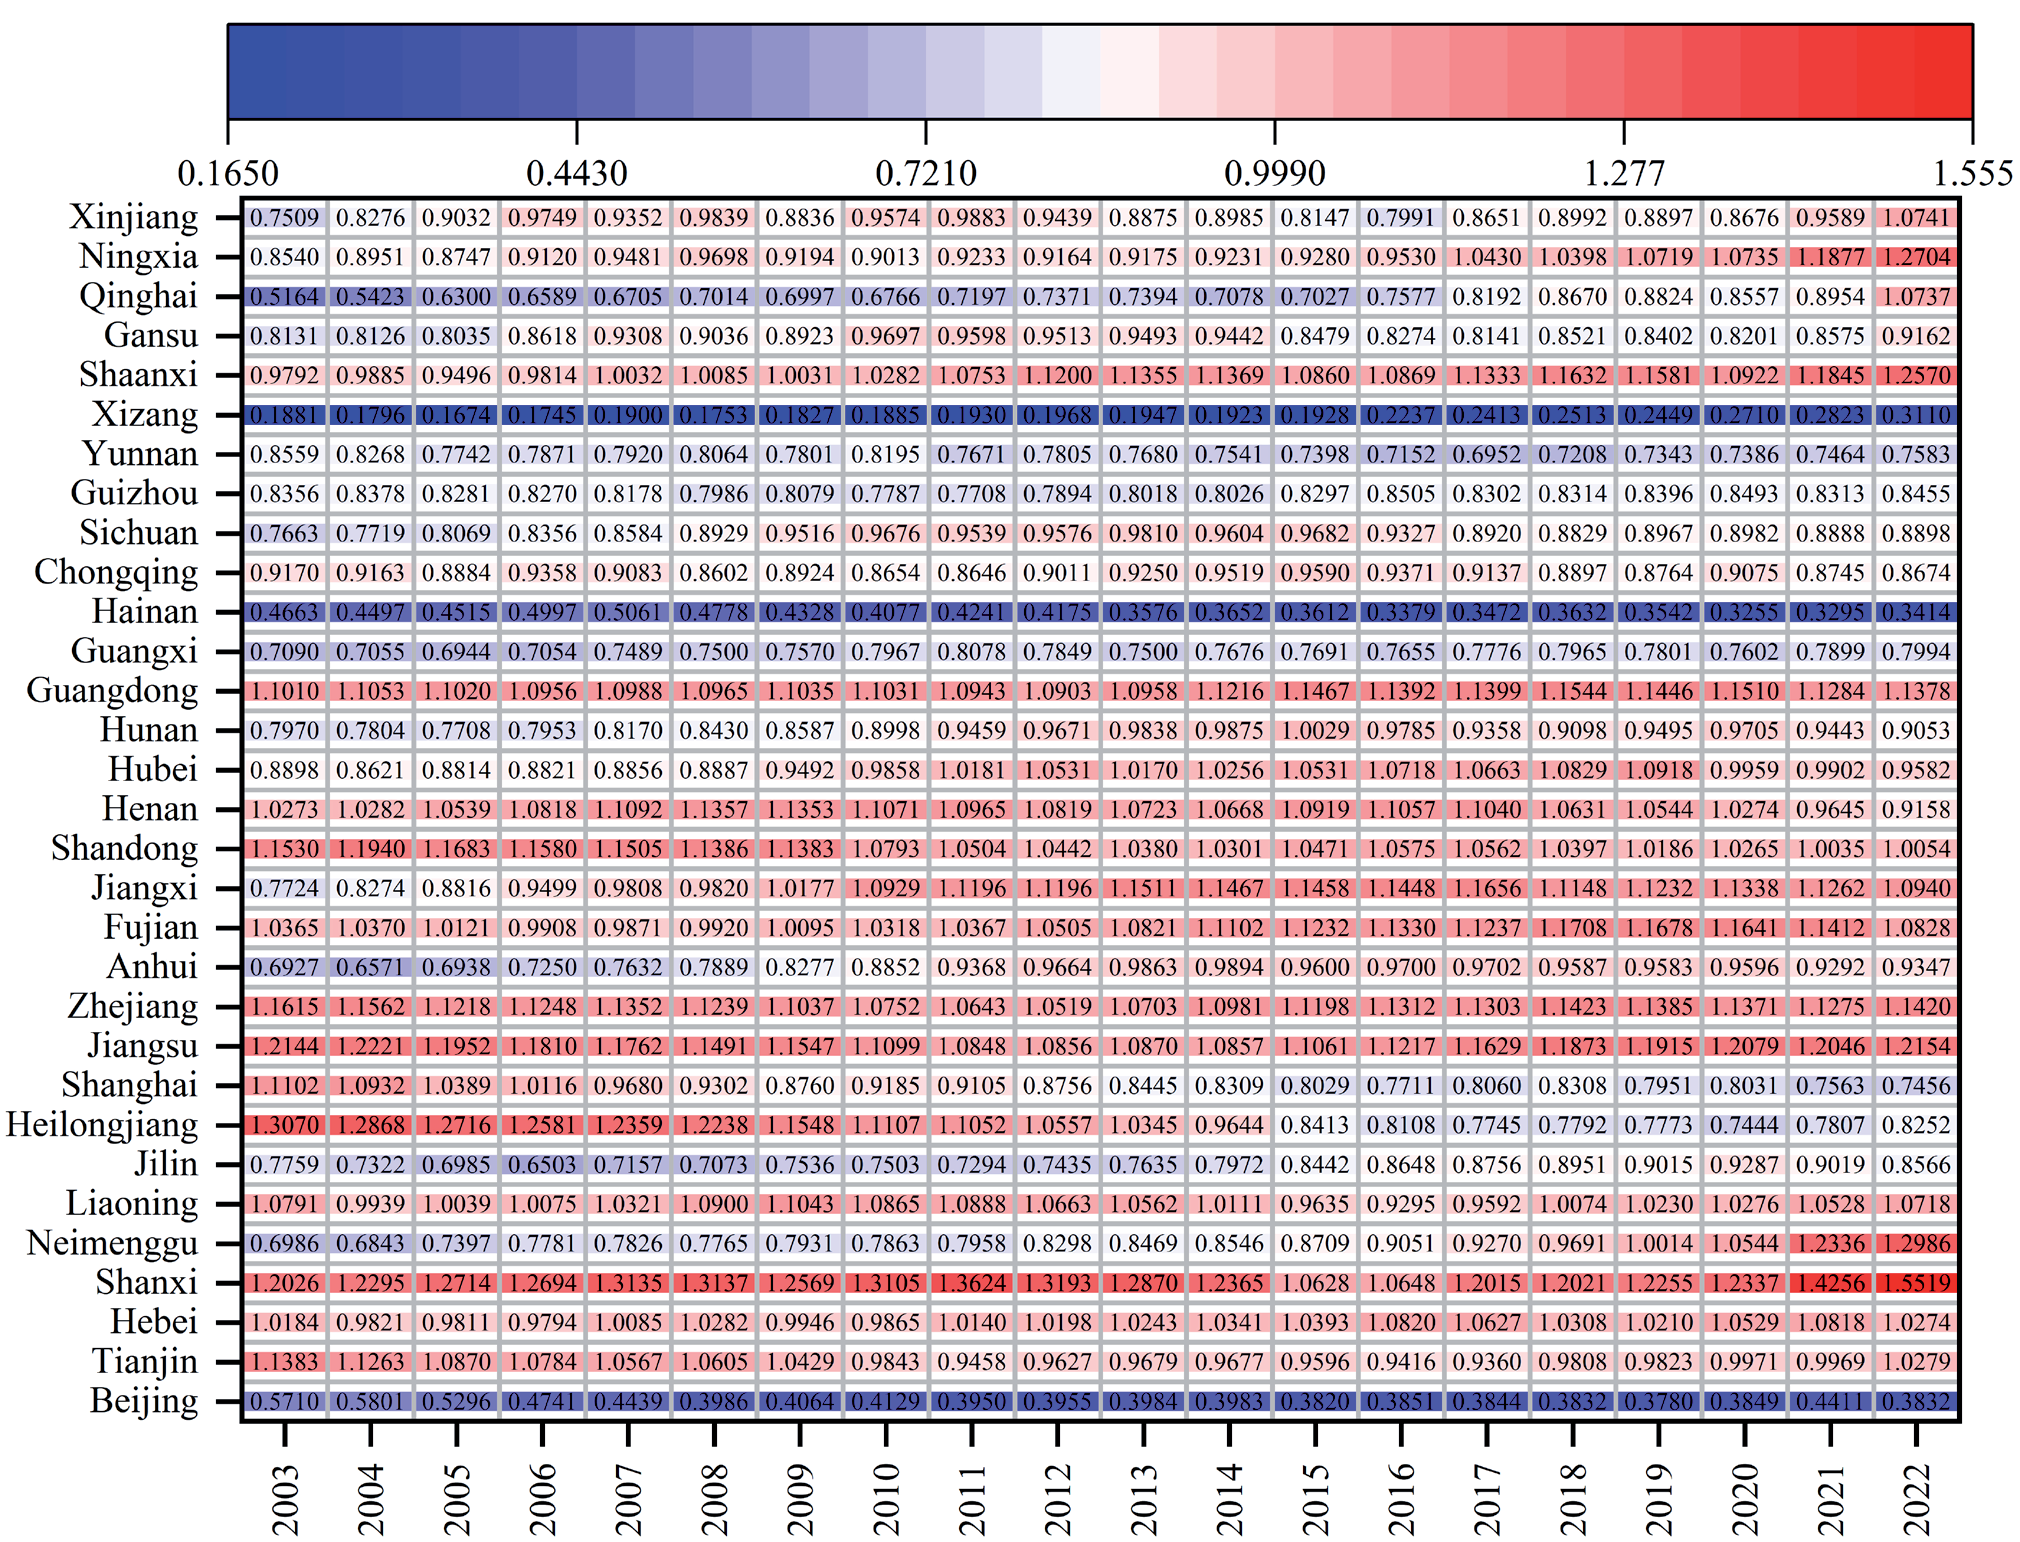
According to Fig. 1, significant differences exist in industrial agglomeration levels across China’s 31 provinces from 2003 to 2022. The Location Quotient (LQ) is used to measure the degree of industrial agglomeration. An LQ greater than 1 indicates a high level of industrial agglomeration in the province, while an LQ less than 1 indicates a low level of industrial agglomeration.
Table 1.
Classification of coupling coordination types among industrial agglomeration level, ecological environment quality, and industrial GDP.
| Coupling coordination type | Coordination degree range |
|---|---|
| High coordination | (0.7, 1) |
| Basic coordination | (0.6, 0.7) |
| Basic inoordination | (0.4, 0.6) |
| Severe inoordination | (0, 0.4) |
Over these 20 years, the industrial agglomeration levels in most provinces have shown some fluctuations but remained generally stable. Provinces such as Jiangsu, Zhejiang, Shandong, and Guangdong have consistently maintained high levels of industrial agglomeration, with LQs mostly above 1 and minimal fluctuations throughout the period. This reflects the significant role these provinces play in the national industrial landscape. As representatives of China’s eastern coastal region, Jiangsu and Zhejiang have attracted numerous industrial enterprises due to their advantageous geographical locations, well-developed infrastructure, and abundant labor resources [30], resulting in high levels of industrial agglomeration. Shandong and Guangdong have further promoted industrial agglomeration through their robust industrial bases and policy support [31, 32].
On the other hand, some provinces, such as Beijing, Tianjin, Liaoning, and Heilongjiang, also exhibited high levels of industrial agglomeration during this period but with greater fluctuations. For example, Beijing’s LQ gradually declined from 0.57 in 2003 to 0.40 in 2011 before rising again. This change may be related to the region’s industrial restructuring and policy orientation. In recent years, Beijing has focused on developing high-end services and technology industries, leading to the gradual relocation of traditional industries and affecting its industrial agglomeration level [33, 34]. Tianjin and Liaoning, with their historically heavy industrial bases and national policy support, have maintained high levels of industrial agglomeration but have experienced fluctuations due to market conditions and industrial restructuring [35, 36].
Additionally, some provinces, such as Guizhou, Yunnan, and Tibet, have consistently had LQ values below 1, indicating relatively low levels of industrial agglomeration. This could be attributed to their geographical locations, resource endowments, and economic development levels. Guizhou and Yunnan, located in the southwestern inland region, face constraints in industrial agglomeration and development due to relatively weak transportation infrastructure. Tibet, with its unique geographical environment and climatic conditions, also faces significant limitations in industrial development, leading to expectedly low levels of industrial agglomeration.
When discussing industrial agglomeration levels, it is essential to consider the impact of policy factors and market conditions. Since the reform and opening-up, the eastern coastal regions have benefited from national policy preferences and the advantages of opening up to attract significant foreign investment and advanced technologies, fostering rapid industrial agglomeration. Meanwhile, the central and western regions have gradually improved their industrial agglomeration levels under policies such as the “Western Development Strategy,” though they still lag behind the eastern regions overall. Environmental policies and industrial restructuring also play crucial roles in influencing industrial agglomeration. Some traditional industrial provinces, under environmental pressures, are gradually undergoing industrial transformation and upgrading, which impacts their industrial agglomeration levels.
Comprehensive Evaluation of Ecological Environment Quality in China
From 2003 to 2022, the comprehensive ecological environment quality scores across the 31 provinces in China showed an overall upward trend, reflecting significant achievements in environmental protection and ecological construction (Fig. 2). Beijing’s ecological environment quality score fluctuated but increased overall during this period, with notable improvements in 2007 and 2008, likely due to government efforts to improve air quality and increase green space. Tianjin also experienced fluctuations in its scores, with an overall upward trend, although air quality challenges remain. Hebei Province’s score rose significantly, demonstrating its success in environmental pollution control. Shanxi Province’s score markedly improved after 2010, likely due to efforts to control coal mining and reduce industrial emissions. Inner Mongolia Autonomous Region saw a significant improvement in its score, indicating progress in increasing forest coverage and reducing grassland degradation. Liaoning Province’s score generally increased, despite fluctuations after 2013, reflecting achievements in industrial pollution control and air quality improvement. The scores for Jilin and Heilongjiang provinces steadily increased, showing significant progress in forest coverage and wetland protection. Shanghai experienced some fluctuations in its scores, but the overall trend was upward, demonstrating effectiveness in promoting green development and reducing pollution emissions. Jiangsu and Zhejiang provinces’ scores steadily rose, indicating significant progress in increasing green space and controlling water pollution. Anhui Province’s score fluctuated but generally increased, reflecting efforts in forest coverage enhancement and industrial pollution control. Fujian, Jiangxi, and Guangdong provinces saw steady increases in scores, showing significant progress in natural resource protection and green development promotion. The scores for Shandong, Henan, Hubei, and Hunan provinces significantly improved, indicating effectiveness in water pollution control, industrial emission reduction, and green space expansion. Guangxi Zhuang Autonomous Region and Hainan Province showed significant improvements in their scores, reflecting progress in forest coverage increase and natural resource protection. Chongqing, Sichuan, Guizhou, and Yunnan provinces’ scores significantly improved, demonstrating significant achievements in water pollution control, air quality improvement, and natural resource protection. Tibet Autonomous Region’s score, although fluctuating, showed an overall upward trend, indicating effectiveness in ecological environment protection and civilization construction. Shaanxi, Gansu, Qinghai, and Ningxia Hui Autonomous Region saw significant improvements in their scores, reflecting progress in reducing industrial emissions, protecting natural resources, and promoting green development. Xinjiang Uygur Autonomous Region’s score significantly improved, demonstrating significant achievements in natural resource protection and ecological civilization construction.
In response to these findings, we have further analyzed the specific reasons behind the significant changes in ecological environment quality in representative provinces such as Hebei, Jiangsu, and Sichuan. Hebei, as a major industrial base in China, has undergone significant industrial restructuring during the observation period. By promoting industrial transformation and upgrading and phasing out outdated production capacities, Hebei has made considerable progress in improving environmental quality. Additionally, strict environmental protection policies and air pollution control measures have contributed to the significant improvement in the province’s ecological environment quality. Jiangsu, on the other hand, exemplifies improvements in resource utilization efficiency. Jiangsu has actively promoted green manufacturing and the adoption of cleaner production technologies, which, through technological innovation and industrial upgrading, have reduced resource consumption and pollutant emissions per unit of output. These efforts have significantly enhanced the province’s ecological environment quality. Sichuan’s environmental improvements are primarily due to the strengthened implementation of environmental protection policies and ecological restoration projects. Large-scale afforestation and soil conservation projects have improved the regional ecological environment and effectively addressed the environmental pressures associated with economic development.
These results reflect the significant achievements in environmental protection and ecological construction across various regions in China. Provinces should continue to strengthen ecological environment protection and promote green development to achieve coordinated development of regional economies and ecological environments.
Decoupling Relationship Analysis
The analysis of the decoupling types between industrial agglomeration and ecological environment quality, as well as between industrial agglomeration and industrial economy, across 31 provinces in China reveals that different provinces exhibit different decoupling types (see Table 2).
In terms of the decoupling type between industrial agglomeration and ecological environment quality, provinces such as Beijing, Tianjin, Liaoning, Heilongjiang, Shanghai, Zhejiang, Shandong, Hainan, Chongqing, Yunnan, and Shaanxi demonstrate strong decoupling. These provinces have significantly improved their ecological environment quality while increasing their industrial agglomeration levels, indicating strong environmental awareness and technical support. Provinces like Inner Mongolia, Anhui, Fujian, Jiangxi, Guangdong, Sichuan, Qinghai, Ningxia, and Xinjiang show weak decoupling, where ecological environment quality has improved but to a lesser extent as industrial agglomeration levels increase. Hebei, Jilin, Jiangsu, Hubei, Hunan, Guangxi, and Gansu exhibit expansive negative decoupling, where ecological environment quality deteriorates as industrial agglomeration levels increase, suggesting a need for enhanced environmental protection measures. Shanxi shows an expansive connection type, with industrial agglomeration levels and ecological environment quality increasing simultaneously, indicating a close relationship between the two.
For the decoupling type between industrial agglomeration and industrial economy, strong decoupling is observed in provinces such as Beijing, Tianjin, Liaoning, Heilongjiang, Shanghai, Zhejiang, Shandong, Henan, Hainan, Chongqing, Yunnan, Tibet, and Shaanxi. These provinces have achieved significant industrial economic growth alongside increasing industrial agglomeration levels, indicating healthy economic development. Provinces like Hebei, Shanxi, Inner Mongolia, Jilin, Jiangsu, Anhui, Fujian, Jiangxi, Hubei, Hunan, Guangdong, Guangxi, Guizhou, Gansu, Qinghai, Ningxia, and Xinjiang show weak decoupling, where the industrial economy has grown but to a lesser extent as industrial agglomeration levels increase. Tibet exhibits an expansive negative decoupling type, where industrial agglomeration levels increase while the industrial economy shows no significant growth or decline, warranting further analysis of the underlying reasons.
Overall, most provinces in China exhibit varying degrees of decoupling between industrial agglomeration and ecological environment quality, with strong and weak decoupling types being more common. This indicates that while industrial agglomeration levels are increasing, some provinces have started to emphasize environmental protection and have achieved certain successes. However, some provinces have experienced environmental quality deterioration during industrial agglomeration, necessitating further environmental protection measures and technological investments. In terms of the relationship between industrial agglomeration and industrial economy, strong and weak decoupling types dominate, indicating that as industrial agglomeration levels rise, the industrial economy continues to grow, demonstrating an overall healthy development trend in China’s industrial economy. To further achieve a positive interaction between industrial agglomeration and ecological environment quality, provinces should develop scientifically sound environmental protection policies based on their specific conditions, promoting the sustainable development of the industrial economy.
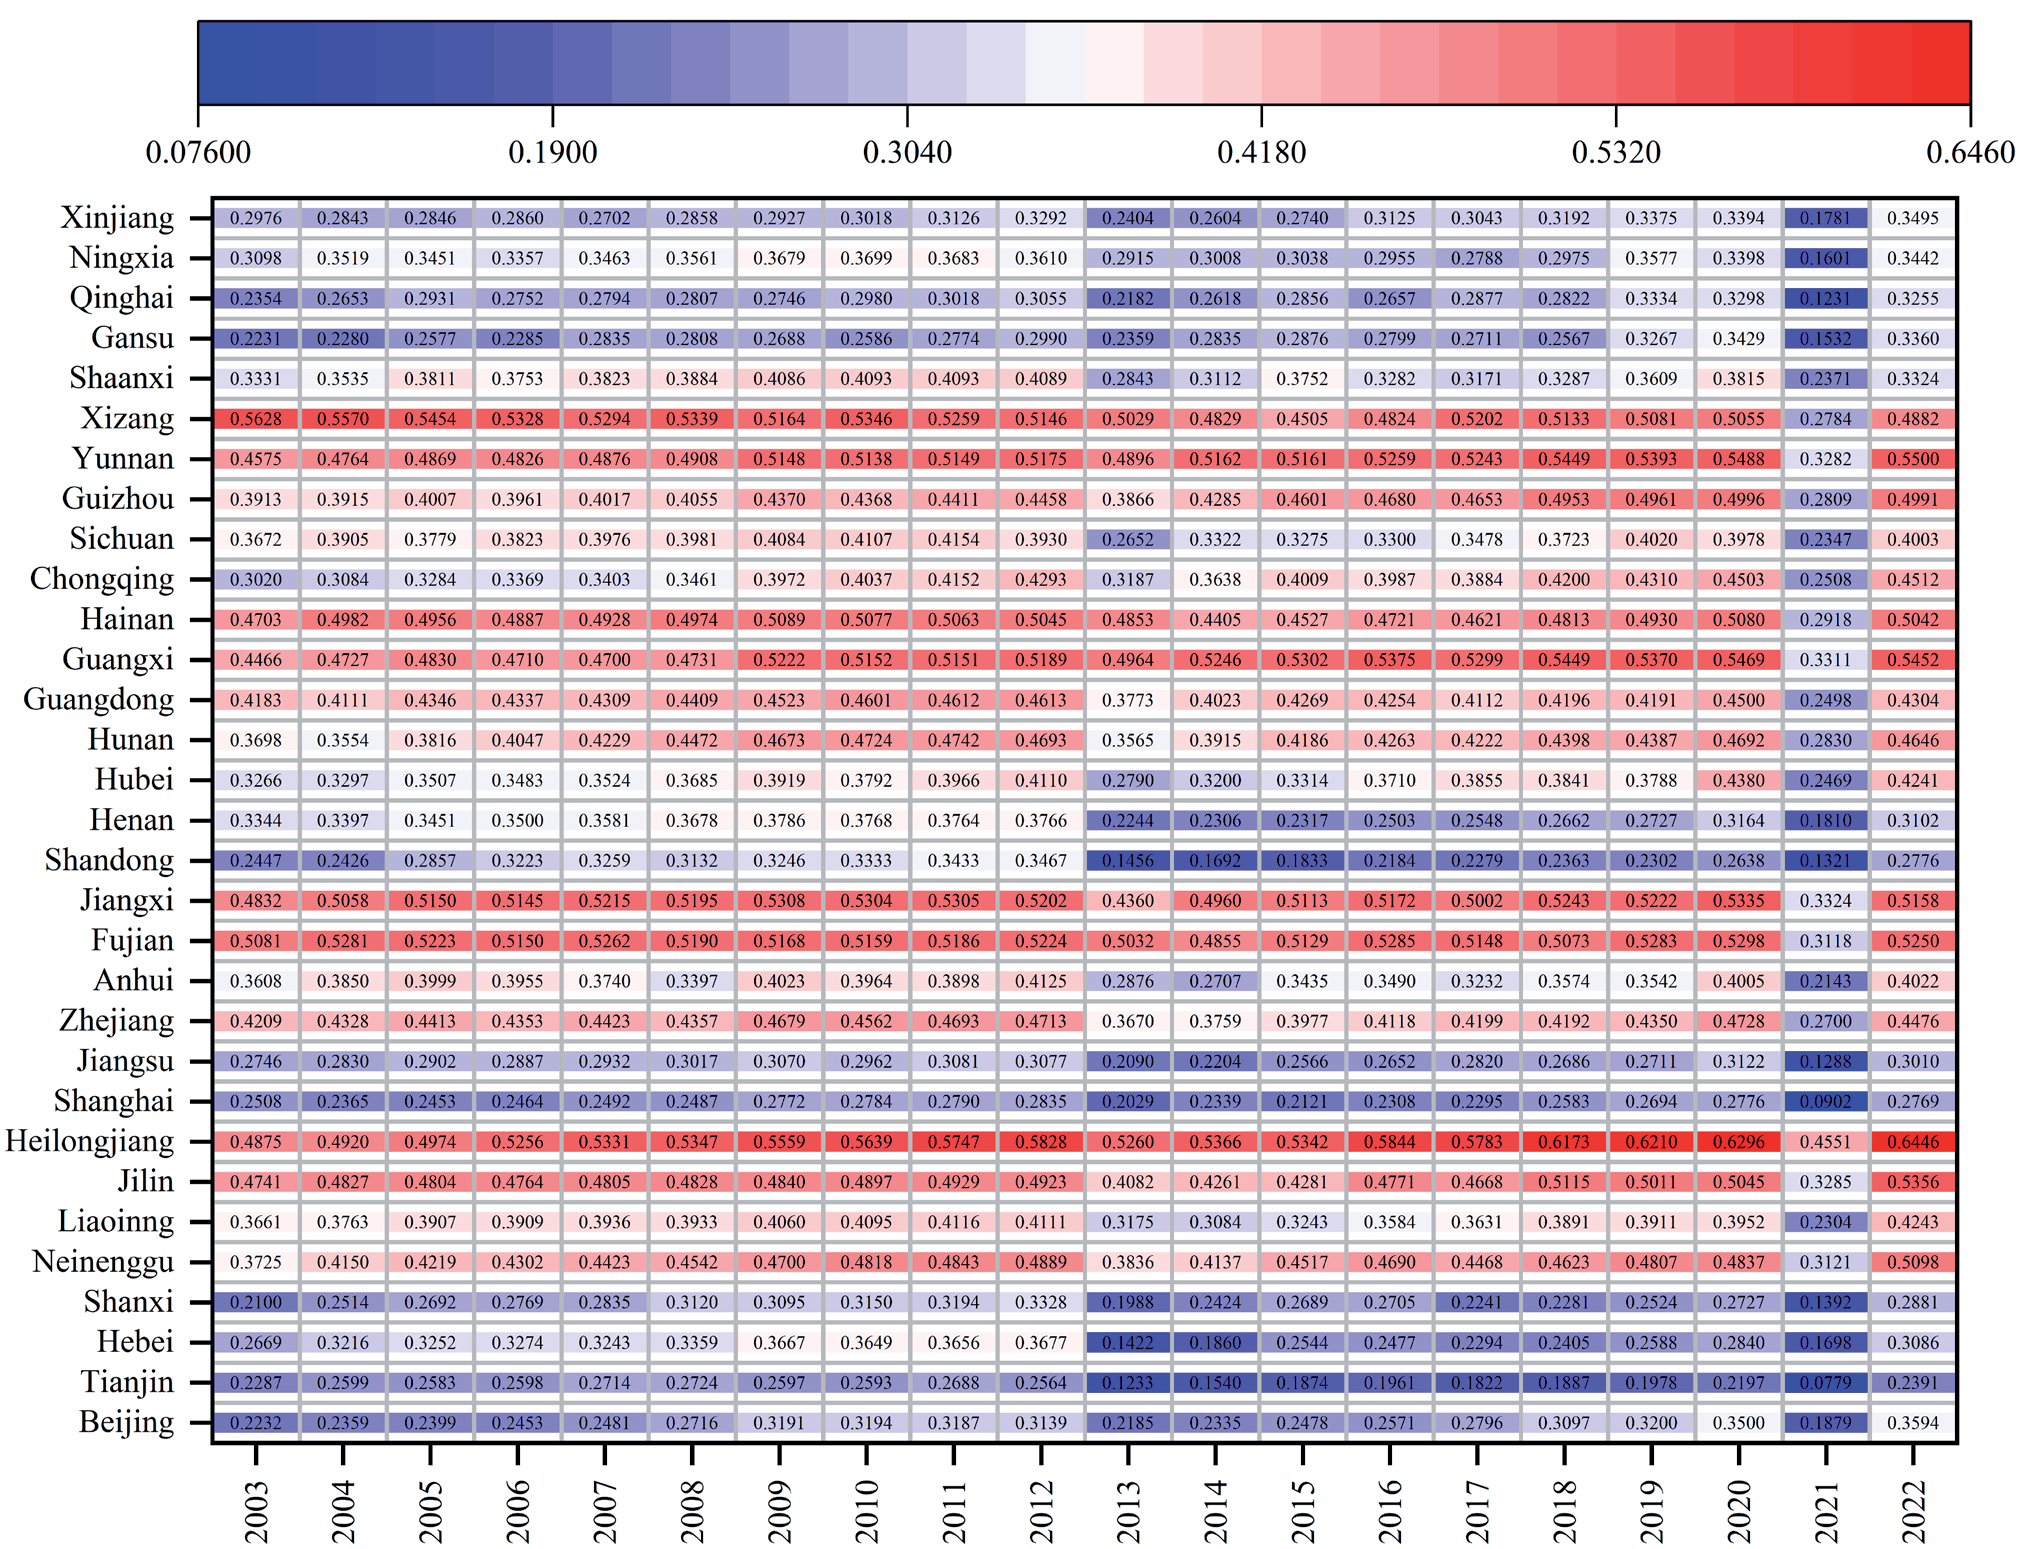
Table 2.
Decoupling relationship analysis between industrial agglomeration levels, ecological environment quality, and industrial economy in 31 provinces of China from 2003 to 2022.
Degree of Coupling Coordination
From 2003 to 2022, the coupling coordination relationship among industrial agglomeration, ecological environment quality, and industrial economic development in China’s 31 provinces showed diverse trends (Fig. 3). In Beijing, the coordination degree generally increased, especially after 2010, likely due to efforts to strengthen environmental governance and optimize industrial structure. Tianjin’s coordination degree gradually increased during this period, indicating a balance between industrial agglomeration and ecological environmental protection. Hebei Province’s coordination degree significantly rose, reflecting its effectiveness in controlling industrial pollution and improving environmental quality. In Shanxi Province, the coordination degree notably improved after 2010, possibly due to measures to reduce coal mining and increase environmental investment. Inner Mongolia Autonomous Region saw a steady rise in coordination degree, showing progress in increasing grassland coverage and reducing pollution emissions.
Liaoning Province’s coordination degree generally increased but fluctuated after 2012, likely related to the progress in industrial restructuring and environmental protection measures. Jilin and Heilongjiang provinces’ coordination degrees improved annually, indicating significant achievements in protecting forest resources and reducing industrial pollution. Shanghai’s coordination degree fluctuated but showed an overall positive trend, demonstrating its effectiveness in promoting the green economy and reducing pollution. Jiangsu and Zhejiang provinces’ coordination degrees continuously increased, reflecting significant progress in enhancing industrial efficiency and improving the ecological environment. Anhui Province’s coordination degree fluctuated but generally increased, indicating efforts in industrial agglomeration and environmental management.
Fig. 3.
Coupling coordination relationship among industrial agglomeration, ecological environment quality, and industrial economic development in 31 provinces of China from 2003 to 2022.
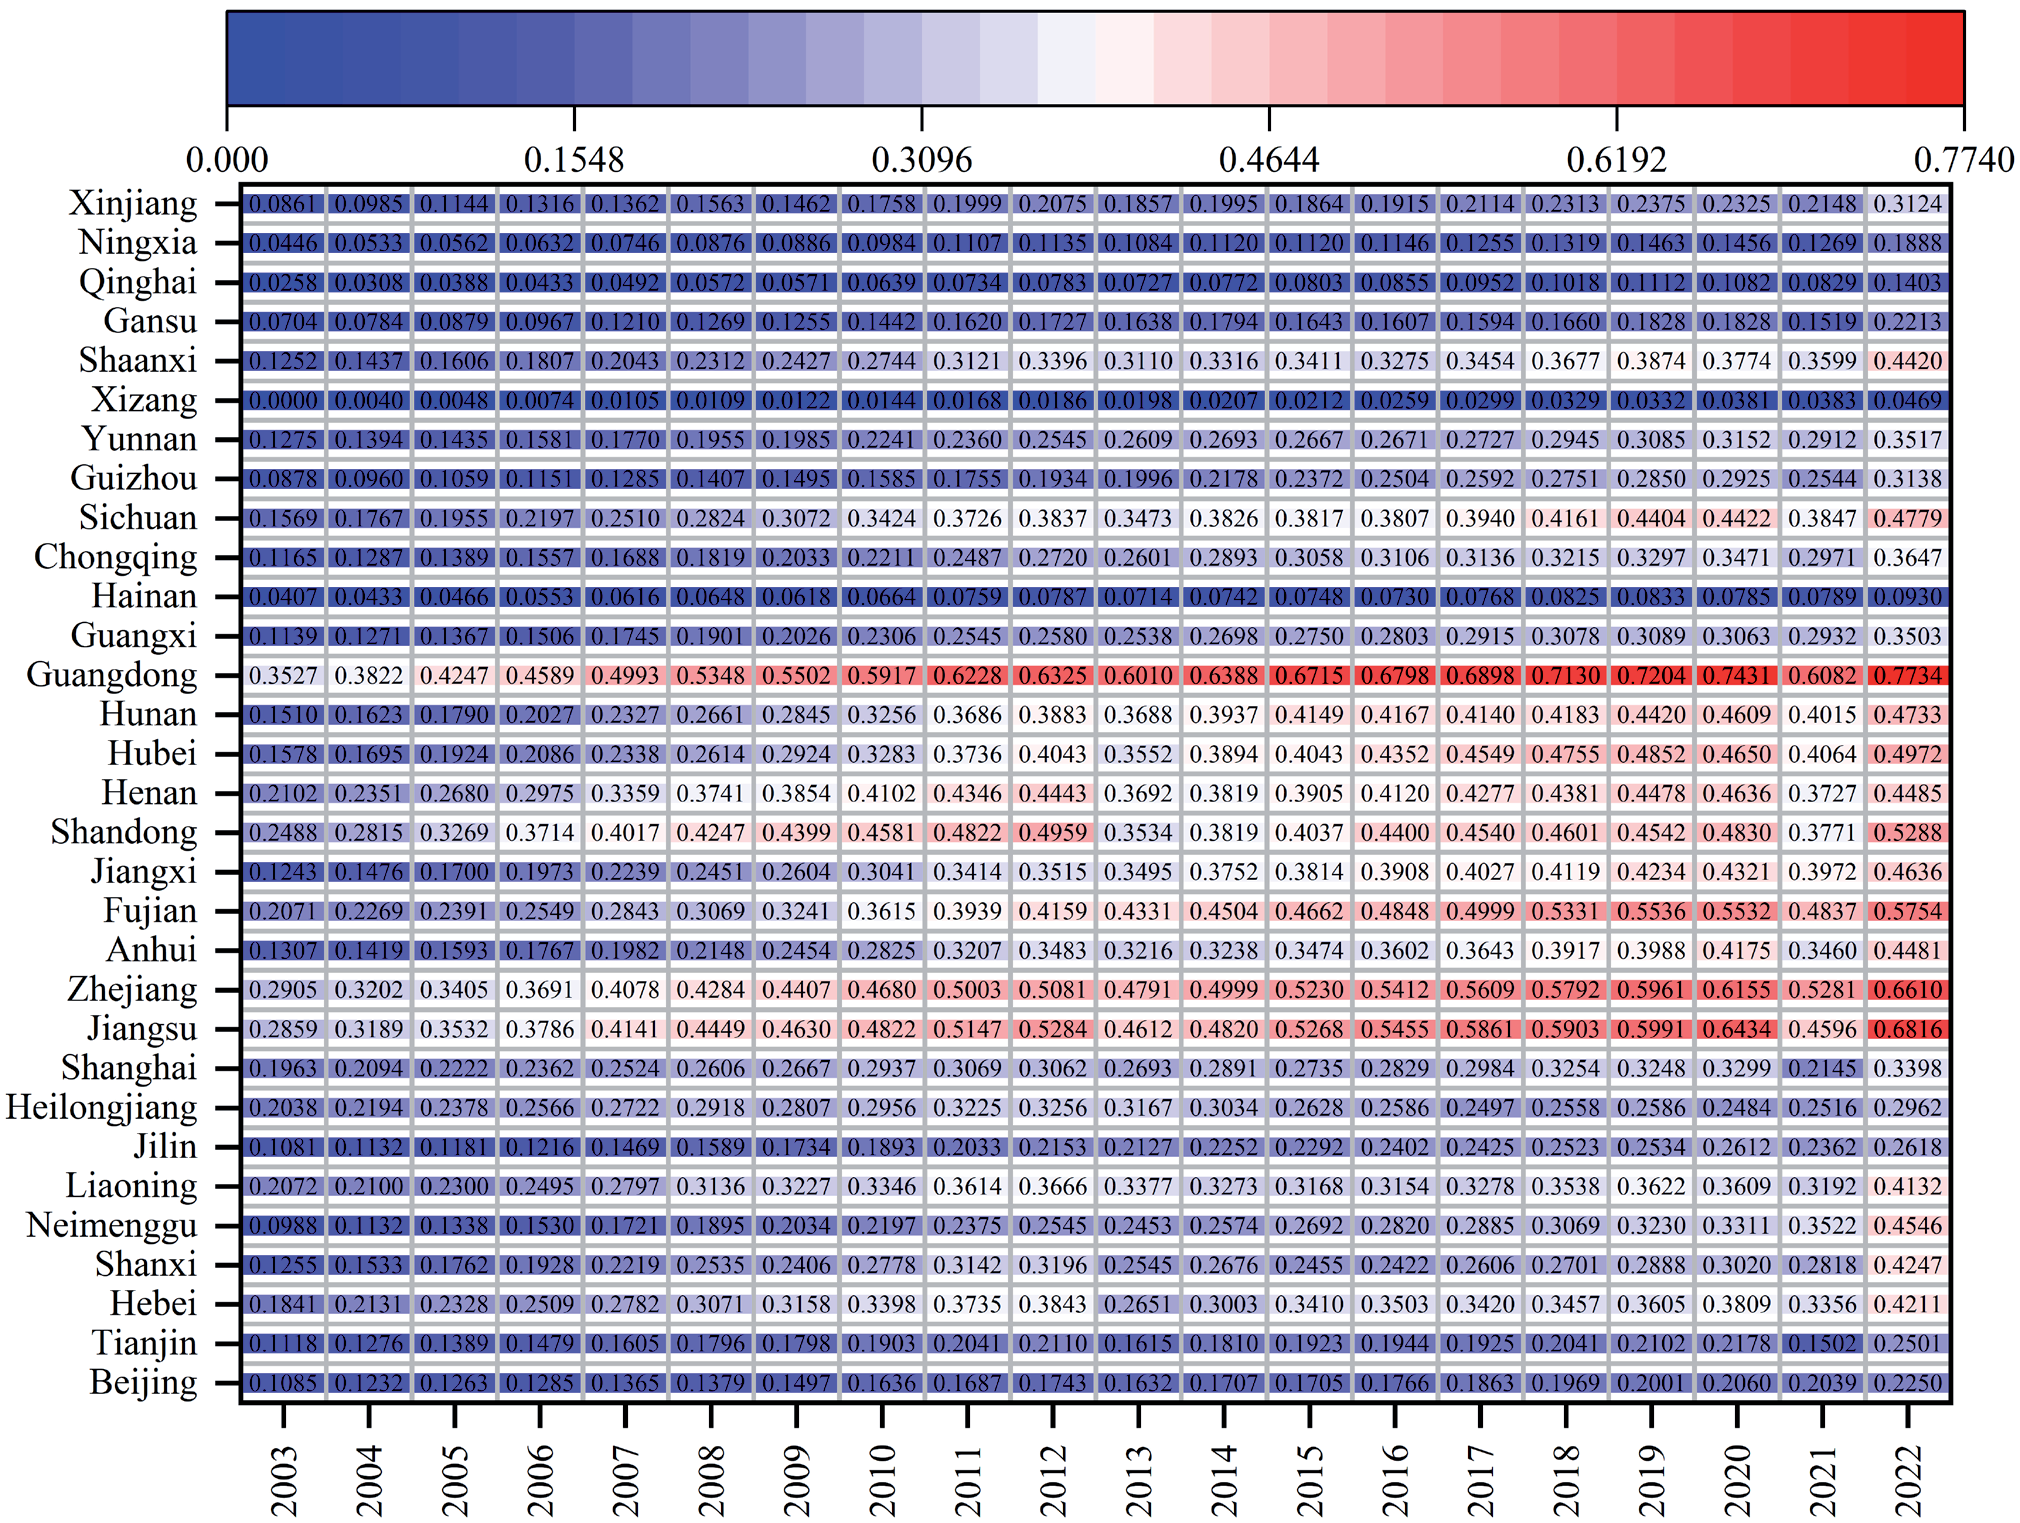
The coordination degrees of Fujian, Jiangxi, and Guangdong provinces significantly improved, reflecting notable progress in protecting natural resources and promoting sustainable development. The coordination degrees of Shandong, Henan, Hubei, and Hunan provinces significantly rose, showing the effectiveness of comprehensive measures in controlling industrial pollution, increasing green space, and promoting green development. Guangxi Zhuang Autonomous Region and Hainan Province saw significant improvement in coordination degrees, indicating progress in increasing forest coverage and protecting the ecological environment. The coordination degrees of Chongqing, Sichuan, Guizhou, and Yunnan provinces significantly improved, demonstrating significant achievements in water pollution control, air quality improvement, and natural resource protection.
Tibet Autonomous Region’s coordination degree, although starting from a low point, showed an overall upward trend, indicating progress in ecological environment protection and ecological civilization construction. Shaanxi, Gansu, Qinghai, and Ningxia Hui Autonomous Region saw significant improvements in their coordination degrees, reflecting progress in reducing industrial emissions, protecting natural resources, and promoting green development. Xinjiang Uygur Autonomous Region’s coordination degree significantly improved, demonstrating significant achievements in natural resource protection and ecological civilization construction.
These results reflect China’s efforts and achievements in promoting the coordinated development of industrial agglomeration and ecological environment protection across various regions. Provinces should continue to strengthen the rational planning of industrial agglomeration and environmental protection to promote the coordinated and sustainable development of the regional economy and ecological environment.
LMDI Factor Decomposition
According to the LMDI decomposition results, significant regional differences are evident in the coupling coordination relationship among industrial agglomeration, ecological environment quality, and industrial economic development across China’s 31 provinces (see Fig. 4). In Beijing, the contribution of the coupling degree was 0.11, and the comprehensive index contribution was 0.00, mainly relying on the coupling degree. Tianjin’s coupling degree contribution was 0.14, while the comprehensive index contribution was -0.00, indicating a slight negative impact from the comprehensive index. Hebei’s coupling degree contribution was 0.18, and the comprehensive index contribution was 0.06, with the coupling degree having a larger contribution. Shanxi’s coupling degree contribution was 0.21, and the comprehensive index contribution was 0.09, showing a significant contribution from the coupling degree. Inner Mongolia had a coupling degree contribution of 0.21 and a comprehensive index contribution of 0.15, with both playing important roles. Liaoning’s coupling degree contribution was 0.17, and the comprehensive index contribution was 0.04, with a greater contribution from the coupling degree. Jilin’s coupling degree contribution was 0.13, and the comprehensive index contribution was 0.03, indicating a larger contribution from the coupling degree. Heilongjiang’s coupling degree contribution was 0.14, and the comprehensive index contribution was -0.05, with the comprehensive index having a negative impact. Shanghai’s coupling degree contribution was 0.18, and the comprehensive index contribution was -0.04, showing a significant contribution from the coupling degree. Jiangsu’s coupling degree contribution was 0.19, and the comprehensive index contribution was 0.21, with both contributions being similar. Zhejiang’s coupling degree contribution was 0.25, and the comprehensive index contribution was 0.12, with the coupling degree having a larger contribution. Anhui’s coupling degree contribution was 0.21, and the comprehensive index contribution was 0.11, indicating a significant contribution from the coupling degree. Fujian’s coupling degree contribution was 0.28, and the comprehensive index contribution was 0.08, with the coupling degree having a larger contribution. Jiangxi’s coupling degree contribution was 0.24, and the comprehensive index contribution was 0.10, indicating a significant contribution from the coupling degree. Shandong’s coupling degree contribution was 0.20, and the comprehensive index contribution was 0.08, with both making positive contributions. Henan’s coupling degree contribution was 0.20, and the comprehensive index contribution was 0.04, with the coupling degree having a larger contribution. Hubei’s coupling degree contribution was 0.24, and the comprehensive index contribution was 0.10, indicating a significant contribution from the coupling degree. Hunan’s coupling degree contribution was 0.23, and the comprehensive index contribution was 0.09, with both making positive contributions. Guangdong’s coupling degree contribution was 0.18, and the comprehensive index contribution was 0.24, with the comprehensive index having a larger contribution. Guangxi’s coupling degree contribution was 0.19, and the comprehensive index contribution was 0.05, with the coupling degree having a larger contribution. Hainan’s coupling degree contribution was 0.06, and the comprehensive index contribution was -0.01, with the comprehensive index having a negative impact. Chongqing’s coupling degree contribution was 0.21, and the comprehensive index contribution was 0.04, with the coupling degree having a larger contribution. Sichuan’s coupling degree contribution was 0.22, and the comprehensive index contribution was 0.10, indicating a significant contribution from the coupling degree. Guizhou’s coupling degree contribution was 0.20, and the comprehensive index contribution was 0.03, with the coupling degree having a larger contribution. Yunnan’s coupling degree contribution was 0.21, and the comprehensive index contribution was 0.02, indicating a significant contribution from the coupling degree. Shaanxi’s coupling degree contribution was 0.23, and the comprehensive index contribution was 0.09, with the coupling degree having a larger contribution. Gansu’s coupling degree contribution was 0.12, and the comprehensive index contribution was 0.03, indicating a significant contribution from the coupling degree. Qinghai’s coupling degree contribution was 0.07, and the comprehensive index contribution was 0.04, with the comprehensive index having a larger contribution. Ningxia’s coupling degree contribution was 0.11, and the comprehensive index contribution was 0.04, indicating a significant contribution from the coupling degree. Xinjiang’s coupling degree contribution was 0.16, and the comprehensive index contribution was 0.07, with both making positive contributions.
Fig. 4.
Decomposition of the coupling relationship among industrial agglomeration, ecological environment quality, and industrial economic development in 31 provinces of China based on the LMDI model.
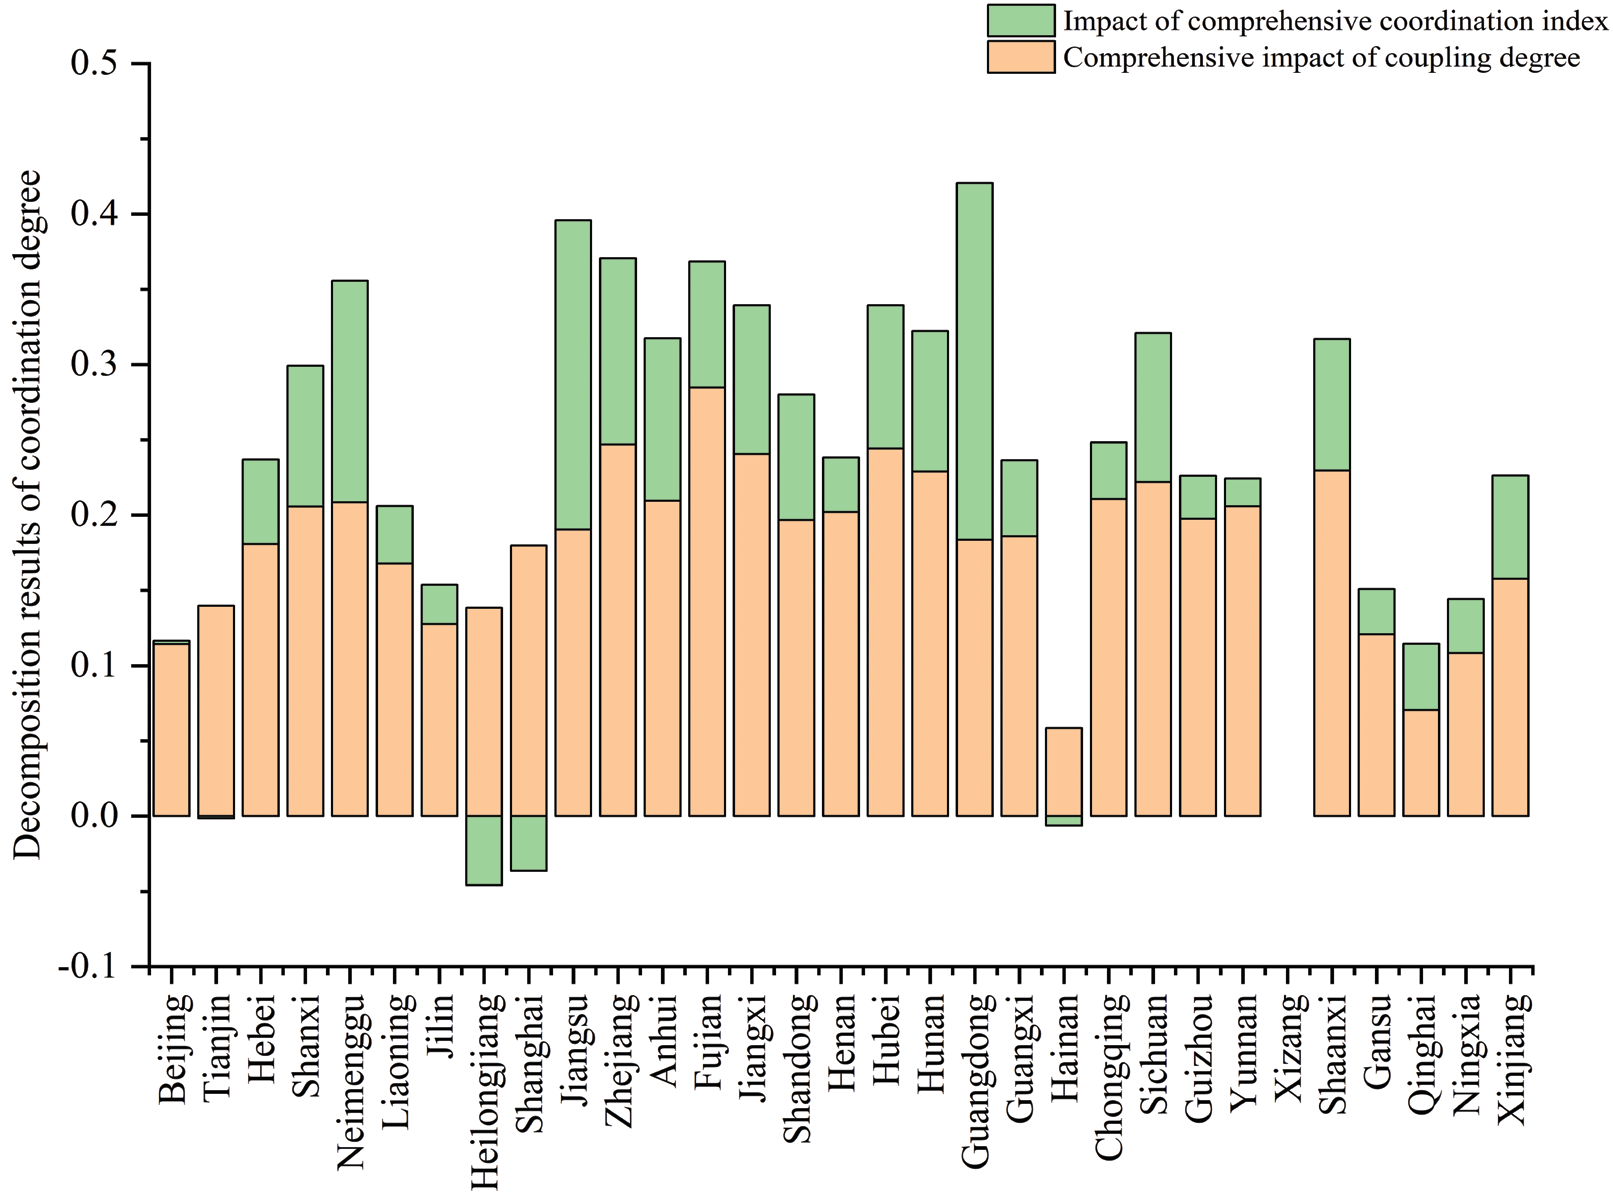
In summary, the coupling coordination relationships among industrial agglomeration, ecological environment quality, and industrial economic development exhibit significant regional differences across China’s provinces. In most provinces, the contribution of the coupling degree is higher, while the comprehensive index contribution is relatively smaller. However, the impact of the comprehensive index on the coupling coordination relationship cannot be overlooked in some provinces.
Conclusions
The coupling coordination analysis of industrial agglomeration levels, ecological environment quality, and industrial economic development among 31 provinces in China from 2003 to 2022 reveals significant regional differences and varying degrees of integration between these factors. The LMDI decomposition results highlight the contributions of the coupling degree and the comprehensive index, illustrating the balance between these factors in different regions. In regions like Beijing and Tianjin, the contribution of the comprehensive index is relatively low, indicating that their development strategies focus more on the integration of industry and environment rather than overall improvement. In contrast, Hebei and Shanxi exhibit high contributions from both the coupling degree and the comprehensive index, reflecting a more balanced development approach. Inner Mongolia and Liaoning demonstrate regional differences; Inner Mongolia has achieved a significant balance between industrial agglomeration and ecological environment quality, while Liaoning places more emphasis on coupling coordination.
Policy Recommendations
Promoting Balanced Development
For regions with lower comprehensive index contributions, such as Beijing and Tianjin, more targeted green development policies should be formulated and implemented. For example, tax incentives and subsidies can encourage enterprises to adopt clean production technologies, reduce pollution emissions, and improve resource utilization efficiency [37, 38]. While promoting economic development, it is essential to strictly control industrial emissions [39] and implement more stringent environmental standards and regulatory mechanisms to ensure that environmental quality does not deteriorate due to industrial agglomeration [40].
Enhancing Regional Integration
Encourage cooperation and exchange between regions to share best practices and success stories. For instance, Hebei and Shanxi can share their experiences in balancing industrial agglomeration and ecological environment protection with other provinces through inter-regional cooperation projects to enhance overall regional sustainable development [41, 42]. At the national level, promote the alignment and coordination of planning and policies among provinces and cities to form a unified green development framework, avoiding policy conflicts and resource waste between regions [43].
Increasing Support for Underdeveloped Areas
Provinces with lower comprehensive index contributions, such as Heilongjiang and Shanghai, should receive more financial support and technical assistance to improve the coordination of industrial agglomeration and ecological environment quality. For example, establish special funds to support green projects and provide technical training and consulting services [44, 45]. Attract and guide green investments into these regions to support the development of environmentally friendly, energy-saving, and efficient industries, promoting a win-win situation for economic growth and environmental protection.
Encouraging Innovation and Green Technology
Increase investment in green technology research and development, establish special funds to support related research projects [46], and encourage cooperation among universities, research institutions, and enterprises to promote the industrial application of green technologies [47]. Set up green technology demonstration zones in various provinces and cities to promote and apply advanced environmental technologies and processes, driving green development across the region.
Focusing on Long-term Sustainability
Provinces and cities should formulate and implement long-term environmental protection goals and action plans to ensure gradual improvement of ecological environment quality while achieving economic growth. Encourage the development of a circular economy, promote resource recycling, reduce waste emissions, and establish resource-saving and environmentally friendly production and consumption patterns [48].
Customizing Regional Policies
Develop customized green development policies based on each province and city’s specific conditions and needs [49]. For example, Inner Mongolia and Liaoning can further enhance their integration efforts by establishing green industrial parks and promoting industrial transformation and upgrading. For provinces with lower comprehensive index and coupling degree contributions, such as Guizhou and Qinghai, implement targeted support policies to help improve environmental awareness and technological levels, gradually achieving coordinated economic and environmental development.
Strengthening Public Participation and Supervision
Through publicity and education, raise public awareness of environmental protection [49], encourage public participation in environmental protection and supervision, and create a green development atmosphere with the involvement of the whole society [50]. Set up mechanisms for public participation to gather opinions and suggestions from the public, ensuring the scientific and operable nature of environmental protection policies and enhancing the effectiveness and social acceptance of policy implementation.
By implementing these policy recommendations, China can better promote the coordinated development of industrial agglomeration, ecological environment quality, and industrial economic development across its provinces. This will drive balanced and sustainable regional development, achieving the dual goals of economic growth and environmental protection.
Limitations
This study acknowledges several limitations that should be considered when interpreting the results. Firstly, the issue of data granularity is significant. The study primarily relies on provincial-level statistical data, which may not capture more detailed information available at the city level or within specific sectors. These finer details could reveal localized industrial dynamics and environmental impacts that are not fully reflected in this analysis. Additionally, the absence of qualitative data, such as interviews with local stakeholders, case studies, or field observations, limits the study. Such qualitative insights could provide valuable context and help to better interpret the quantitative findings by uncovering underlying factors that influence industrial agglomeration and ecological quality, such as local policy implementations, cultural factors, or stakeholder perspectives.
Furthermore, the quantitative models used, such as the entropy weight method, focus predominantly on measurable variables and may not fully account for qualitative factors like social, political, or cultural influences, which are crucial for understanding the full scope of the coupling coordination relationship between industrial agglomeration and environmental quality. The study also does not fully integrate the potential impact of external variables, such as global economic shifts, technological advancements, or environmental events (e.g., natural disasters), which could significantly influence the relationship between industrial agglomeration and ecological environment quality, leading to an incomplete understanding of the dynamics at play.
Moreover, we recognize that the degree of autonomy and governance structures at the provincial level can significantly impact policy implementation. Provinces with stronger governance frameworks and more decentralized decision-making processes may be better positioned to adapt and implement innovative environmental policies compared to those with more centralized or rigid governance structures. Additionally, the implementation of policies often encounters resistance due to socio-political factors such as vested interests, local power dynamics, and public opposition. To address these challenges, we suggest policymakers engage in more inclusive stakeholder consultations and adopt participatory approaches to policy design, ensuring that the concerns and interests of local communities, businesses, and other key stakeholders are addressed.
Given the diversity of socio-political contexts across different provinces, it is also recommended that policy implementation strategies be tailored to the specific socio-political environment of each region. For instance, in areas with strong local leadership or active community engagement, policies might be more effectively implemented through collaborative initiatives involving local governments, businesses, and civil society organizations. Additionally, drawing on successful case studies from provinces with similar socio-political contexts can provide valuable insights and strategies for overcoming potential barriers in policy implementation. By discussing these limitations and considerations, we aim to provide a more balanced reflection on the study’s outcomes and offer more nuanced, context-sensitive policy recommendations that are better aligned with the socio-political realities at the provincial level. Future research should consider adopting a mixed-methods approach that combines quantitative analysis with qualitative data collection, offering a more comprehensive understanding of the complex interactions between industrial agglomeration and environmental quality while also considering the socio-political factors influencing policy implementation.

