

Introduction
Cultivated land is the basis for the survival and development of human society, and ensuring sufficient quantity and considerable quality of cultivated land is an essential guarantee for national stability and socio-economic development [1]. With the rapid development of industrialization and urbanization, the massive loss of rural population often leads to the marginalization of cultivated land in mountainous rural areas, which in turn leads to the occurrence of large-scale abandonment of marginalized land, and abandonment of cultivated land is an extreme manifestation of land marginalization [2, 3]. Significant cultivated land abandonment occurs in mountainous regions around the globe [4]. For example, cultivated land abandonment has been one of the primary land cover and land use changes in Europe since the 19th century [5, 6]; in Russia, northern and western Ukraine, Romania, and the northern Caucasus, large areas of cultivated land have been abandoned [7], not only in Europe but also globally, with varying degrees of cultivated land abandonment, which occurs mainly in mountainous regions [8].
In China, the development of urbanization has led to changes in farmers’ livelihoods, the transfer of a large number of rural laborers to non-agricultural industries, the massive reduction of agricultural laborers in rural areas, and the severe marginalization of land in mountainous regions, which has resulted in the large-scale abandonment of cultivated land [9]. Previous studies have shown that the extent of cultivated land abandonment in China is growing, and the range of ACL continues to expand, with China’s cultivated land abandonment rate of 5.72% in 2013 [10, 11] and reaching 20% in 2019 [12]. The spatial distribution of cultivated land abandonment is higher in central and western China than in eastern China, while cultivated land abandonment is higher in southern China than in northern China [13], and the KMA in southwestern China is the region where the phenomenon of cultivated land abandonment is more serious, with cultivated land abandonment becoming more and more widespread in areas such as Chongqing and Guizhou [14]. With severe rocky desertification, fragile ecological environment, and rugged terrain limiting agricultural mechanization inputs in mountainous areas of Southwest China, as well as significant population migration and aging [15], poor quality cultivated land represented by SCL is currently being continually marginalized and ultimately leading to abandonment. Clarifying the evolution trend of SCL abandonment in sensitive KMA and its influencing factors is of great realistic significance for exploring sustainable agricultural paths in mountainous regions around the globe.
Natural vegetation succession following the abandonment of cultivated land can change the rural land-use structure, agricultural landscape, and farmers’ livelihoods in mountainous areas, with significant ecological, environmental, and socio-economic effects [4]. Especially in the ecologically fragile KMA, the ecological and environmental benefits generated by SCL abandonment can effectively inhibit the expansion of rocky desertification and reverse the trend of declining forest area, causing SCL abandonment to receive increasing attention from scholars. Currently, scholars in both China and other countries have focused on the driving force and mechanism of cultivated land abandonment [16], spatial distribution characteristics of the ACL [10, 17], socio-economic and environmental benefits of the ACL [18], and policies to cope with the abandonment of cultivated land [4]. The current research mainly focuses on developed countries, especially in European countries where the study of cultivated land abandonment is significant. Additionally, in recent years, Chinese scholars have gradually begun to pay attention to the study of cultivated land abandonment. Currently, many Chinese scholars’ research on cultivated land abandonment mainly focuses on assessing the degree of cultivated land abandonment by using the results of sample surveys of farm households [19], and although sample surveys of farm households have a certain degree of accuracy, they lack the spatial details of the cultivated land abandonment and are unable to formulate the corresponding cultivated land abandonment policies and measures for different regions effectively. Remote sensing techniques have been widely used in long-term cultivated land abandonment studies; for example, they are prevalent in European and Mediterranean cultivated land abandonment studies [20, 21]. However, the resolution of the available remote sensing data is relatively coarse (250m-1000m) [22]. Cultivated land in China is highly fragmented, spatially dispersed, and with complex patch shapes, which can lead to significant errors in the assessment of cultivated land area in the application of these remote sensing images, especially in the mountainous regions of China with complex topography, which can cause unacceptably high errors in the results of the study. High-resolution satellite images and imagery are generally more accurate for land use identification and more suitable for small-scale studies [23]. Furthermore, research on the abandonment of SCL at the research scale has focused on the national, provincial, and county levels. There is still a lack of high-resolution remote sensing images to interpret the ACL accurately and then spatially study the details of SCL abandonment, especially the lack of micro-spatial scales (small scales such as townships and villages) to accurately interpret the SCL and study the spatial distribution pattern of SCL abandonment in the KMA. Therefore, it is necessary to accurately identify the abandoned cultivated land in KMA and explore the evolution of the SCL abandonment in mountainous areas, its driving mechanism, and the effect of abandonment of SCL.
We are trying to fill existing research gaps and meet the demand for sustainable cultivated land management in underdeveloped countries’ mountainous areas. This paper carries out a study with HC in Guizhou Province, a typical KMA, as the study area to investigate the evolution of ACL. We visually interpreted high-resolution remote sensing imagery and combined it with field verification and farmers’ survey results to accurately interpret ACL in the HC. In the KMA of southwest China, the HC is part of a severe rocky desertification area. It represents the typical karst landforms and rocky desertification landscapes, and the phenomenon of abandoning its SCL is universal and representative of the KMA as a whole. Therefore, this paper takes HC, a typical rocky desertification area, as the study area and points to the surface to comprehensively reveal and summarize the evolutionary pattern of ACL in the KMAs of Southwest China, the driving mechanisms, and the ecological and environmental benefits they have generated, intending to provide references for the sustainable use of land resources and ecological and environmental restoration of the mountainous areas of China and similar countries around the globe.
Materials and Methods
Study Area Summary
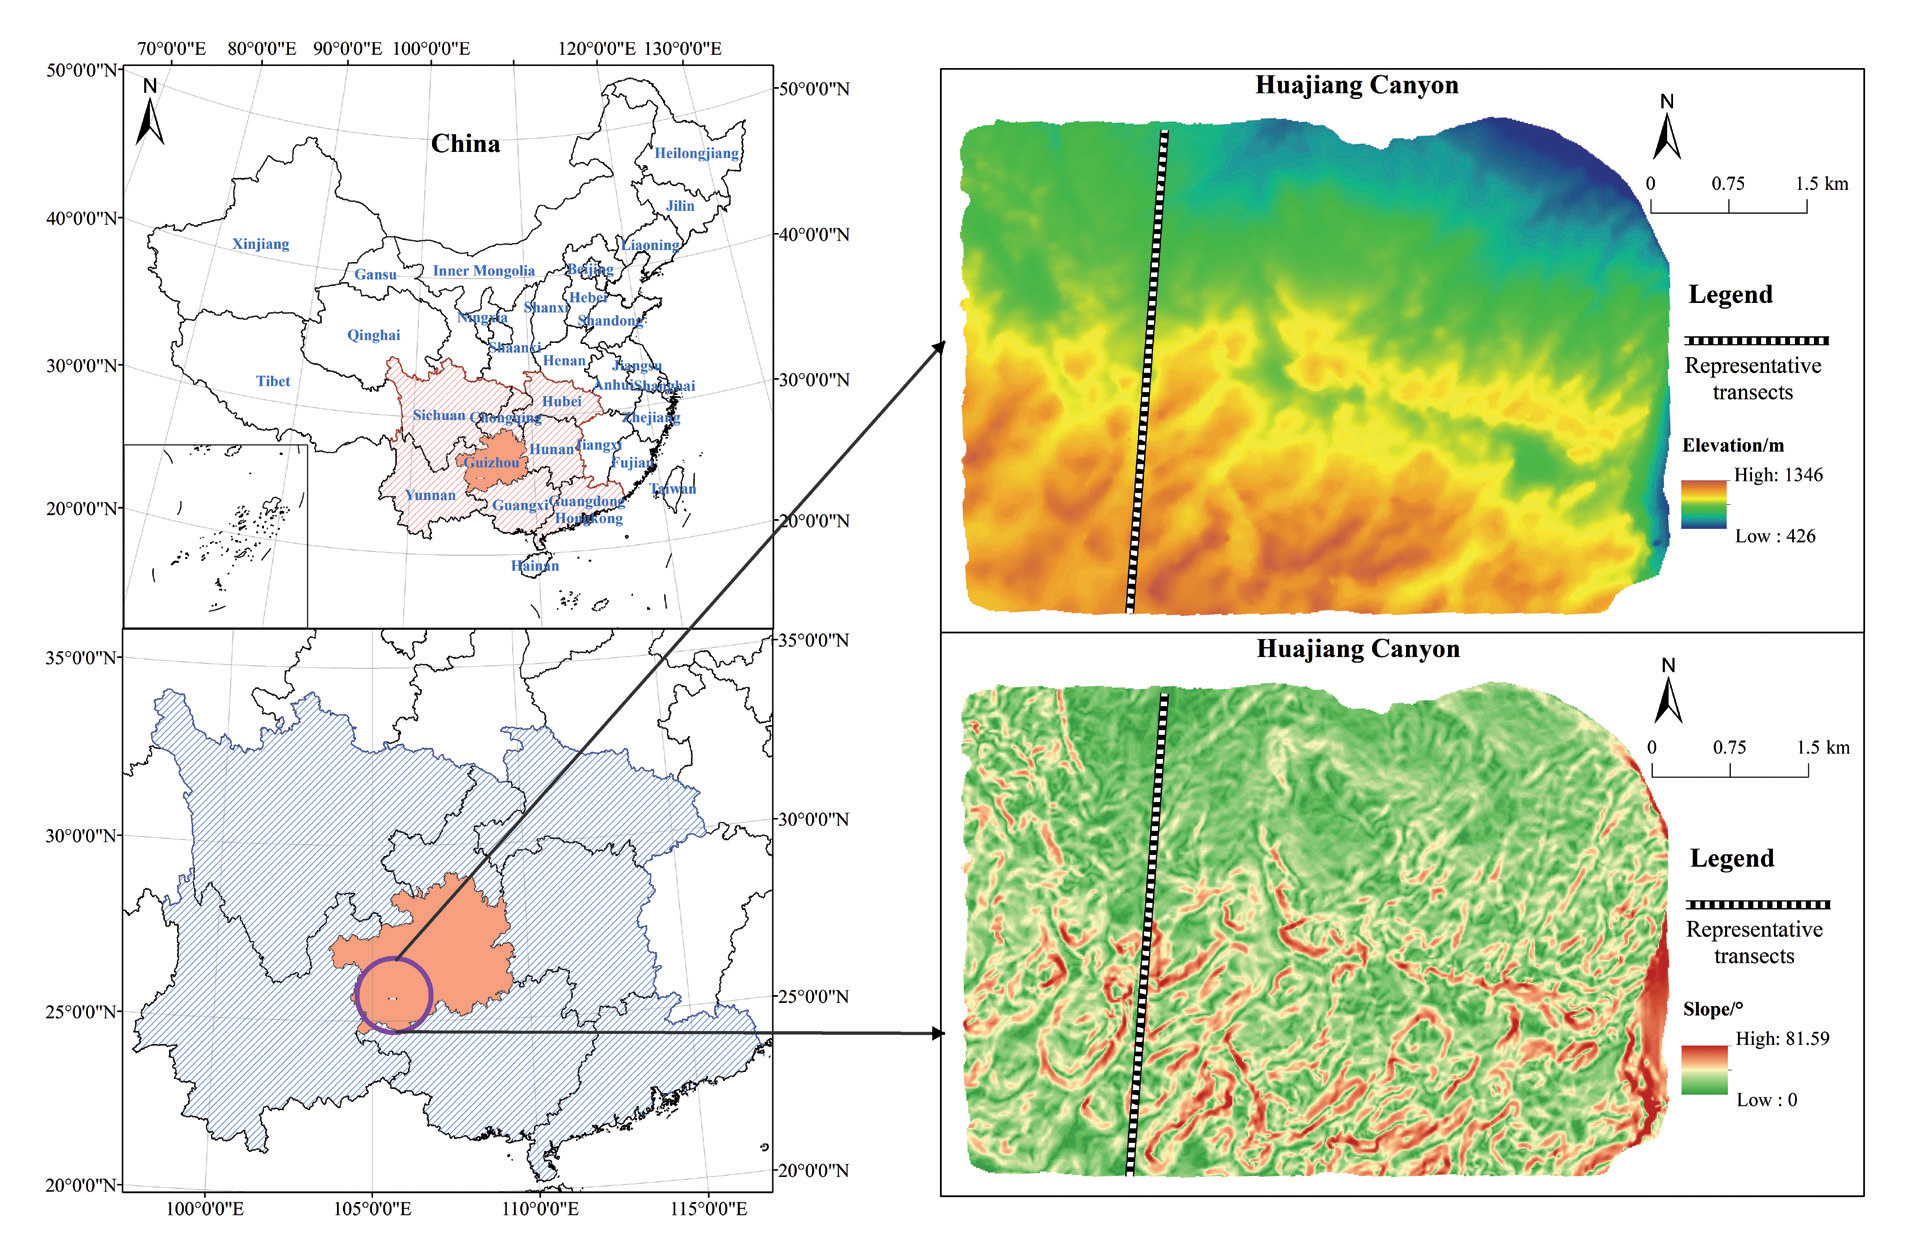
The HC is located in the northern part of Beipanjiang Town, Zhenfeng County, Guizhou Province, in the hinterland of the KMA in southwest China (105°62′E - 105°69 ′E, 25°62 N′~25°65 ′N) (Figure 1). The study area covers a total area of 30.85 km2 and has a humid subtropical monsoon climate with an average annual temperature of 16.6℃ and an average annual precipitation of 1276.9 mm. Limestone in this region is widely distributed due to the different lithology of the strata. Under the interaction of internal and external camping forces, the diverse landforms in the area are formed, and the two primary forms are the karst peaked valleys and peak cluster and trough valleys from the north to the south, respectively [24]. The canyon area is characterized by severe rocky desertification and a fragile ecological environment, with a wide area of bare rock distribution, little woodland, mostly shrub forest, and a relatively sparse area of contiguous cultivated land. With the Chinese government’s increasing attention to the ecological environment, land use in karst mountainous areas has undergone a great transformation, and in recent years, some of the SCL in HC has been abandoned. SCL abandonment in the HC mainly occurs in the western region, and SCL abandonment is gradually changing with socio-economic development. As a typical ecologically fragile and rocky desertification region, HC contains typical karst landforms and rocky desertification landscapes in southwestern China. Therefore, the trend of SCL abandonment in the study area can reflect the general situation of SCL abandonment in similar ecologically fragile regions around the world, which can help guide the formulation of land remediation policies in similar mountainous areas.
Research Methods
Data Sources and Identification and Judgment of ACL
In this paper, ACL is defined as SCL that has been idle or deserted for more than two years (including two years) [14], based on which we obtained the most realistic SCL abandonment situation in HC through the field survey and interviews with farmers to identify the abandonment situation of SCL corresponding to high-resolution remote sensing imagery in the study area. We used the 2004 Spot image (resolution of 2.5m), 2010 ALOS image and Resource Satellite image (resolution of 2.5m), and 2015 and 2020 Google high-resolution remote sensing image (resolution of 0.5m) data of HC as the basis to obtain the required land use data, achieved through interpreting the images with human-computer interaction based on geoscientific knowledge and field research data. Our team continuously visited the study area from June 2021 to May 2022 to conduct field surveys on their SCL abandonment, and verified the uncertain patches with farmer interview surveys to get the 2020 SCL abandonment vector data. Comparison and verification of 2004, 2010, and 2015 with 2020 accurate ACL data after remote sensing image interpretation, and at the same time improve the accuracy of ACL identification through field consultation with farmers, etc., and finally obtain the land use vector data required in this paper. The results of the land use interpretation were verified in the field, and the interpretation accuracy of the examined land use types was above 90%.
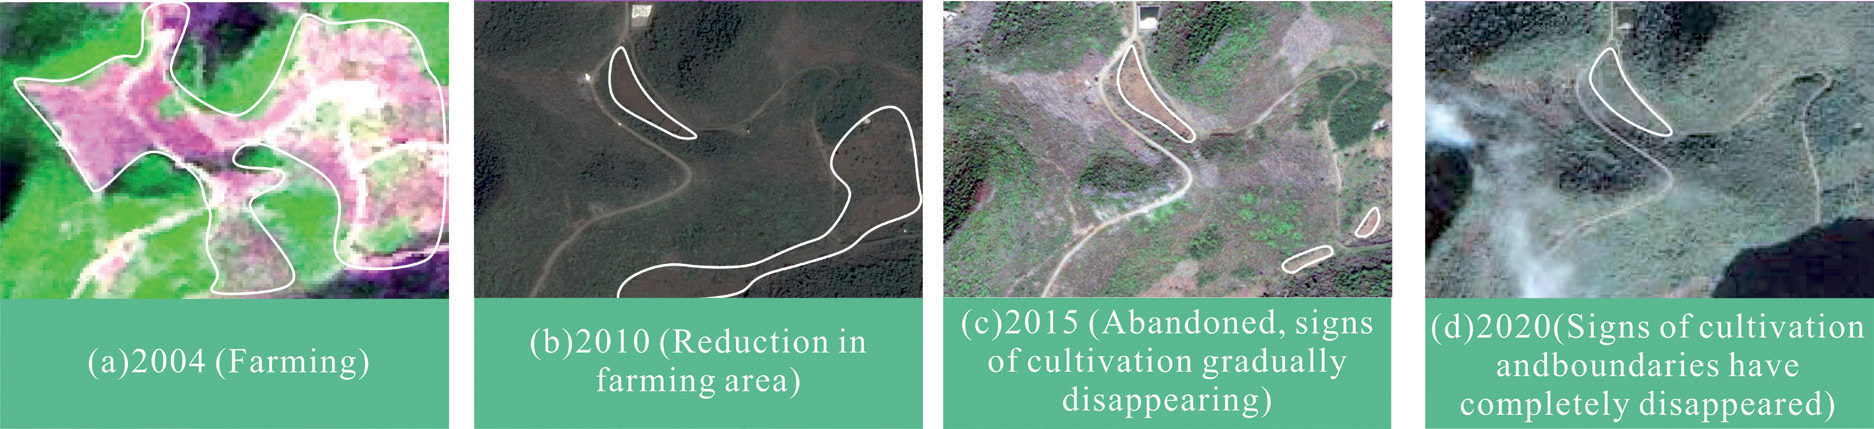
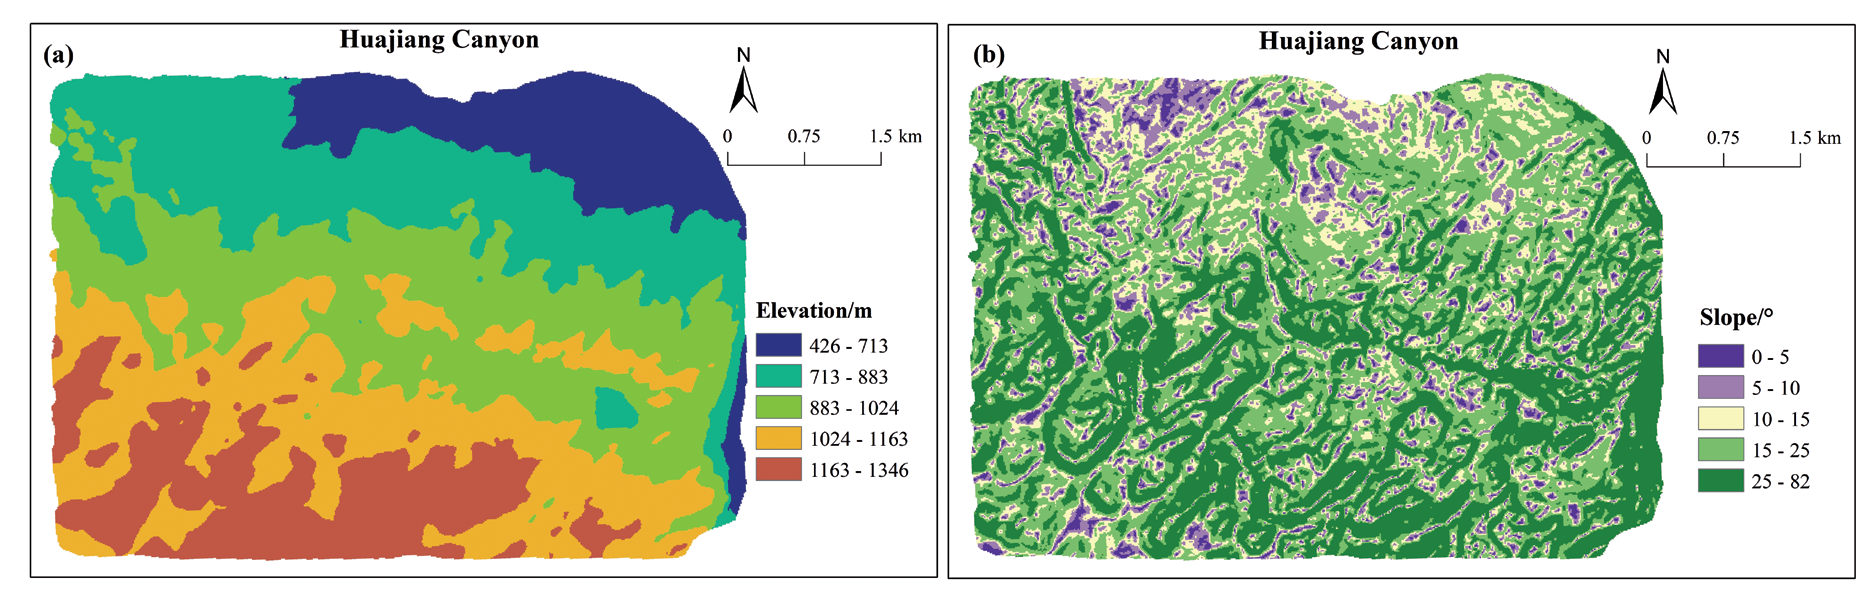
Fig. 4.
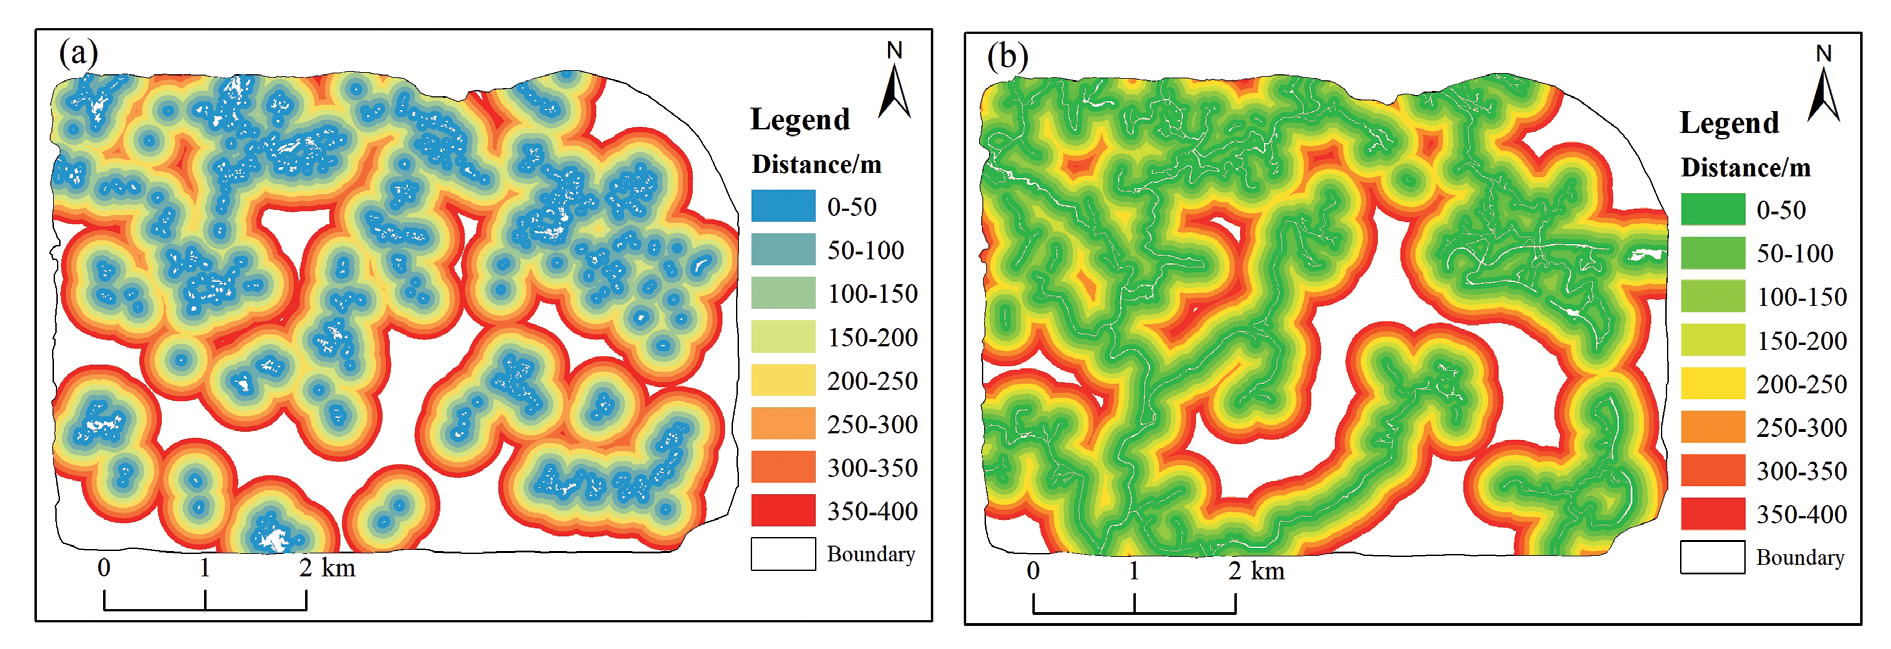
Illustration of buffer distribution around settlements and roads in 2020. ((a). Buffer distribution around settlements ;(b). Buffer distribution around roads)
We studied the process to investigate the abandonment status of SCL further. During the visual interpretation process, the pink patches in the 2004 image indicated SCL (Figure 2a). The same area was significantly decreased for farming in 2010 (Figure 2b), and part of the SCL was abandoned. Most of the site was transformed into ACL in 2015 (Figure 2c), and traces of cultivation gradually disappeared. In 2020, traces of cultivation disappeared, and the surrounding forested and shrubby landscape increased (Figure 2d). We accurately identified ACL patches in the study area based on the abandonment situation of SCL. The research object of this paper is mainly ACL, so we extracted ACL patch data from the land use status map to further analyze its distribution and evolution pattern.
Landscape Pattern Index
The landscape pattern index, which quantitatively analyzes the landscape’s structural composition and spatial configuration by highly condensing the landscape pattern information in the study area [25, 26], can effectively reflect ACL’s landscape pattern evolution characteristics in KAMs. Therefore, based on the actual situation of the study area and referring to previous studies, we selected the class area (CA), the number of patches (NP), the mean patch size (MPS), the largest patch index (LPI), the patch density (PD), the landscape shape index (LSI), and the agglomeration index (AI) to study the landscape characteristics of the change of ACL, and the ecological significance and related algorithms are shown in the references [27].
Classification of Elevation and Slope and Transect Analysis
We used ArcGIS 10.7 software to divide the elevation of the study area into five categories using the natural breakpoint method to comprehensively explore the distribution and evolutionary trends of ACL over different terrains (Figure 3a), i.e., 426 m-713 m, 713 m-883 m, 883 m-1024 m, 1024 m-1163 m, and 1163 m-1346 m. Meanwhile, we divided the slope into five classes: 0°–5°, 5°–10°, 10°–15°, 15°–25°, and 25°–82° (Figure 3b) to explore the evolution of ACL under different elevations and slopes.
We studied the evolution of ACL in KMAs by choosing the transect where ACL is more distributed and more severely disturbed by human activities to demonstrate the dynamic changes of ACL in various terrains in the context of the entire region. Tran-sects were selected based on the principle of covering the typical landscapes of the whole study area and the relatively significant changes in the landscape of ACL, and the topographic profiles generated by the transects from south to north were selected for comparative study with the transects of the current situation of land use in each period (Figure 1).
Settlement and Road Buffer Analysis
Buffer analysis is a buffer region created around a point, line, or plane at a defined buffer radius, and the method is effective in solving the proximity problem of spatial entities [28]. Human activities are the main factor influencing land use patterns [29]. Settlements and roads are the central regions of human activities, and human activities highly affect the land use patterns around them. Therefore, in this paper, to explore the impact of human-land relationship interaction on the ACL, rural settlements and rural roads are selected for performing buffer zone analysis each year to clarify further the impact of human activities on the evolution of the ACL and its distribution pattern. The buffer zone starts from the perimeter of the settlement or road, with a buffer distance of 50m at intervals, and explores the evolution of ACL within the buffer zones of 0 m–50 m, 50 m–100 m, 100 m–150 m, 150 m–200 m, 200 m–250 m, 250 m–300 m, 300 m–350 m, and 350 m–400 m, respectively (Figure 4).
Land Use Transfer Matrix
The land use transfer matrix can reflect the direction of change of ACL to different land use structures, and arranging the area of land use change according to the matrix can provide a quantitative description of the change of ACL transfer[30]. The calculation formula is as follows:
Where
Spatial Autocorrelation Analysis
We used the global Moran′s I coefficient and the local spatial autocorrelation index LISA to analyze the spatial correlations of ACL.
(1) Global spatial autocorrelation can test the distribution pattern of ACL in the whole area, and the global Moran’s I is formulated as follows:
(2) Local spatial autocorrelation can reflect the spatial correlation between the attribute value of an element and neighboring elements in a small localized area in KMAs, and the local spatial autocorrelation LISA index is formulated as follows:
Where
Results and Analysis
Changes in the Landscape Pattern of ACL
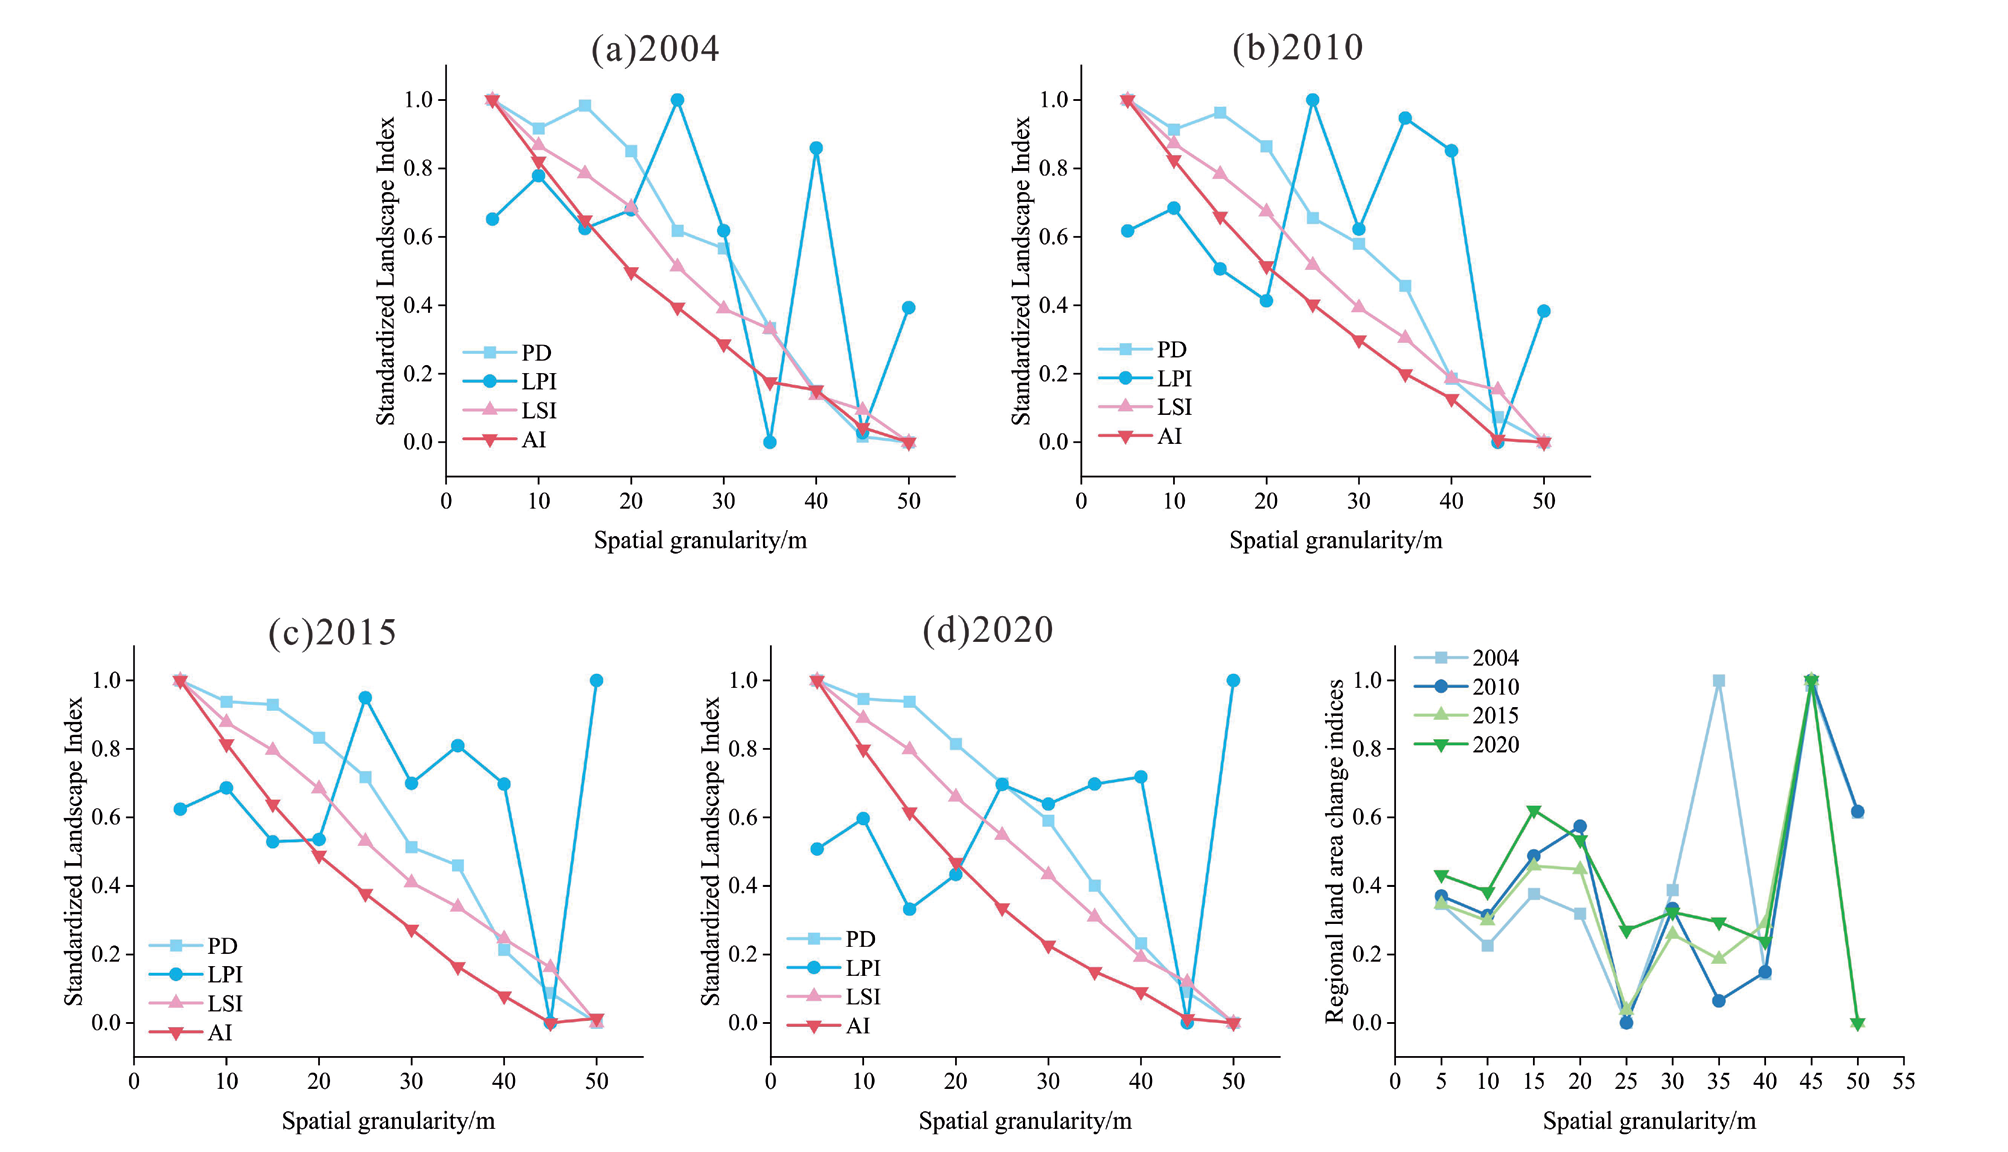
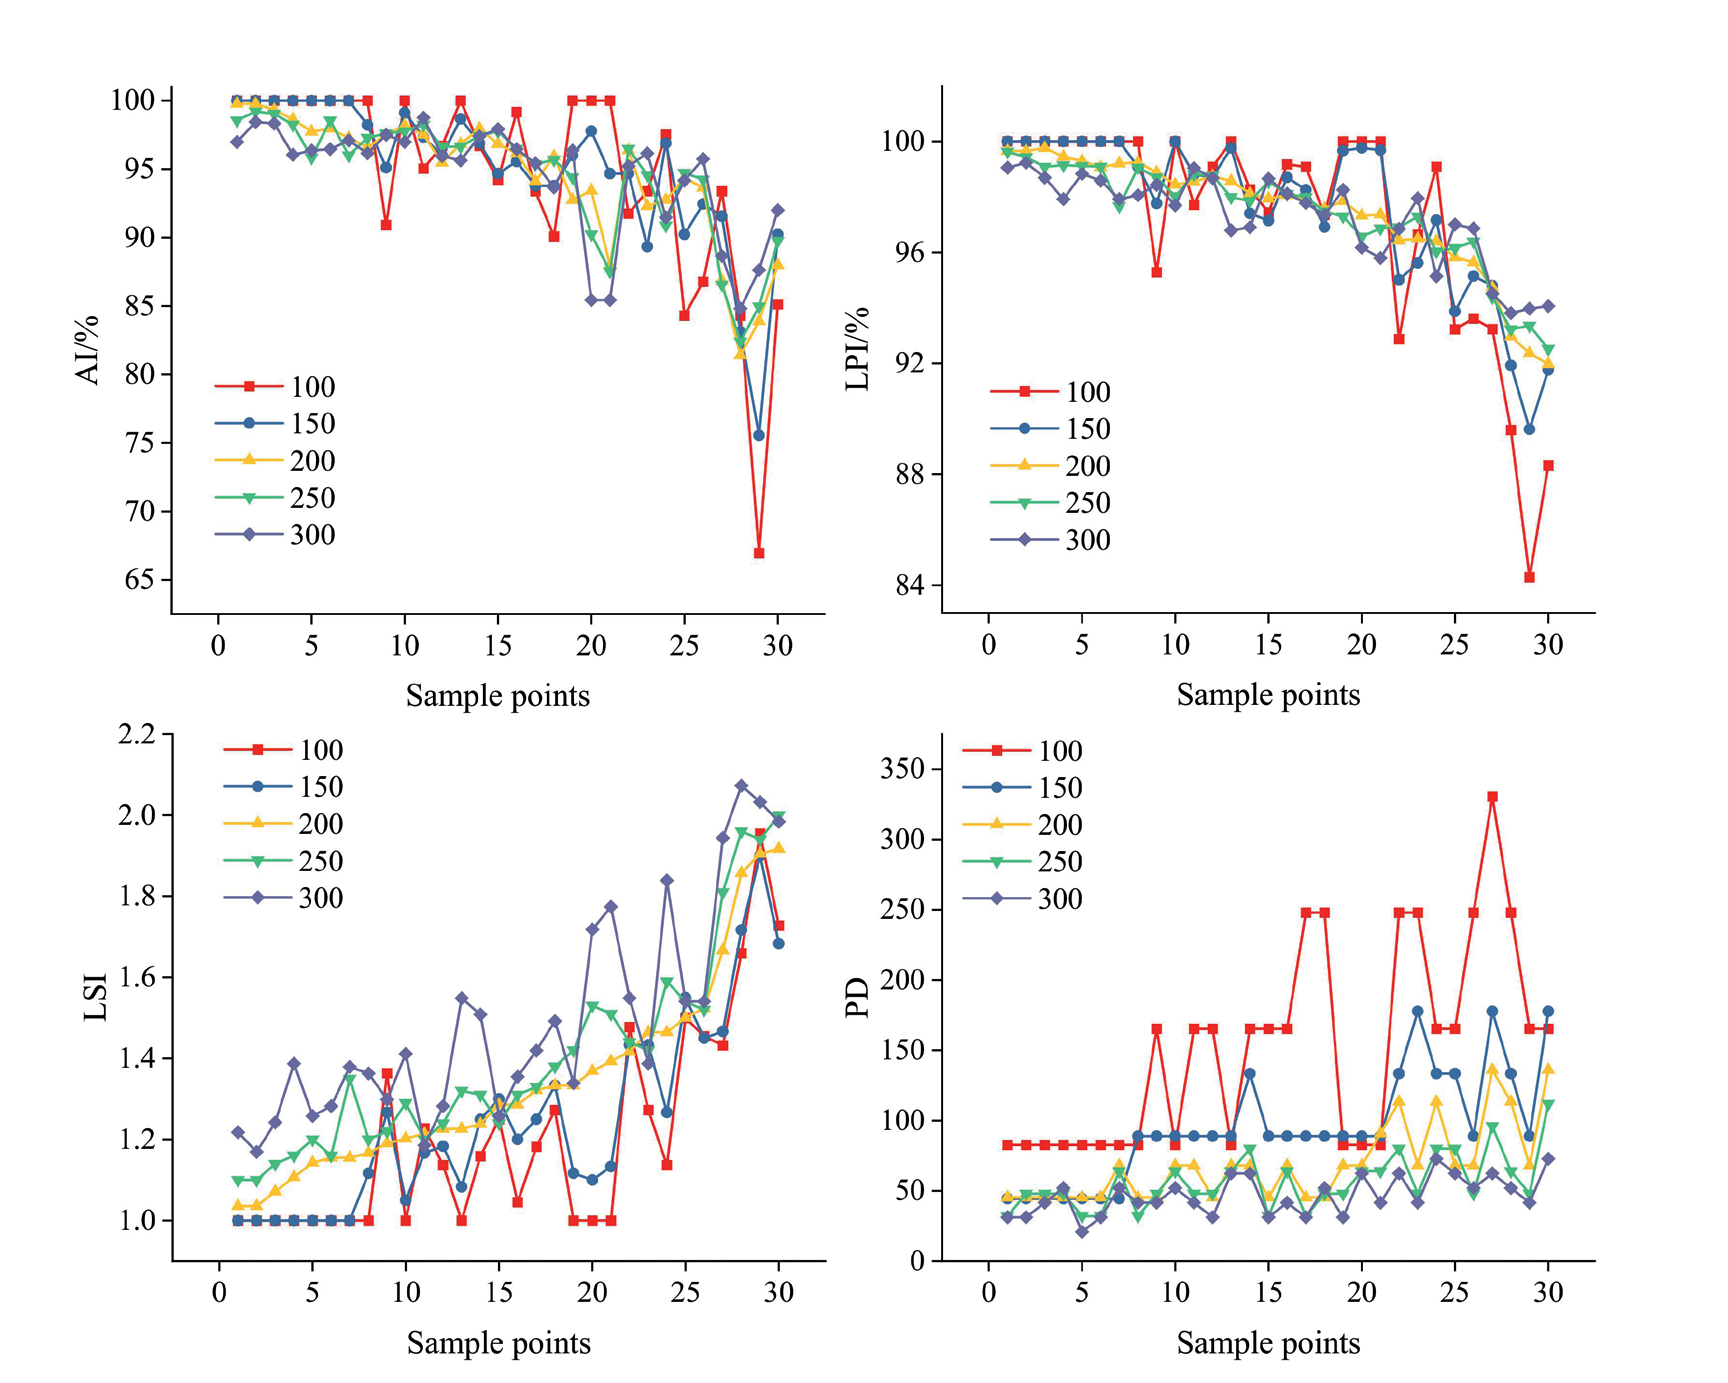
We analyzed the relevant landscape pattern indices by using Fragstats 4.2 software to calculate the relevant index, and by using the results of the analysis of the spatial granularity effect of landscape patterns and area information conservation evaluation, we determined that 10 m is the most suitable granularity for research in the study area [31] (Figure 5). Furthermore, we measured the landscape index values of 30 random sample points through different moving window sizes (Figure 6) and determined that the 200m moving window scale could ensure the gradient characteristics of the landscape index without making it fluctuate greatly, and could reflect the actual pattern of change in the landscape index of ACL [32]. We thus calculated the associated landscape pattern indices at 10m granularity and 200m moving window size.
Changes in the Number of Landscape Pattern Indices for ACL
HC has severe rocky desertification and a fragile ecological environment. The area of SCL in the study area is relatively small but shows a small-scale abandonment phenomenon. The areas of the patches of ACL are small and fragmented, so the landscape pattern index can effectively reflect the quantitative trend of ACL in the study area. The area of ACL in HC was 27.47 hm2 in 2004, increased to 59.30 hm2 in 2010, 71.05 hm2 in 2015, and 141.30 hm2 by 2020, and the proportion of its SCL abandonment to the whole area of the study area in 2004, 2010, 2015, and 2020 was 0.89%, 1.92%, and 4.57%, 1.92%, 2.3%, and 4.57%, respectively. From 2004 to 2020, the area of ACL in HC has gradually increased, indicating that the abandonment of SCL is becoming increasingly evident. As shown in Table 1, the NP of ACL in HC was 109 in 2004 and increased to 474 in 2020, and the degree of fragmentation of ACL increased significantly. Furthermore, the LPI, PD, and LSI of the ACL in HC showed a gradually increasing trend, while the AI index showed a trend of first increasing and then decreasing, indicating that the distribution of the ACL in the KMA is more dispersed and the trend of its evolution is more significant in terms of fragmentation, with a decreasing degree of landscape agglomeration.
Distributional Characteristics of the Landscape Pattern of the ACL
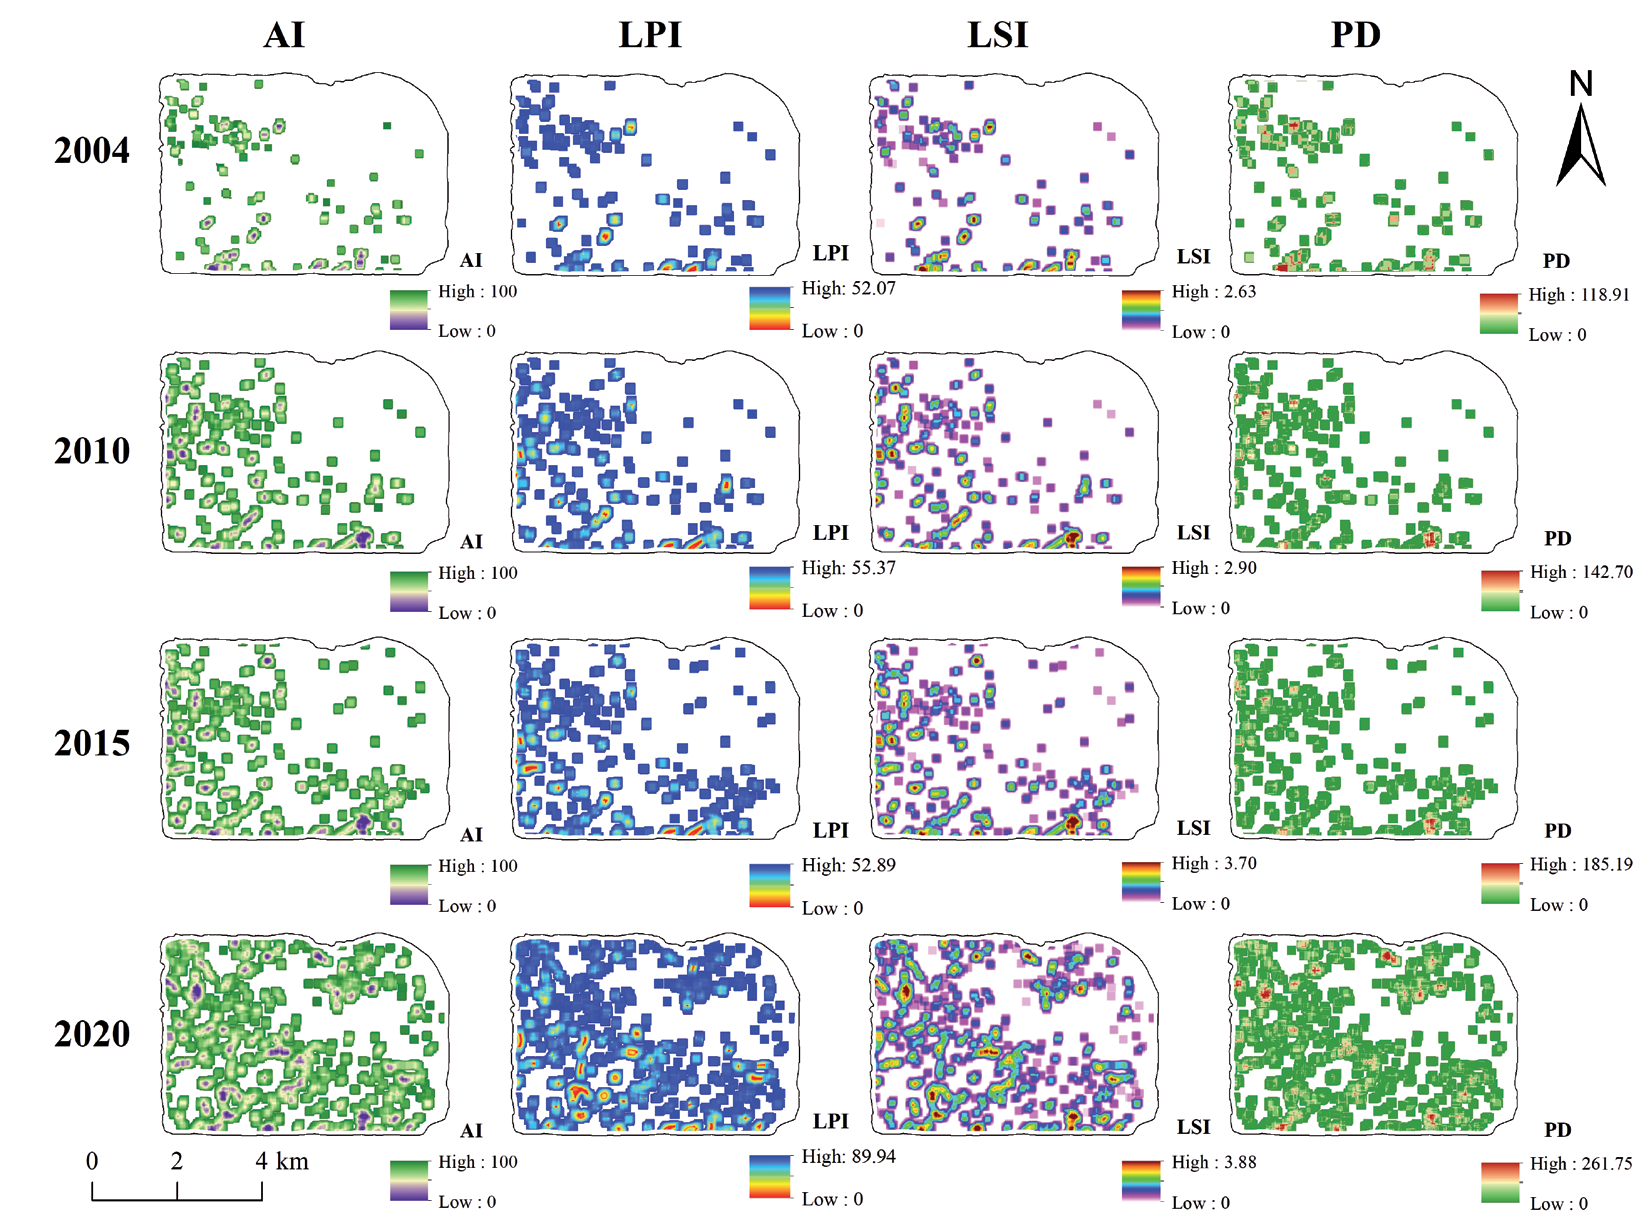
We used a 200m×200m moving window in this paper to explore the spatial distribution pattern of the landscape pattern index of ACL in the HC region. As shown in Figure 7, the distribution of high AI value areas of ACL in KMAs from 2004 to 2020 is mainly located in the southwestern and southern regions, and the distribution range of ACL shows a tendency to spread. The high-value LPI area was concentrated in the southern area of the study area in 2004, while the high-value LPI area expanded and was concentrated in the southwestern region of the canyon area in 2010, and there was a slight trend of expansion in its extent in 2015 and increase of both the high-value and low-value LPI areas through 2018. From 2004 to 2020, the LSI high-value area in HC showed an increasing trend. The shape of the ACL was developed in the direction of irregularity. Its high-value area was mainly concentrated in the western region, where SCL was gradually abandoned due to the rugged and complex terrain. The LSI high-value area was significantly expanded from 2015 to 2020. From 2004 to 2015, the PD high-value areas of ACL were mainly concentrated in the southern region, and in 2020, the PD high-value areas showed a significant increase, and the distribution spread to the whole region to form multiple high-value concentration areas. The distribution of ACL is concentrated in the southern and southwestern regions, and the landscape pattern index of ACL shows different concentration characteristics in the spatial distribution.
Evolution of the Distribution of ACL on Different Slopes and Elevations
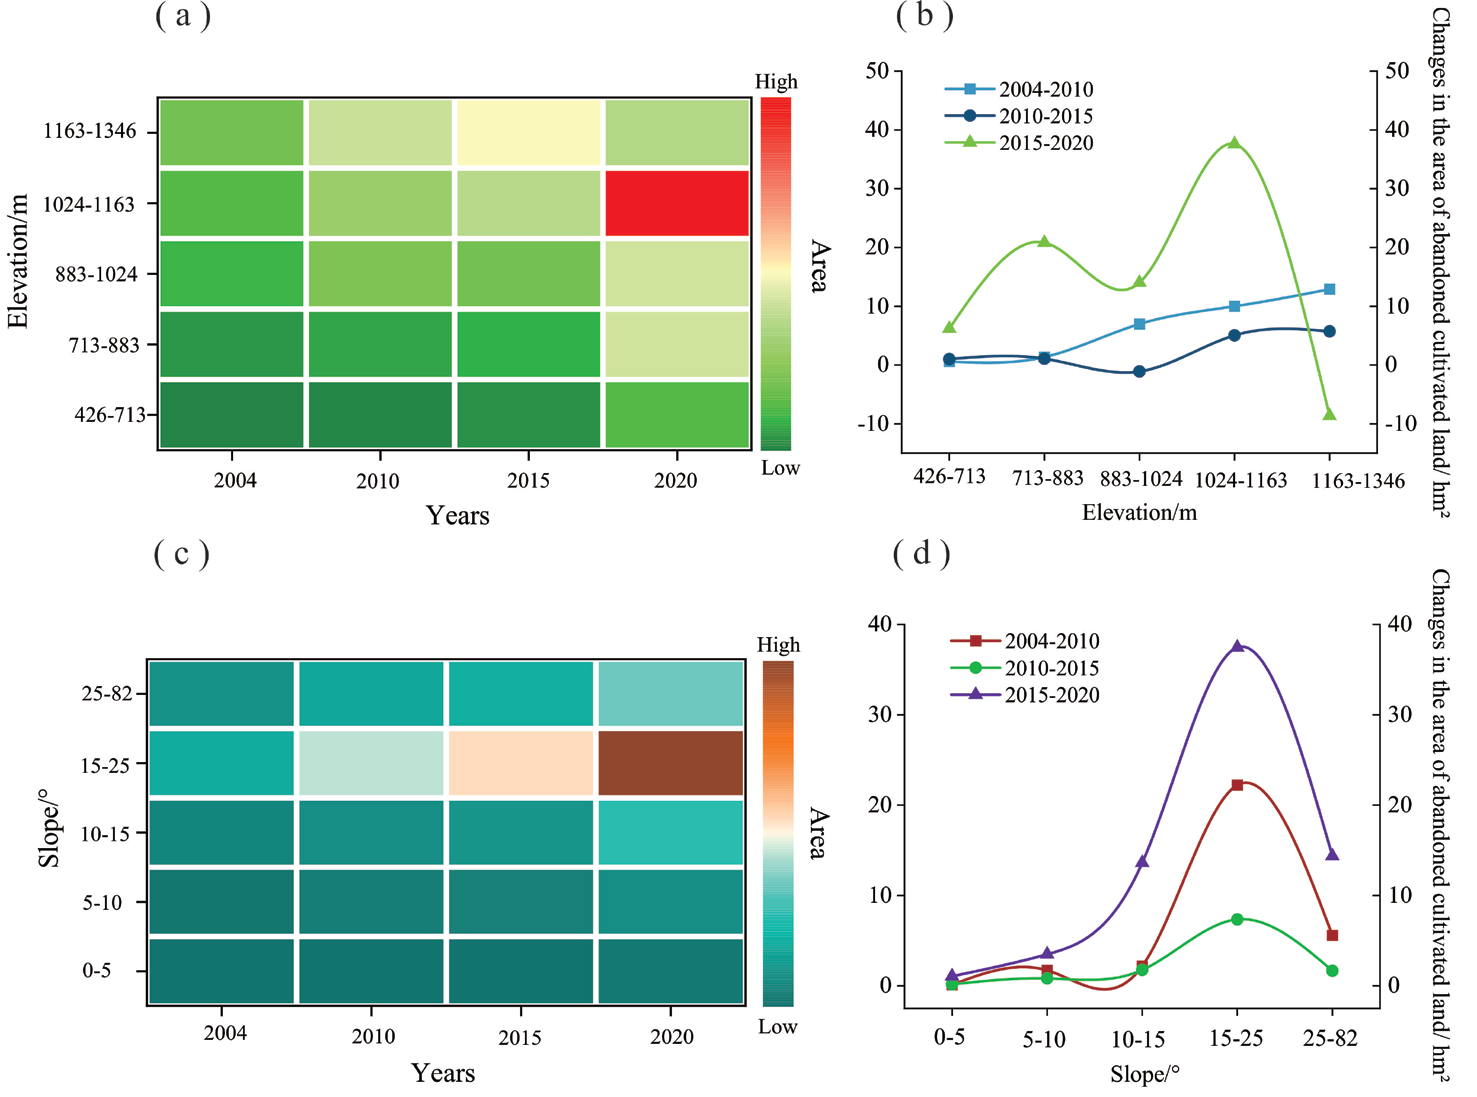
SCL is mainly distributed in the study area within the elevation range of 713 m to 1346 m, and the phenomenon of abandonment of SCL is also mainly concentrated in this elevation range. From 2004 to 2015, the area of ACL was distributed primarily in the elevation range of 1163m to 1146m (Figure 8a). In this elevation range, the area of ACL was 11.62 hm2 in 2004, 24.53 hm2 in 2010, and 30.27 hm2 in 2015. In 2020, the area of ACL was mainly distributed in the elevation range from 1024m to 1163m, with a distribution area of 60.20 hm2. The center of gravity of ACL began to transfer from high elevation to low elevation areas. From 2004 to 2010, the ACL showed an increasing trend with the increase in elevation (Figure 8b), with the most significant increase in the range of 1163 m to 1346 m, and the abandonment area of SCL increased by 12.91 hm2. From 2010 to 2015, ACL decreased by 1.09 hm2 in the elevation range between 883m and 1024m and then increased with the rise in elevation. From 2015 to 2020, the change of ACL showed an “M” shaped trend in different elevation ranges, but in general it is mainly increasing, and the area of ACL is larger than that from 2004 to 2010 and from 2010 to 2015.
The distribution of ACL in different slope ranges was mainly concentrated in the area from 15° to 25° (Figure 8c), and the area of ACL in this slope range was 14.20 hm2, 36.42 hm2, 43.76 hm2, and 81.23 hm2 in 2004, 2010, 2015, and 2020, respectively. From 2004 to 2020, the ACL in different slope ranges showed an increasing trend (Figure 8d), and with the increase in slope, the growth of ACL showed an increase and then a decrease. From 2015 to 2020, the growth of ACL was the largest, and it was mainly concentrated in the slope range between 15° and 25°.
Direction of the Evolution of ACL
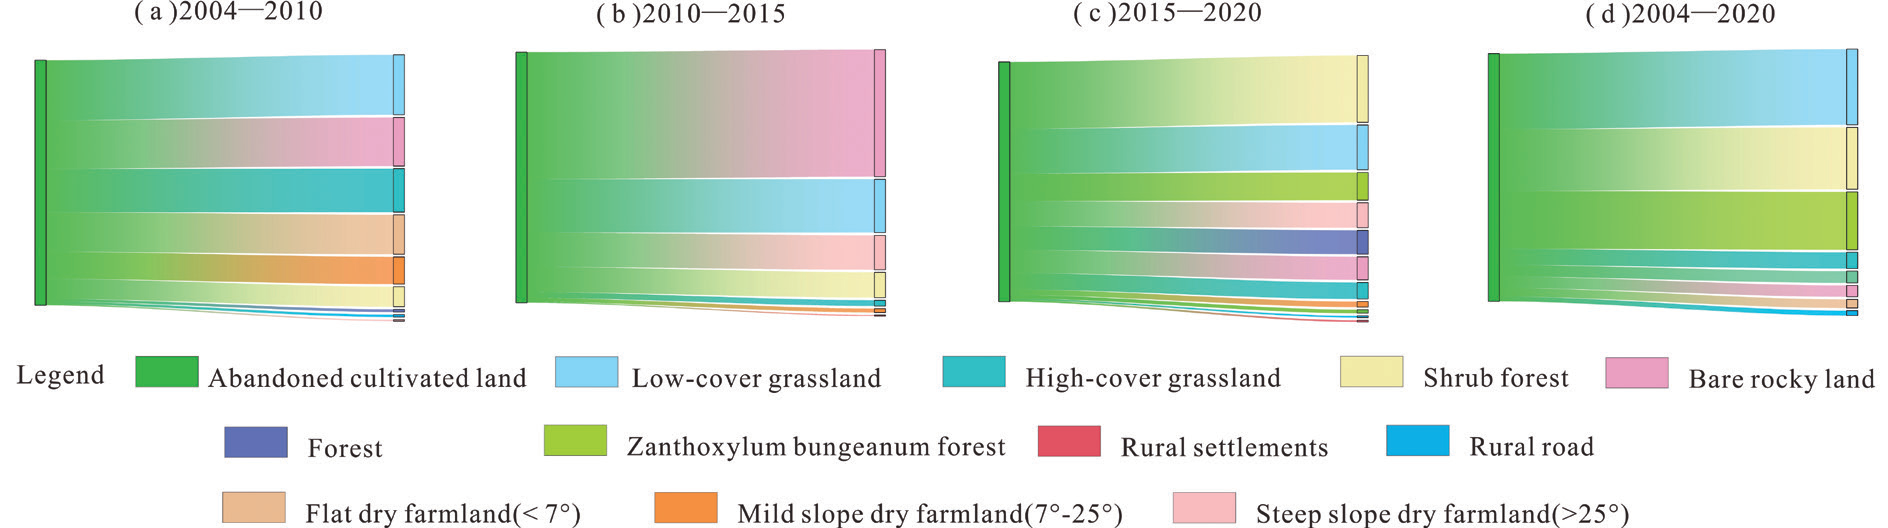
In the long-term evolution of SCL abandonment, the transfer of ACL to other land types is the primary basis for the direction of the evolution of ACL (Figure 9). From 2004 to 2010, ACLs mainly evolved into low-cover grassland, bare rock land, and high-cover grassland, with the evolutionary area of 0.64 hm², 0.51 hm², and 0.50 hm², respectively. While some ACLs in flatter terrain areas tended to be reclaimed, and some were transformed into shrub forests. From 2010 to 2015, ACL mainly evolved to form bare rock land and low-cover grassland, with transferred areas of 1.91 hm² and 0.80 hm² respectively. From 2015 to 2020, a large amount of ACL was transformed into eco-economic land utilization, and the area of ACL transformed into zanthoxylum bungeanum forests was 1.97 hm². On the whole, from 2004 to 2020, the evolution of ACL mainly evolved towards low-cover grassland, shrub forests, and zanthoxylum bungeanum forests, and zanthoxylum bungeanum forest planting is one of the main ecological restoration methods for the management of rocky desertification in KMAs, so that the reclamation of ACL for intensive farming is effective in improving the ecological environment of the region on the one hand, and it is also a major source of economic income for the farmers in KMAs on the other hand.
Relationship Between the Distribution of ACL and Settlements and Roads
Human activities will affect land use, and it is significant to explore the abandonment of SCL from the perspective of human settlements to reveal the distribution rule of ACL in KMAs. Rural settlements are centers of human activity, and we used rural settlements as representatives of human settlements to explore the distances at which farmers abandoned SCL. From the perspective of the distribution of SCL abandonment and the distance of rural settlements, the farther away from the settlements, the more significant SCL abandonment is (Figure 10a). From 2004 to 2020, the SCL abandonment presents the distribution characteristics of the gradually decreasing distance from rural settlements from far to near the ACL area; a large amount of SCL is abandoned when the radius of cultivation is more than 250 meters from the rural settlements. Namely, farmers will be the first to abandon the SCL in the areas farther away from the settlements and to plant food crops around the centers of human activities to meet the needs of family life.
As rural infrastructure improves, the improvement of rural roads also impacts land use patterns, with differences in distance from rural roads causing differences in the abandonment of SCL. According to the distribution of ACL in the buffer ring at different distances from the road, ACL is mainly distributed in the buffer ranges of 0 m–50 m, 50 m–100 m, and 250 m–300 m from the road (Figure 10b). For its special natural conditions and local policy response, the road surrounding some SCL will be abandoned after reclamation, planting economic fruits and forest crops to promote regional economic development and improve the ecological environment. The SCL abandonment degree is low in the 100m–250m from the road range, which is the main food farming area.
Fig. 10.
Relationship between the distribution of ACL and settlements and roads (a. Relationship between ACL and settlements; b. Relationship between ACL and roads).
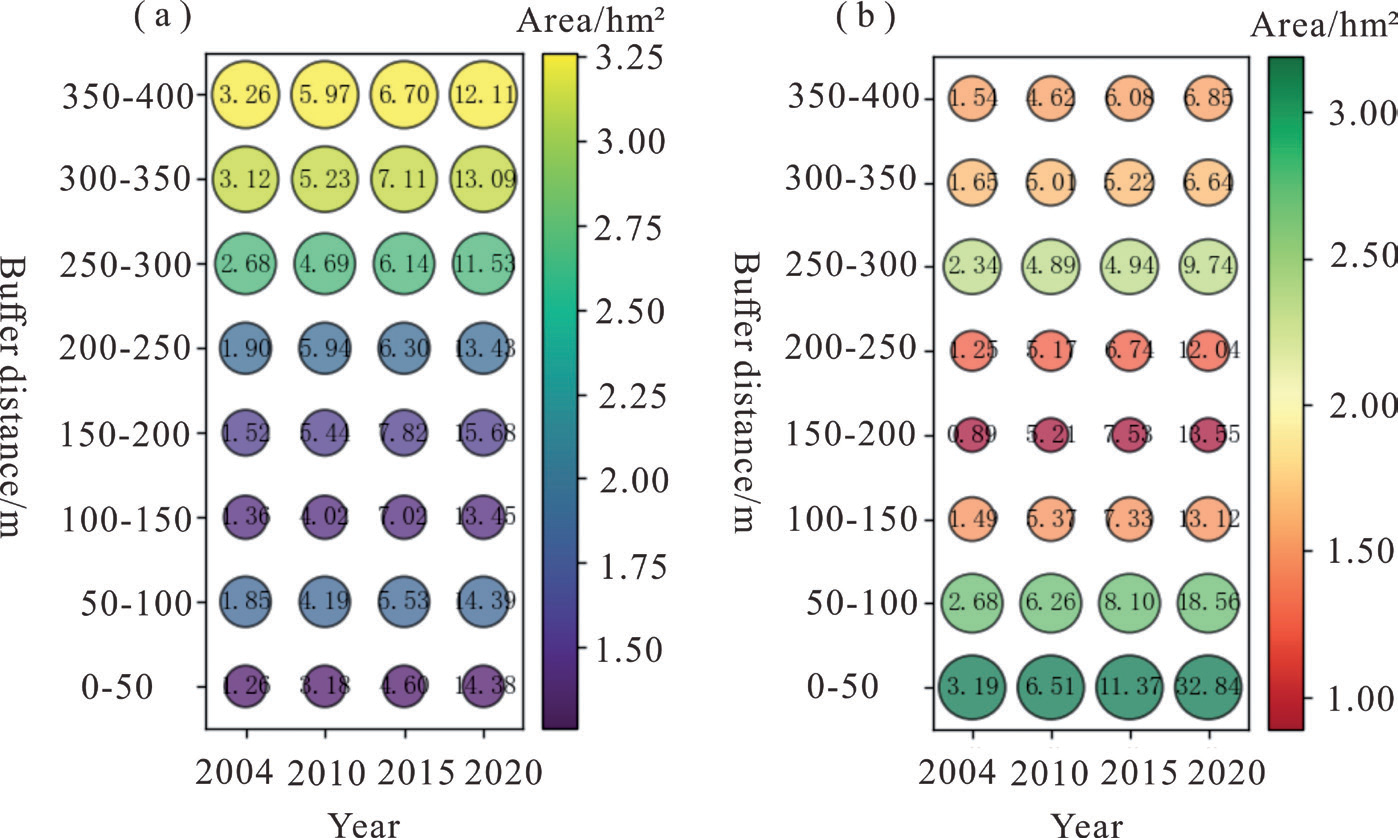
Fig. 11.
Changes in the ACL area surrounding different settlements in typical villages in the study area from 2004 to 2020.
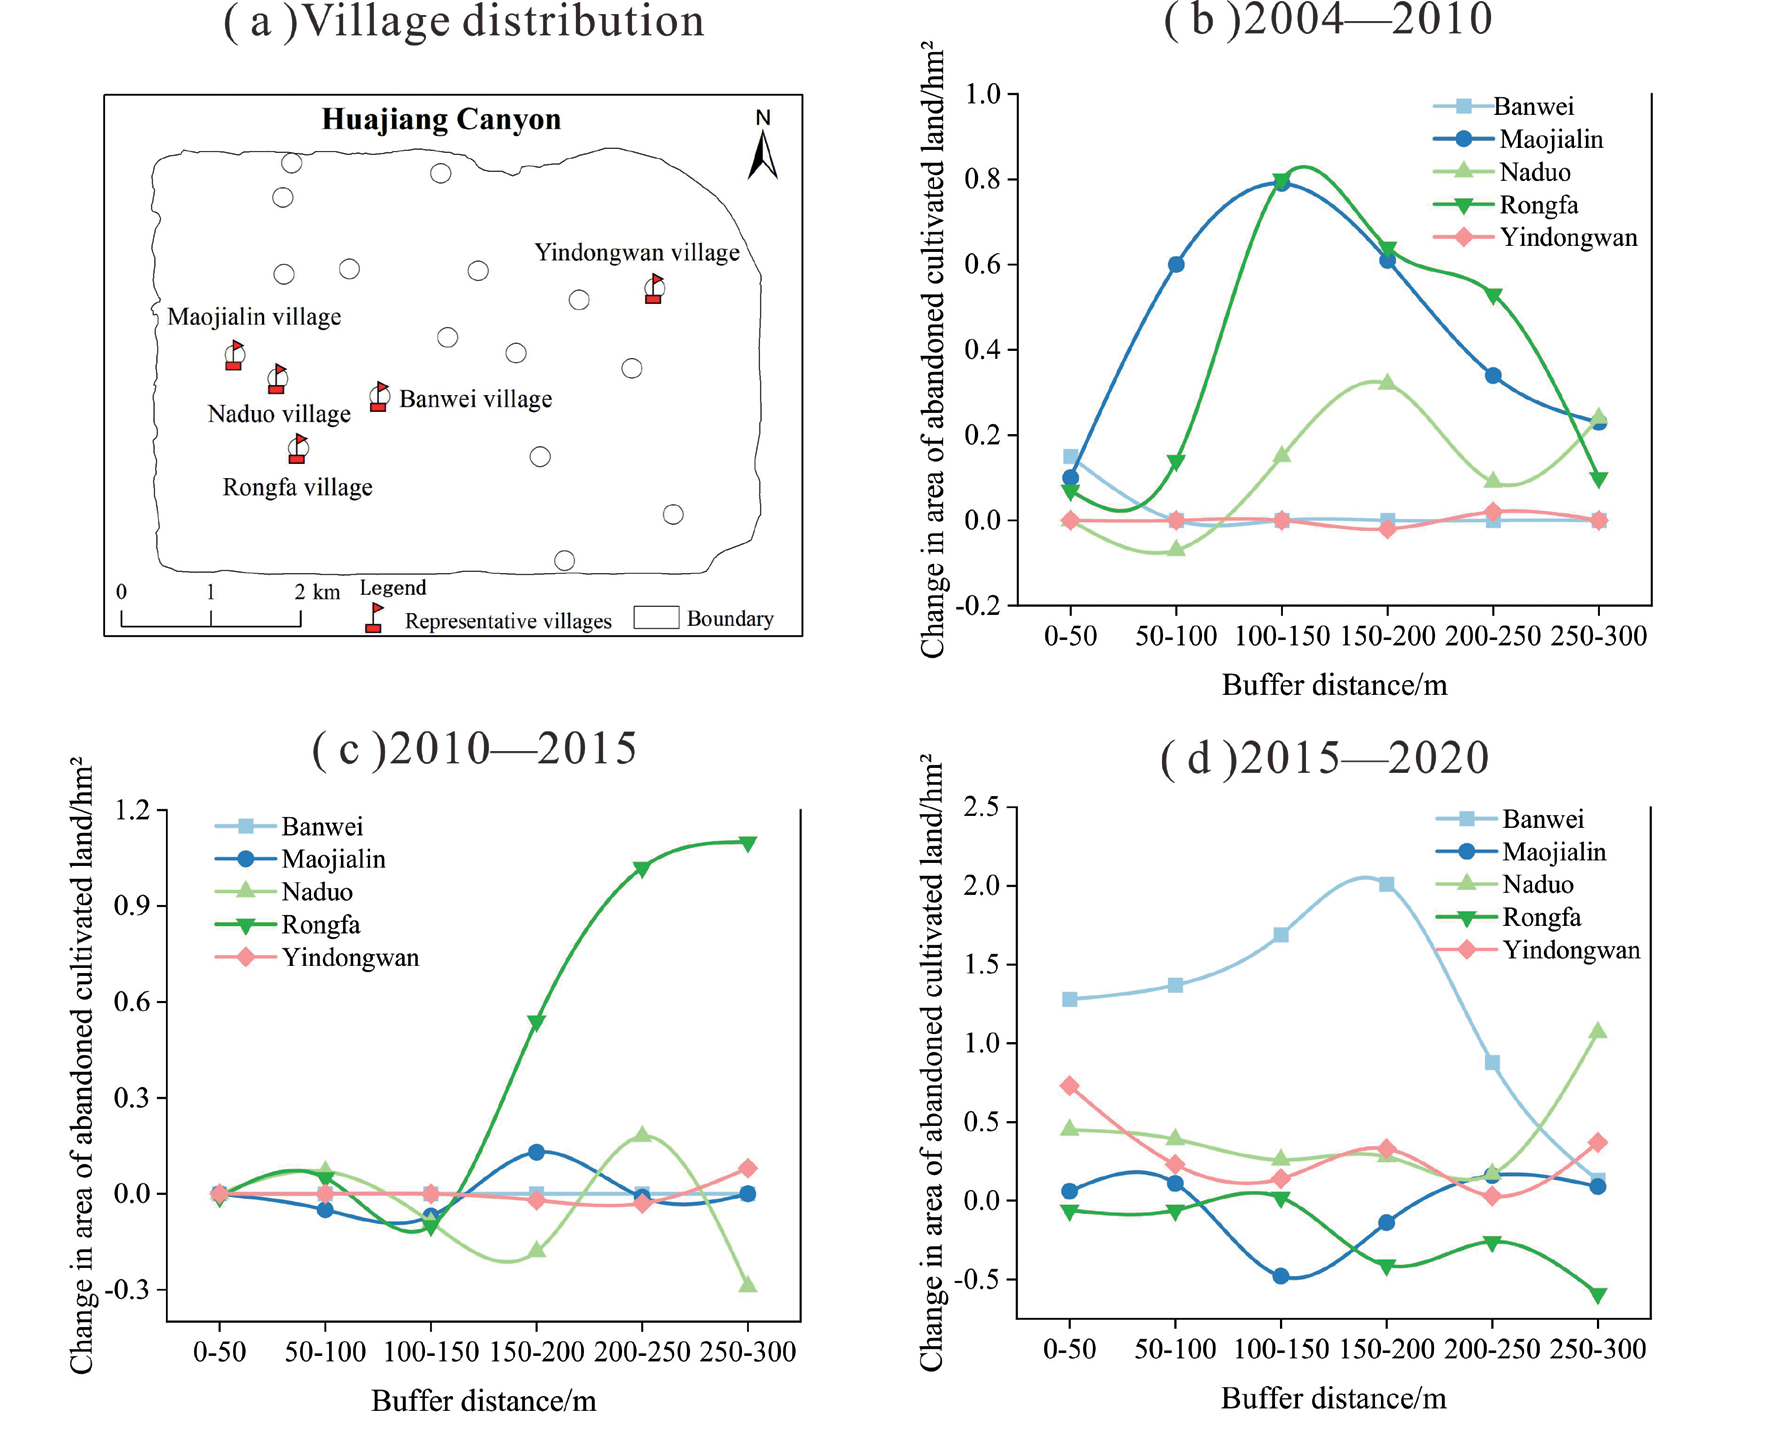
Based on the analysis of SCL abandonment surrounding rural settlements in the whole region and according to the differences in the natural environment and socio-economic conditions of the study area, we selected five typical village settlements to further reveal the coupling relationship between SCL abandonment and the proximity of village settlements under different socio-economic and natural environmental backgrounds (Figure 11). From 2004 to 2010, the changes in the area of SCL abandonment in the Rongfa and Naduo villages were similar; as the distance from the settlement increased from near to far, the area of ACL first decreased, then rose, then reduced, and then increased in the repeating trend of change, and the changes in ACL in the Maojialin and Rongfa villages were the most obvious. From 2010 to 2015, the change in the area of ACL was relatively insignificant in all villages, but the most remarkable change was observed in Rongfa village in the range of 150m–300m from the settlement. Yindongwan village is in a flat terrain area, but its rocky desertification is severe, and there is very little SCL, so SCL is hardly abandoned in the area. In Banwei village from 2004 to 2015, SCL abandonment was very little; from 2015 to 2020, Banwei SCL abandonment was the most serious, and its ACL area changed dramatically, mainly because of the hollowing out of the settlement formed by the labor force going out in the region.
Characteristics of Spatial Autocorrelation of ACL
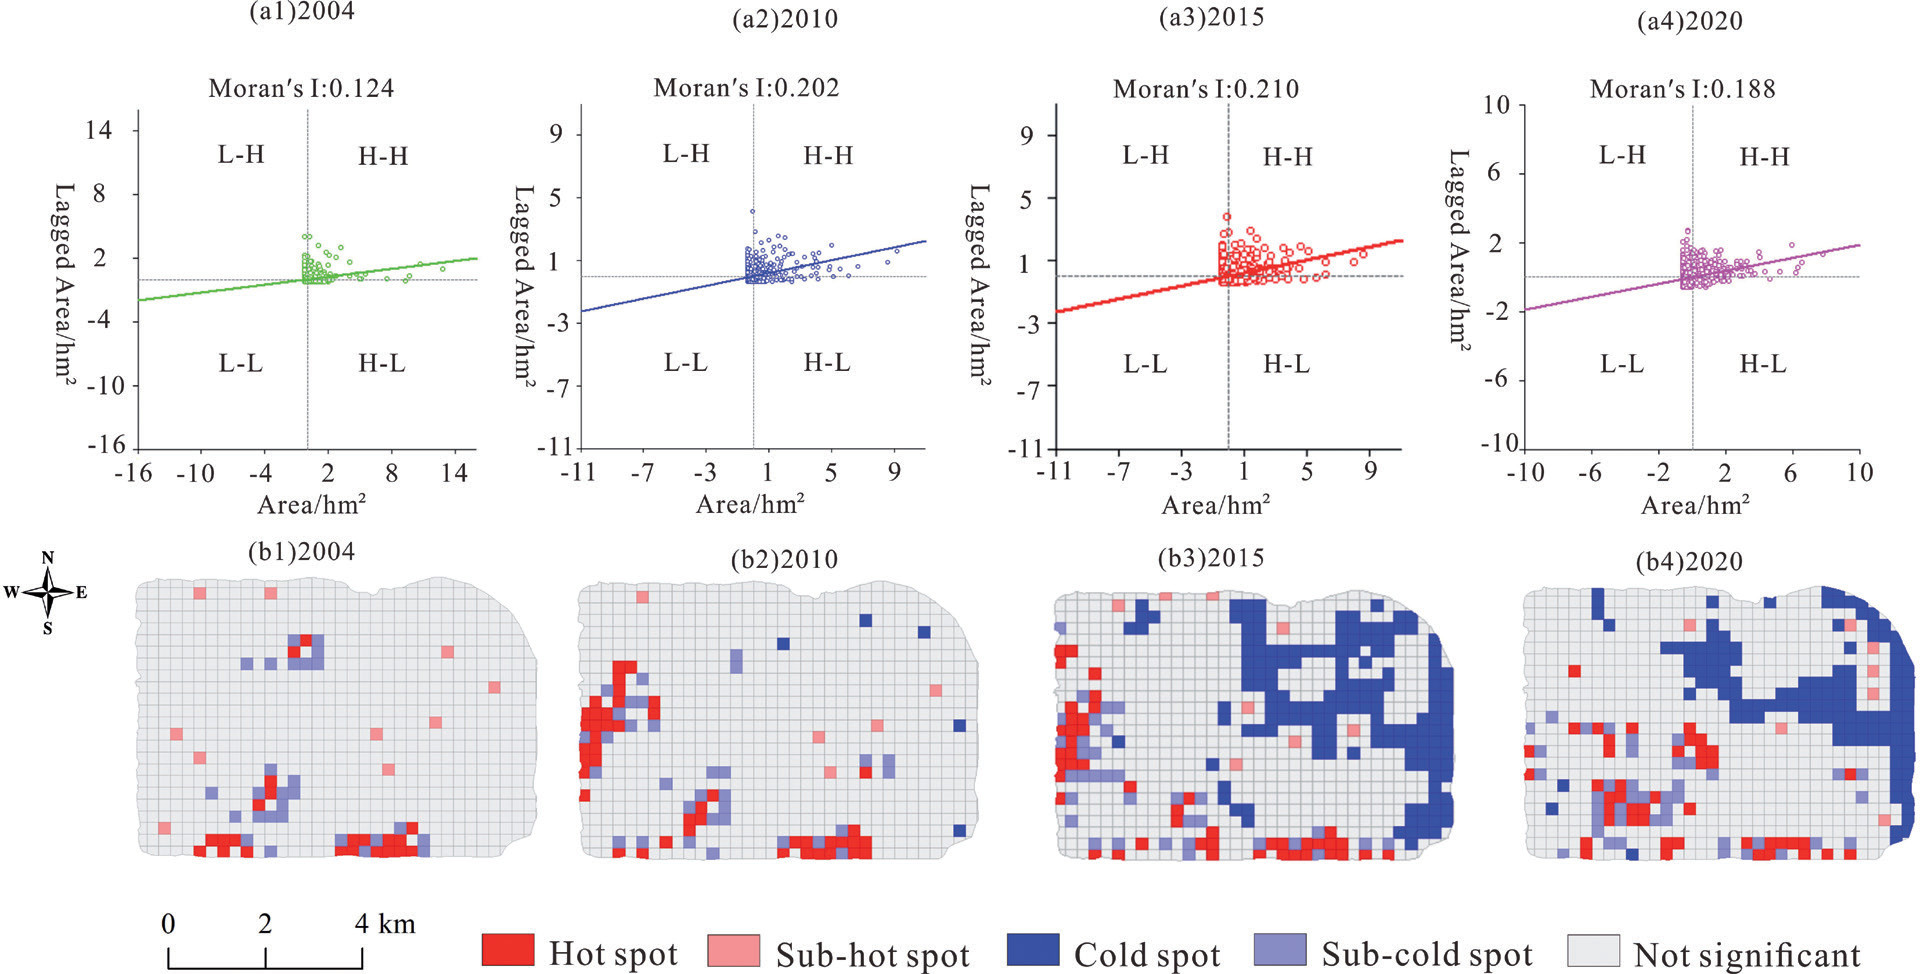
The spatial clustering distribution based on the identification of high and low values of ACL area can measure the high-value (hot spot) and low-value (cold spot) areas of ACL area in the study area and reveal the spatial clustering of ACL area in the HC over time (Figure 12). The global Moran′s I index for ACL in 2004, 2010, 2015, and 2020 was 0.124, 0.202, 0.210, and 0.188, respectively, indicating that the aggregation of ACL first increased and then decreased. The hotspots for the distribution of ACL in 2004 were mainly located in the south of the study area, where the rugged terrain, high elevations, steep slopes, and relatively harsh natural conditions made it a place where farmers first began to abandon SCL. In 2010, two hotspot clusters were formed in the study area’s south and west, with profound SCL abandonment in the poorly located areas. The hot spots in the distribution of ACL in 2015 were similar to those in 2010 but formed larger cold spots in the northeastern region. In 2020, the location of hot spots of ACL distribution was transferred, and hot spots were gradually formed in the southwest. The ACL was gradually transferred from high to low altitudes, and its cold spot area was still distributed northeast of the study area.
Discussion
Summary of the Evolutionary Pattern of ACL in the Study Area
HC has a complex topography, with fragmented and small land patches, serious rocky desertification, a vulnerable ecological environment, and a poor economic situation in the region [33], so the abandonment of SCL shows its evolutionary pattern in its unique natural environment and socio-economic context (Figure 13). The canyon from south to north, respectively, for the karst peak cluster and trough valleys and peaked valleys are two forms. The distribution of cultivated land is less and narrow, distributed in the bottom of the depression in the flat area, the region of gently SCL is widely distributed, and the area within the area of rocky desertification is a serious part of the area without the distribution of cultivated land, there is no SCL abandonment phenomenon. The abandonment of SCL in the HC in KMA has its uniqueness and diversity. Generally speaking, the probability of abandonment of SCL is higher in regions with poor soil quality and a smaller labor force [34], for example, Eastern Europe [35], Ukraine [36], Switzerland [37], etc. However, in the northern area of the HC, although the region is characterized by severe rocky desertification and poor soil quality, there is less SCL abandonment to ensure farmers’ basic food needs because of the minimal amount of original SCL resources. SCL in HC is mainly distributed in the 713 m to 1346m. From 2004 to 2020, SCL continued to shrink, and the phenomenon of abandonment of SCL was remarkable. The abandonment of SCL was also mainly concentrated in the range of elevation from 713m to 1346m. HC ACL was characterized by fragmented distribution, and spatially, the abandonment of SCL in the southern area of the study area was more significant. SCL distribution in KMAs gradually shifted from higher to lower altitudes. In the early stages of the study period, SCL abandonment mainly took place in high-altitude areas, but as society and the economy developed, SCL in low-altitude areas also started to become gradually abandoned. ACL and ecological land dominate higher elevation areas, while lower elevation regions are dominated by a small amount of ACL and a combination of productive and living land.
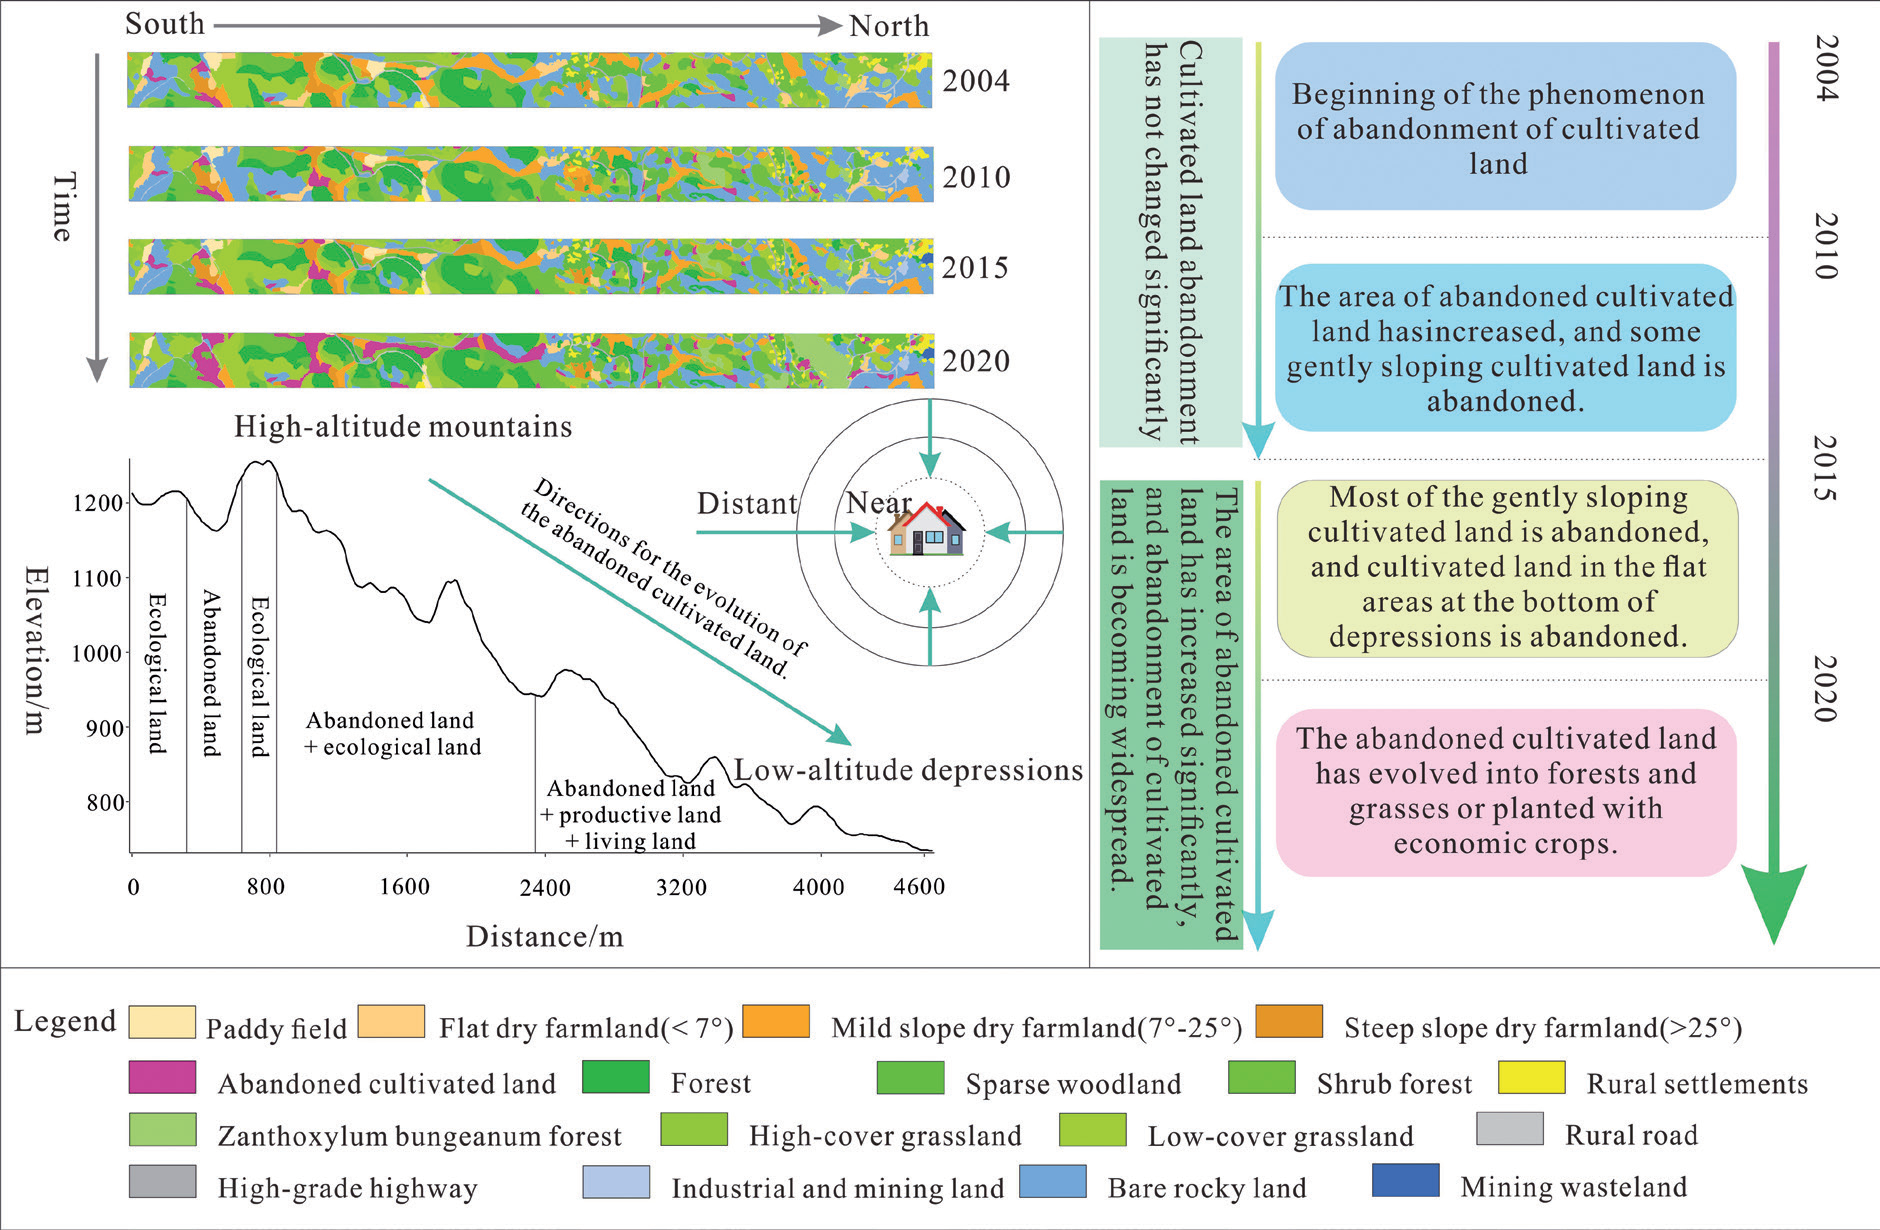
Meanwhile, the abandonment of SCL around the settlement is mainly centered on the settlement, showing a gradual expansion of ACL from near to far, and the farther away from the settlement, the more significant the SCL abandonment phenomenon is. From the time series of SCL abandonment change between 2004 and 2015, the SCL abandonment phenomenon is not significant. With the farmers’ response to the implementation of ecological policy, the 2015 SCL abandonment phenomenon is common. Some abandoned SCL replanting towards intensive development promotes local economic development and improves the overall rocky desertification in the study area and the ecological environment.
Drivers and Environmental Effects of the Evolution of ACL in Kmas
The driving force of land use change in KMAs includes both natural and human factors [38, 39], in which natural factors are the fundamental factors affecting the regional land use structure, and whether human activities rationally utilize the land within a short period, which will have a significant impact on the land use structure [40, 41]. Meanwhile, the human factors are the SCL abandonment of the most important influencing factor (Figure 14). The fragile ecological and geological background of the HC has led to a more complex situation of rocky desertification in the northern rather than the southern part of the study area, where SCL is scarce, but utilized to a relatively high degree, and the phenomenon of abandonment of SCL in the northern part of the region has occurred relatively later than in the southern part of the region. In the western part of the study area, most of the population in the Maojialin area went out to work, which led to the evolution of the settlement into a shrinking type of settlement, and the farmers pursued economic benefits to give up the poorly productive SCL on their own initiative. The population migration made the abandonment of the SCL phenomenon remarkable. From 2015 to 2020, due to the development of the zanthoxylum bungeanum forest industry and quarrying industry in HC, which attracted some farmers to return to their hometowns to start their businesses and employment, a small portion of the ACL was reclaimed, but the area of the ACL is still increasing. Many rocks are bare in the KMAs, and the government has made full use of the existing resource advantages to develop the quarrying industry, which has caused farmers in the mountainous areas to abandon traditional agricultural cultivation and increased the SCL abandoned to cultivation. Furthermore, in the northeastern area of the study area, Yindongwan village has abandoned its steep-slope cultivated land, and the gently-sloping cultivated land that has been abandoned has been reclaimed for planting zanthoxylum bungeanum forests and plums with high economic value [42], which can promote livelihood diversification of the farming households and the growth of the local economy and can also effectively restrain rocky desertification and improve the ecological environment. The sufficient sunshine in HC has brought about a good development of local economic fruit crops such as dragon fruits and plums and formed a unique regional brand, and the economic fruit forest industry is an effective means of obtaining ecological and economic win-win benefits in KMAs [43].
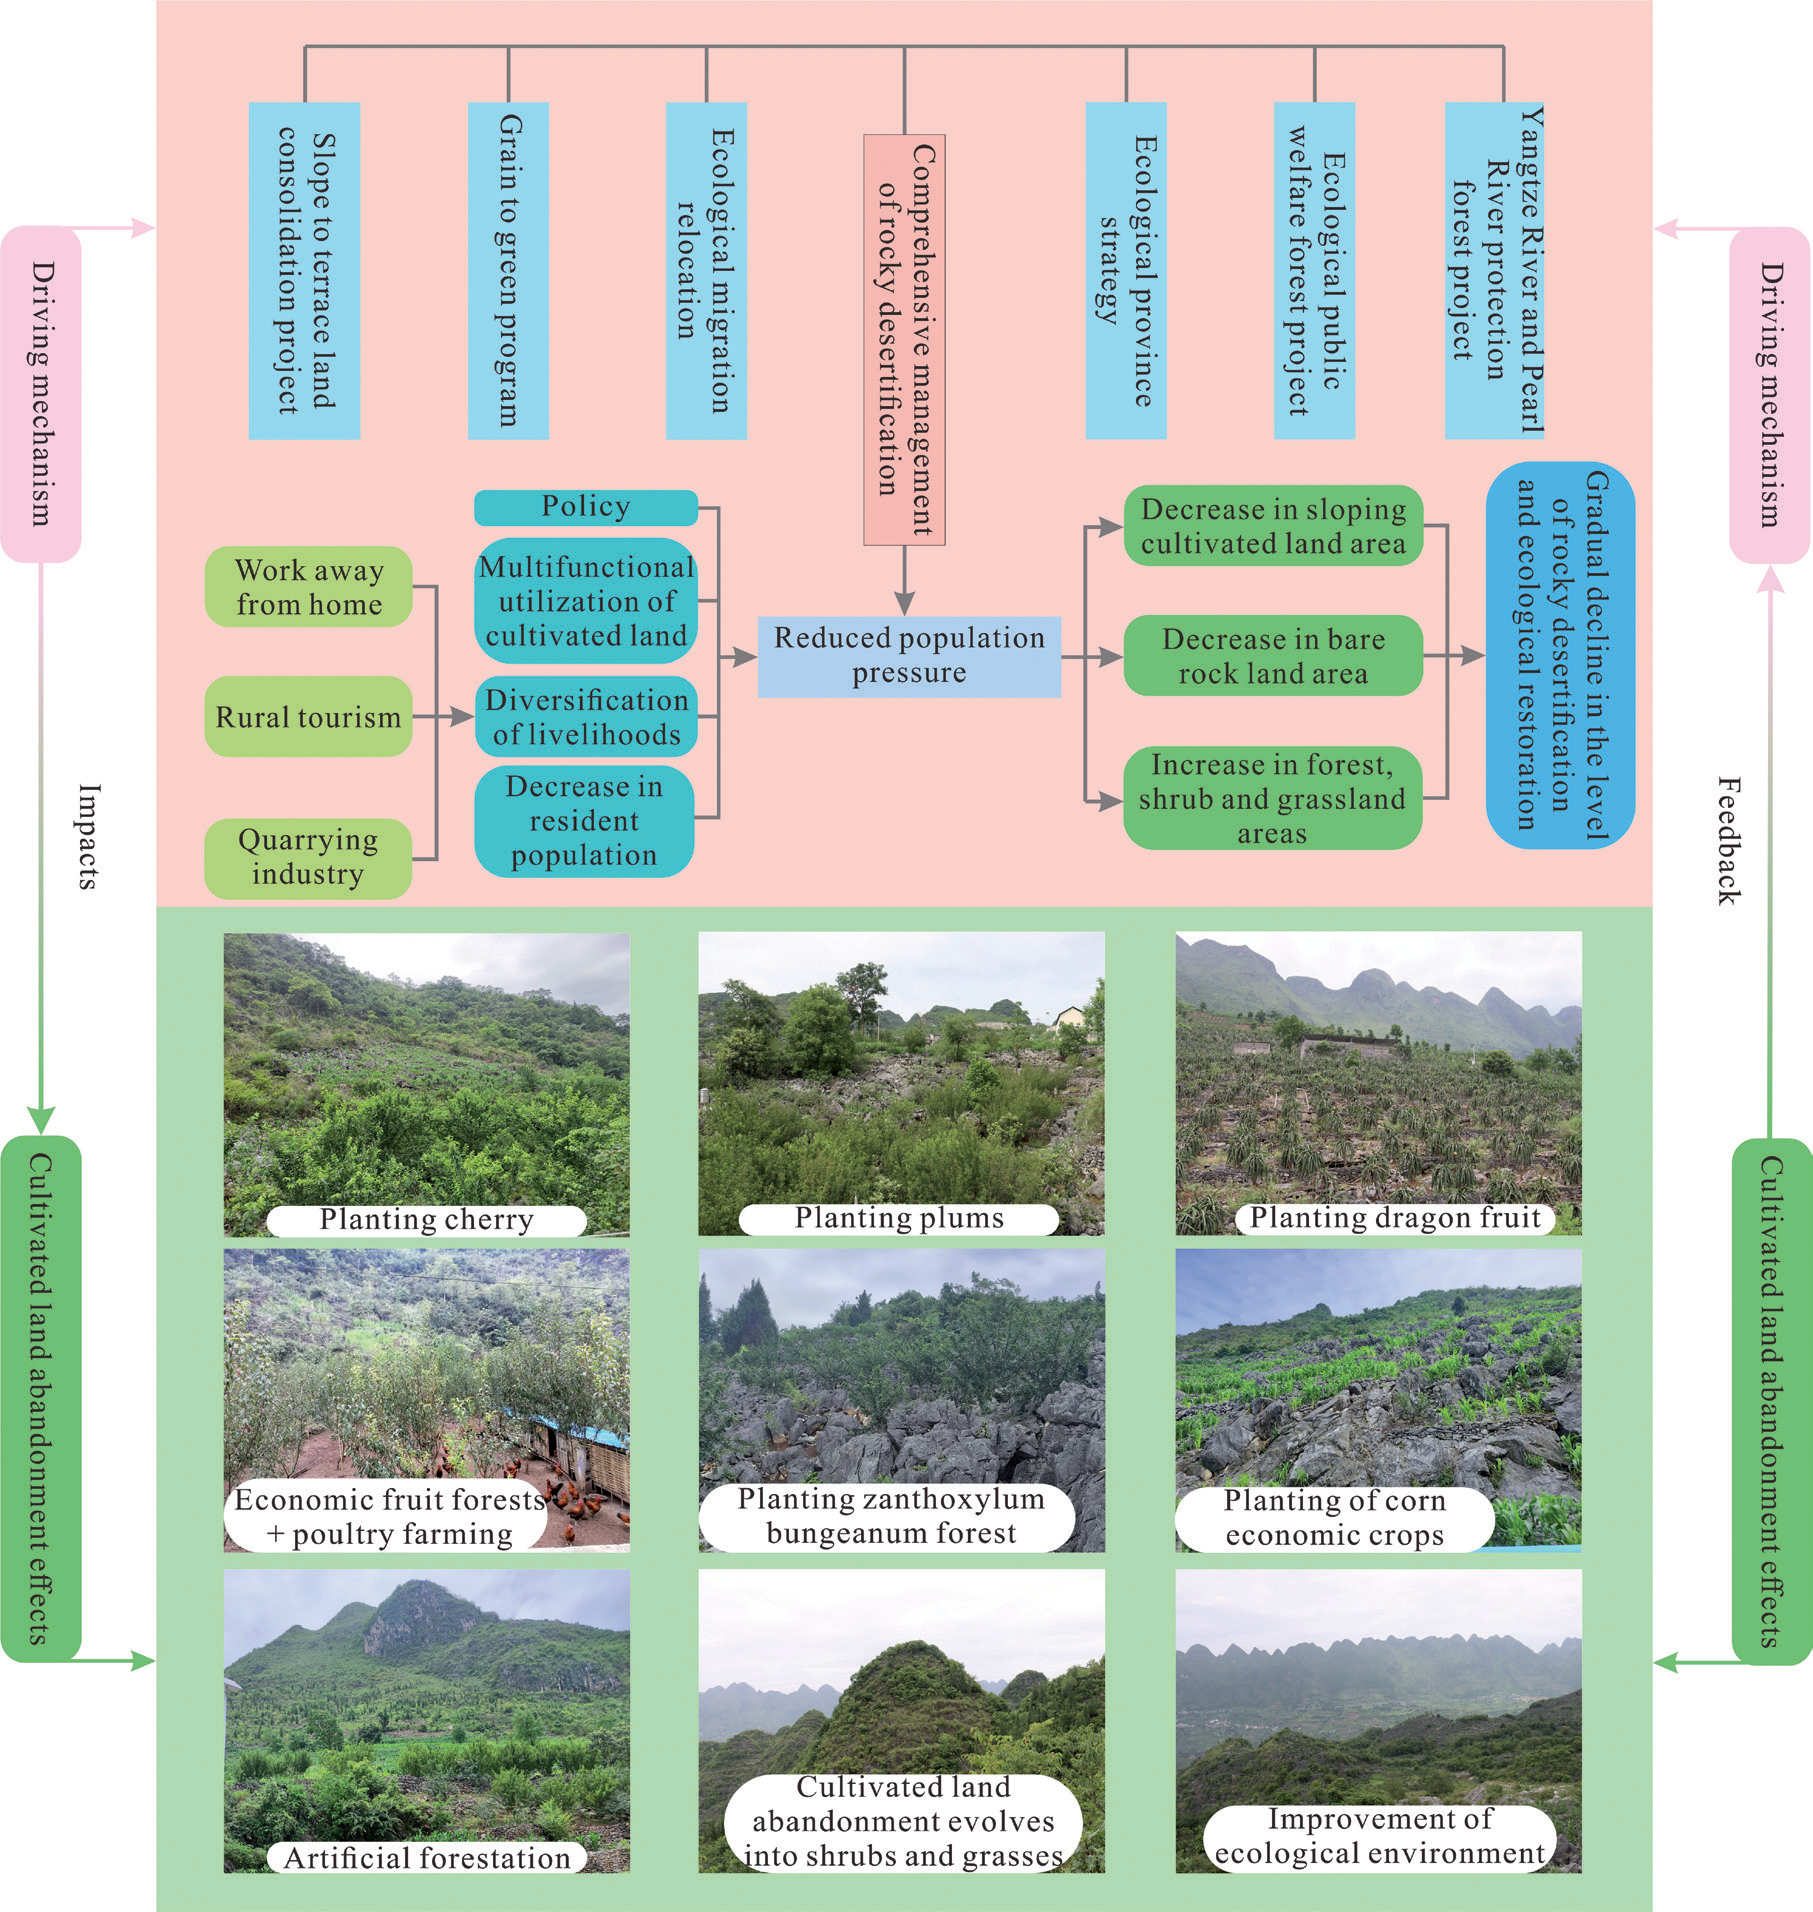
The abandonment of SCL is a complex and non-linear phenomenon that occurs widely across the globe, and the factors affecting the abandonment of SCL vary from region to region. As shown in this study, for Asian countries, the abandonment of SCL is closely related to factors such as rural population, farming distance, location, and socio-economic and political factors [44]. Meanwhile, the drivers of SCL abandonment in Nepal’s mountainous areas are similar to the present study area, with biophysical drivers (distance from settlements to SCL, slope, etc.) and socio-demographic factors being the leading causes of SCL abandonment [45]. Furthermore, the abandonment of SCL in different regions can have different effects on local biodiversity, the environment, and society [46], but in general, it can have a positive impact on the ecosystem. For example, in Switzerland, the regrowth of natural forests has achieved significant ecological benefits because of the abandonment of most of the shallow-soil, steep-slope SCL by part-time farmers [47], and similarly, the abandonment of SCL in KMAs has inhibited the expansion of rocky desertification and achieved significant ecological and environmental benefits. Therefore, this study has a certain degree of universality and regional uniqueness for the abandonment of SCL in mountainous areas around the world, and the study results can provide a reference for the abandonment of similar mountainous SCL around the world.
Inspiration and Significance of SCL Abandonment in Kmas
The fragile ecological environment of the KMA in southwest China is highly likely to be prone to severe ecological and geologic disasters. The government uses various ecological restoration policies, such as returning farmland to forests, comprehensive management of rocky desertification, and implementation of ecological red line protection, to restore the region’s ecological environment, thereby promoting land marginalization and abandonment of low-quality SCL. The current environmental construction and protection project in the KMA of southwest China is not simply pursuing an increase in the rate of forest and grassland coverage; more importantly, the government has formulated ecological restoration policies and measures for the KMA with full consideration of the matching of vegetation types and planting densities with the local natural conditions to ensure that they are adapted to the natural environment. For example, by planting zanthoxylum bungeanum forests suitable for the regional environment, the HC promotes ecological restoration and brings significant economic effects to the local area. The abandonment of SCL is restored to forests, shrubs, and grasslands, preventing rocky desertification at the source [48, 49]. The evolution of land use structure in the study area is consistent with the broader context of ecological improvement in the KMAs of Southwest China and the trend of China’s greening development [50, 51], and it is a good validation case for the results of the large-scale study. However, in the long term, the current government might formulate policies to strengthen the management of quarries in KMA. Although quarries have brought great economic benefits to local farmers, blind expansion will cause serious damage to the karst ecological environment.
Changes in the land use structure of the study area reflect the land use transition in KMAs, especially the phenomenon of abandonment of SCL in KMAs, to which academics should pay attention. Correctly recognizing the abandonment of SCL in mountainous areas is the basis for scientific management, and paying attention to the interrelationships between the various influencing factors will contribute to the formulation of scientific management strategies and ecological restoration models, and promote the tradeoff and coordination of the various environmental benefits. Future research should consider national strategies, ecological security patterns, and the current food security situation to dialectically view the impacts of the abandonment of SCL, which will help formulate appropriate coping strategies based on scientific assessments. In addition, it is necessary to carry out accurate surveys on the abandonment of SCL on a global scale to clarify the utilization of SCL to help optimize the allocation of farmland resources and guarantee national food security. By combining remote sensing interpretation and field survey results, our study accurately identifies and analyzes the distribution, evolutionary patterns, driving mechanisms, and effects of SCL abandonment in KMAs at the micro-scale, which is of scientific guidance to the direction of land remediation and agricultural development in mountainous regions of China and similar mountainous regions around the world.
Conclusions
This paper accurately identifies the ACL in the study area based on high-resolution remote sensing image data and field surveys of farmers and conducts in-depth research on the abandonment of SCL in the micro space of KMAs in southwest China. The results of the study are as follows:
(1) From 2004 to 2020, the abandonment of SCL in KMAs in Southwest China showed a continuous growth trend, and the landscape pattern indices of PD, CA, LPI, PD, and LSI of the ACL continued to grow while the AI first increased and then decreased, which indicated that the landscape of the ACL was fragmented and the shape of the patches was irregular. The abandonment of SCL mainly occurred in the southwestern and southern karst peak clusters and trough valley areas, as well as in areas with rugged terrain and high elevation.
(2) The abandonment of SCL has various characteristics in different slopes and elevation ranges; from 2004 to 2015, the ACL was mainly distributed in the elevation range between 1163m and 1346m, and from 2015 to 2020, it mainly occurred in the elevation range between 1024m and 1163m, and on the whole, the higher the elevation of SCL, the more significant abandonment is, and the more obvious is the change of the ACL. The abandonment of SCL mainly occurs in areas with slopes above 15°, and the steeper the slope, the greater the likelihood of abandonment of SCL. From 2004 to 2020, the abandonment of SCL will mainly evolve towards low-covered grassland, shrub forests, and Zanthoxylum bungeanum forests.
(3) In the relationship between the abandonment of SCL and rural settlements and roads, the farther the distance from settlements, the more pronounced the abandonment of SCL, and the first to be abandoned are SCL in areas farther away from the settlements. Within the buffer zone at different distances from the road, the ACL shows a fluctuating distribution, and the SCL around the road is reclaimed and planted with economically efficient fruit forest crops after abandonment; from 100m to 250m away from the road is the main food cultivation area, and the SCL at distances greater than 250m is easy to be abandoned.
(4) The abandonment of SCL in KMAs is the result of the interaction between natural and socio-economic factors; ecological restoration policy is the main factor for the abandonment of SCL in KMAs in Southwest China; and planting of special economic fruit forests has brought ecological and economic win-win benefits to the KMAs, which has contributed to the improvement of the ecological environment and the upgrading of the level of economic development in KMAs. The evolution of SCL abandonment in the study area provides evidence for the greening of China and the world from a microscopic perspective.

