

Introduction
China has transitioned into a phase of mass tourism development, characterized by national consumption as its primary component. The tourism industry has evolved into a pivotal sector, functioning as a vital source of livelihood and a key driver of high-quality development in both the national and regional economies. Given the inherent environmental dependencies and resource consumption associated with the industry, there is an escalating need for a nuanced understanding of the regional environmental system. This demand becomes particularly pronounced amid the complexities of the international landscape, the frequent occurrence of extreme natural disasters, the repercussions of public health emergencies, and various other uncertainties and disturbances. In this context, the integrity and stability of components within the tourism environmental system, along with their capacity to sustain tourism development activities, emerge as critical benchmarks for assessing the level of sustainable development in the regional tourism industry.
As a physical term [1], resilience is a key attribute that characterizes the ability of the system to recover from the impact of impact disturbance to the equilibrium state before impact [2]. In the 1973s, Holling introduced resilience into ecological research [3]. In recent years, resilience has been widely used in regional economy [4, 5], urban construction [6, 7], industrial systems [8, 9] and other research fields. The main research contents include the introduction and dynamic progress of the concept of resilience [10-13], the measurement of regional economic resilience [14, 15], the analysis framework of resilient cities [16-18], and the evaluation of industrial system resilience [19-21]. As an objective carrier supporting the development of tourism industry, regional environmental system provides indispensable space, factors, conditions and energy supply for tourism development activities. The inherent characteristics of the tourism environmental system, such as comprehensive complexity, vulnerability, high risk and uncertainty, are becoming increasingly prominent, posing a major threat to the growth of the regional tourism industry and the sustainable development of tourism destinations. Therefore, with the continuous expansion of resilience theory exploration and application fields, it is particularly necessary to carry out resilience assessment and analysis of influencing factors of the tourism environmental system.
As an important topic in the study of the “man-land relationship” in tourism destinations, the tourism environmental system, has long been a concern for many disciplines, such as geography, tourism and ecology. Academic research on the tourism environmental system mainly focuses on analyzing its basic connotation [22], exploring the structural elements [23]. There are also some themes that depict the interaction between the regional environmental system and tourism development activities, such as tourism environmental carrying capacity [24], tourism environmental impact [25, 26], and tourism environmental ethics [27-29]. The research scale involves the province, city, scenic area with relatively rich results and so on. However, the academic community has not paid enough attention to the research of the tourism environmental system from the perspective of resilience. There is a notable absence of assessments pertaining to the resilience of the tourism environmental system, particularly in terms of fundamental dimensions such as the social environment, economic environment, ecological environment, and facility environment. As a distinctive spatial unit, the tourism environmental system within a drainage basin exhibits salient features characterized by both cohesion and divergence, openness and interdependence, as well as structural complexity and dissipation. Furthermore, the intricate and complex interplay among factors such as “economy-society-culture-ecology-resource-environment” within the drainage basin underscores the urgency and necessity of investigating the resilience of this specific type of tourist destination. Despite these compelling characteristics, the scholarly community has not accorded adequate attention to this research domain, leading to a noticeable lag in empirical research pertaining to the amalgamation of resilience theory and the tourism environmental system.
The regional environmental system constitutes the foundational premise for the development of tourism. Enhancing the environmental system’s capacity to withstand external pressures from multiple stakeholders, sustaining robust system resilience, and addressing the equilibrium between the supply of tourism environmental resources and the demand generated by tourism development represent the indispensable path toward achieving the sustainable development of tourism destinations. This study, grounded in an analysis of the reciprocal relationship between tourism development activities and the environmental system, and drawing from various disciplines’ perspectives on resilience, defines “tourism environmental system resilience” as the comprehensive ability of diverse environmental subsystems within a tourism destination to withstand external disturbances, prevent deviation from the original developmental trajectory, and promptly recover or deviate from the original path through adaptation and transformation, thereby ensuring the normal functioning of the tourism destination.
This definition encapsulates the dynamic equilibrium between the demand for environmental factors stemming from tourism development activities and the system’s supply within the overarching framework of the “human-land relationship.” Building upon this conceptualization, the study employs “economy-society-ecology-facility” as the analytical dimension for the tourism environmental system. By constructing mathematical models and employing spatial analysis methods, the research delves into the spatio-temporal evolution characteristics and driving factors influencing the resilience of the tourism environmental system within the Yangtze River Economic Belt. The aim is to deepen our understanding of the intricate relationship between the regional environmental system and tourism development activities, scientifically regulate the adaptability of the regional environmental system to the pressures of tourism growth, and effectively address the demand-induced stress on the environmental system.
This study aspires to offer valuable insights for identifying sources of external disturbance, facilitating the shift of the environmental system from a defensive stance to a more resilient posture, and constructing a security framework for the environmental system of tourist destinations.
Materials and Methods
Research Materials
Construction of Index System
Grounded in a nuanced comprehension of the nuanced resilience inherent in the tourism environmental system, this study decomposes this resilience into four distinct dimensions: tourism economic environmental resilience, tourism social environmental resilience, tourism ecological environmental resilience, and tourism facility environmental resilience. Subsequently, a comprehensive set of 24 indicators is meticulously selected based on these four dimensions (Table 1). The economic environment subsystem, serving as the macroscopic foundation for the progression of tourism activities, plays a pivotal role. Its resilience level serves as a barometer, reflecting the regional capacity to support the sustained development of tourism destinations by encompassing factors such as economic vitality, financial backing, industrial structure, and income levels. The social environment subsystem represents the social carrying capacity of tourism development, which is closely related to tourism congestion, employment level, education technology, consumer demand and so on. High social resilience enables the tourism industry to properly cope with the impact of external social environment changes. The ecological environment subsystem delineates the reliance of tourism activities on local natural geographic elements such as water, atmosphere, forests, and vegetation. This subsystem serves as a spatial carrier and environmental foundation for tourism activities. On the other hand, the facility environment subsystem stands as the critical infrastructure ensuring the regular operation of tourism activities. The resilience level of this subsystem reflects the capacity of regional hardware facilities to withstand losses and promptly recover when confronted with external disturbances.
Research Areas and Data Sources
The Yangtze River Economic Belt, encompassing the eastern, central, and western economic units of China, stands out for its exceptional geographical advantages and developmental potential, holding a crucial position in the overall progress of the nation. With distinctive conditions conducive to tourism development, it serves as a significant tourist destination and a substantial source market within China. Boasting profound cultural heritage, abundant tourist resources, and a sizable population distribution, the Yangtze River Economic Belt welcomed 4.929 billion domestic and international tourists in 2017, generating a substantial tourism revenue of 5.06 trillion CNY. This accounted for 44.21 percent of the country’s total tourism revenue. However, beneath the surface of this tourism prosperity lie significant environmental security challenges. The drainage basin grapples with imbalances in social and economic development, a fragile ecological environmental carrying capacity, and deficiencies in public infrastructure. These factors pose considerable constraints on the sustainable development of the tourism industry within the basin, presenting severe challenges to the habitat conditions of the regional tourism sector.
Therefore, by taking the Yangtze River Economic Belt as a case study, delving into the resilience of the tourism industry’s environmental system holds pronounced regional significance. This endeavor not only proves instrumental in enhancing the sustainable development capacity of the tourism industry, optimizing the relationship between tourism and the environment, formulating judicious tourism development policies, and advancing the establishment of a golden tourism belt, but also bears considerable reference value for analogous regions both domestically and internationally.
This research spans the period from 2006 to 2017 and encompasses 11 provinces and municipalities along the Yangtze River Economic Belt. Data sources are detailed in Table 1, with supplementary information primarily sourced from the statistical bulletins of national economic and social development for the relevant provinces and municipalities, as well as the official websites of their culture and tourism departments. All monetary units in the data are adjusted for inflation based on constant price levels in 2006. The processing and quantitative analysis of the data were conducted using Origin and ArcGIS software.
Table 1.
Resilience evaluation index systems of the tourism environmental system.
Research Models
The Entropy Weight Model
Entropy weight model is an objective valuation method, which can objectively and systematically reflect the effective value of index information entropy, and is suitable for comprehensive evaluation of multiple index systems, and the calculation process is as follows:
(1) Data standardization processing:
If the evaluation index is a positive index:
If the evaluation index is a negative index:
(2) Calculate the weight of the index value:
(3) Calculate information entropy of the jth indicator:
(4) Calculate the utility value of information of the jth indicator:
(5) Calculate weight of the jth indicator:
(6) Calculate the resilience index of tourism environmental system
The Spatial Autocorrelation Model
The spatial autocorrelation model was used to explore the spatial pattern characteristics of the resilience of the tourism environmental system in Yangtze River Economic Belt. Among them, the global spatial autocorrelation analysis could test the spatial association pattern of the whole study region, that is whether neighboring regions were similar, different or independent, and the local spatial autocorrelation analysis could study the spatial agglomeration or isolation of local regions, examine local aggregation features of similar or dissimilar observations. The model expression is as follows:
m n
∑∑ wij (xi − x x)( j − x̄)
Moran'Iglobal = i=1 j=1 m n
In the formula (8) and (9), xi and xi represent the resilience index of tourism environmental system in regions i and j, respectively. x̅ and S2 represent the average and variance of the resilience index of tourism environmental system, wij is the spatial weight matrix, The geographical distance spatial weight matrix is used in this paper, which is usually calculated by the reciprocal of the square of the actual geographical distance between the two regions, that is wij = 1/dij2(i≠j). dij is represented by the direct distance between the two provincial (municipal) capitals.
The Geodetector Method
Geodetector is a new statistical method to detect spatial heterogeneity and explain the driving factors behind it. It was initially applied to the study of endemic disease risk and related geographical influencing factors, and then widely used in social and economic fields such as urbanization and economic growth[43-45]. In this paper, the Geodetector model is used to detect the determination power of various factors on the evolution of tourism environmental system resilience. The calculation formula is as follows:
In the above formula, q is the determination power of the influencing factors, q∈[0,1]. The closer the value of q is to 1, the stronger the determination power of the factor to the resilience of the tourism environmental system.
Results and Discussion
Results of the Spatio-Temporal Evolution Characteristics of Tourism Destination Environmental System Resilience
Results of the Temporal Evolution Characteristics
Through the application of the entropy weight model, this study derives the resilience values for both the comprehensive tourism environmental system and its individual subsystems across the Yangtze River Economic Belt from 2006 to 2017. As depicted in Fig. 1, the overall trajectory of the resilience of the comprehensive tourism environmental system exhibits an ascending pattern. The resilience index surged from 0.172 in 2006 to 0.342 in 2017, demonstrating an average annual growth rate of 8.99%. This trend signifies that since the “11th Five-Year Plan,” coinciding with China’s entry into a phase of rapid social and economic expansion, the strategic emphasis on “ecological priority” and the sustained augmentation of regional infrastructure investments have collectively contributed to a gradual amelioration of the external conditions for tourism development. Consequently, the supporting capabilities of regional economic, social, ecological, and facility environmental systems for the tourism industry have markedly strengthened. The strategic standing of tourism as a cornerstone of the national economy has solidified, accompanied by an escalating ability of tourism development activities to withstand external risks.
Fig. 1.
Temporal evolution of tourism environmental system resilience in Yangtze River Economic Belt from 2006 to 2017.
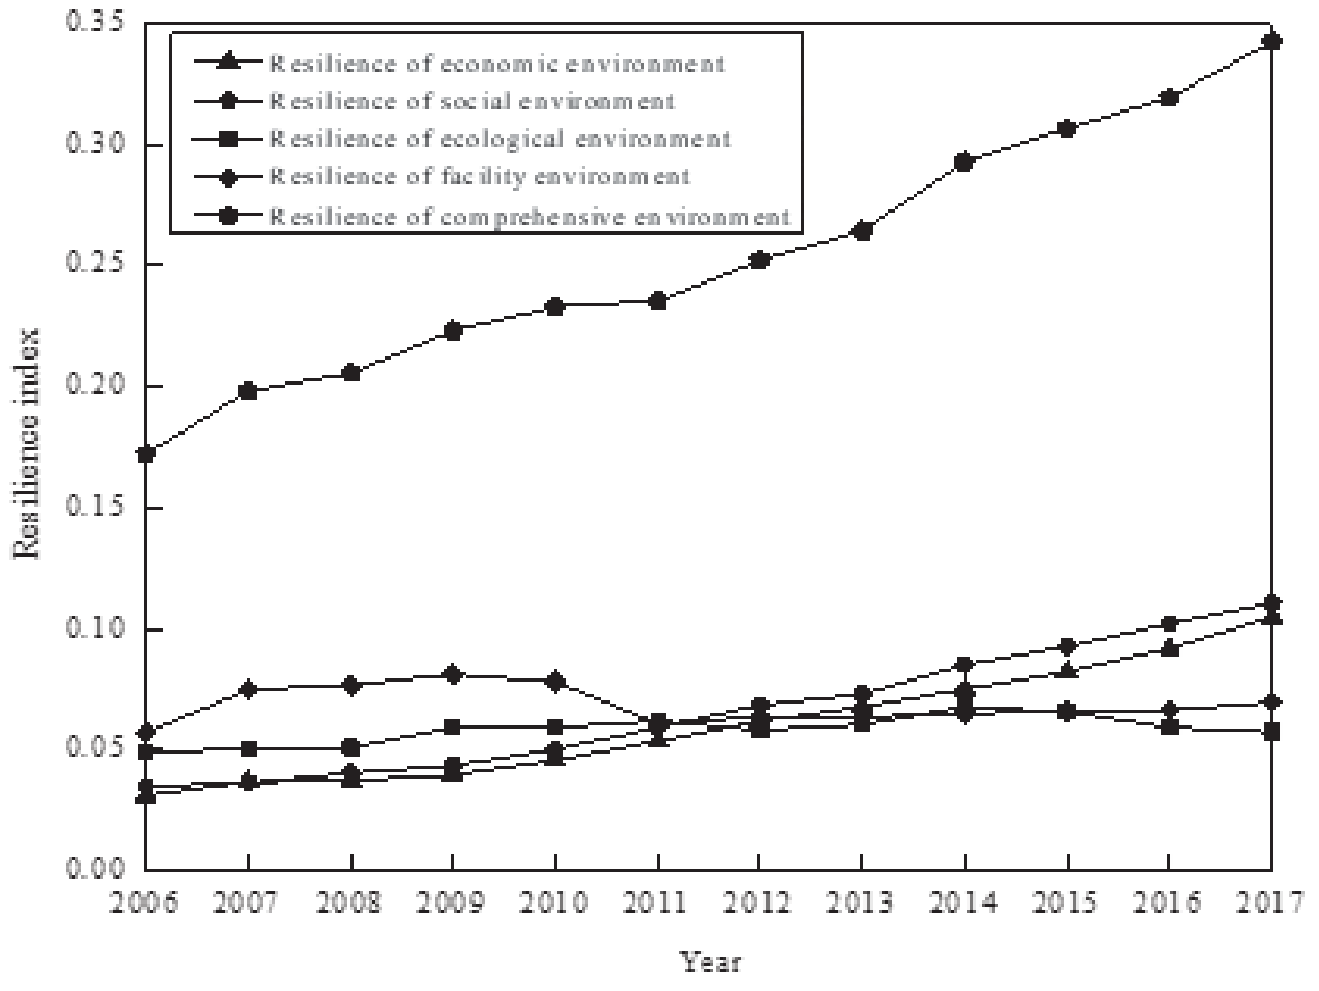
However, the robustness of the resilience growth within the tourism environmental system remains relatively modest. Notably, the growth rate of the resilience index during the periods 2008 to 2013 and 2015 to 2017 is conspicuously lower than the average value observed throughout the entire study duration. This discrepancy suggests that, despite the positive momentum generated by China’s socio-economic growth shift, structural adjustments, and strategic policy adaptations, environmental risks in the context of regional tourism development persist. The study underscores the need to further optimize the symbiotic relationship between the rapid expansion of the tourism industry and the socio-economic, resource, and environmental aspects of the regional landscape, emphasizing the imperative for enhanced alignment between supply and demand.
Examining the resilience evolution of each subsystem, it is evident that the environmental resilience of the four subsystems exhibits a positive correlation with the overall resilience of the tourism environmental system. This correlation underscores that the collective enhancement of the tourism environmental system’s resilience is a consequence of the synergistic impact of the resilience exhibited by its constituent subsystems. In terms of resilience growth rate, the most rapid increase observed from 2006 to 2017 pertained to the resilience of the economic environment, experiencing a surge of 2.3 times. This underscores the pivotal role played by the macro-economic environment in steering tourism development within the drainage basin. The second-fastest growth rate was observed in the resilience of the social environment, increasing by 2.1 times, approximately on par with the growth rate of economic environment resilience. Fueled by rapid economic development, the concentration of social wealth in the drainage basin was pronounced, resulting in a substantial enhancement of the social carrying capacity for tourism development.
In contrast, the growth rates of ecological environment and facility environment resilience were comparatively slower, ascending by 17.12% and 21.86%, respectively, from 2006 to 2017. This indicates that, despite the highly developed social economy, the ecological environment and infrastructure of the drainage basin persist as critical weaknesses limiting the growth of the tourism industry. A discernible decoupling between regional social-economic development and the endeavors in ecological environmental protection and infrastructure construction has imposed constraints on the comprehensive enhancement of the resilience of the tourism environmental system in the drainage basin. The construction of a regional “ecological civilization” and investment in infrastructure continue to face substantial challenges.
Considering the ranking relationship of the resilience index for each subsystem, a shift in the order pattern is apparent. From 2006 to 2010, the pattern was roughly “facility environment>ecological environment >social environment>economic environment,” gradually adjusting to “social environment >economic environment>facility environment>ecological environment” from 2012 to 2017. This transition suggests the formation of two convergence clubs: the “social-economic” combined system and the “facilities-ecological” combined system. It implies that despite the continual elevation of the economic and social development levels in the Yangtze River Economic Belt, there remains a lag in the resilience growth of the ecological and facility environmental systems. In the new era, under the strategic imperatives of “ecological priority and green development” and “infrastructure sharing and joint construction,” there is substantial room for optimization and improvement in the resilience of the tourism environmental system within the Yangtze River Economic Belt.
Spatial Differentiation Characteristics
The Natural Breaks method was employed to partition the resilience index data for the years 2006, 2011, and 2017 into five categories, elucidating the spatial differentiation patterns and trends in the resilience of the tourism environmental system within the Yangtze River Economic Belt. Overall, the resilience across this region exhibited pronounced spatial heterogeneity. Specifically, the resilience index in the Yangtze River Delta, comprising Shanghai, Jiangsu, and Zhejiang, displayed a notably higher level and consistently led in spatial clustering trends. In contrast, the central and western regions, including Guizhou, Chongqing, and Jiangxi, exhibited relatively lower resilience indices. The provincial (municipal) distribution of resilience grades demonstrated evident spatio-temporal transition characteristics.
As depicted in Table 2, areas classified as high and sub-high resilience were predominantly concentrated in three provinces (municipalities) such as Shanghai, Jiangsu, and Zhejiang in 2006. This underscored the supportive role of well-developed social-economic foundations, coupled with robust facilities and ecological conditions, in fostering regional tourism development. These areas exhibited a relatively high carrying capacity for the tourism environmental system, along with an enhanced ability to contend with external risks. Conversely, low and sub-low resilience areas were mainly situated in central and western regions such as Guizhou, Yunnan, Chongqing, Jiangxi, and Anhui in 2006. In these regions, the levels of economic-social development and infrastructure construction notably lagged behind those of the more developed eastern regions. The vulnerability and sensitivity of the ecological environment were pronounced, resulting in generally lower resilience of the tourism environmental system.
By 2011, there was a discernible adjustment in the distribution of resilience grades. The number of provinces (municipalities) with low and sub-low resilience grades significantly decreased, transforming gradually into medium or sub-high grades. Yunnan transitioned to the medium resilience category, while Sichuan, Hubei, Hunan, and Anhui ascended to the sub-high grade. Other provinces (municipalities) exhibited no significant change. In 2017, although there was no substantial alteration in the regions classified as low and sub-low or high resilience, the number of provinces (municipalities) with low resilience grades decreased, transforming into medium-grade resilience, particularly exemplified by Hubei, Hunan, and Anhui. This suggests that the central region, constrained by socio-economic conditions, infrastructure constraints, and the natural ecological environment, still contends with considerable instability in the resilience of the tourism environmental system. The environmental foundation of tourism industry operations remains precarious, and the sustainable development of the regional tourism industry confronts formidable environmental risks and challenges.
Table 2.
Spatial evolution of tourism environmental system resilience.
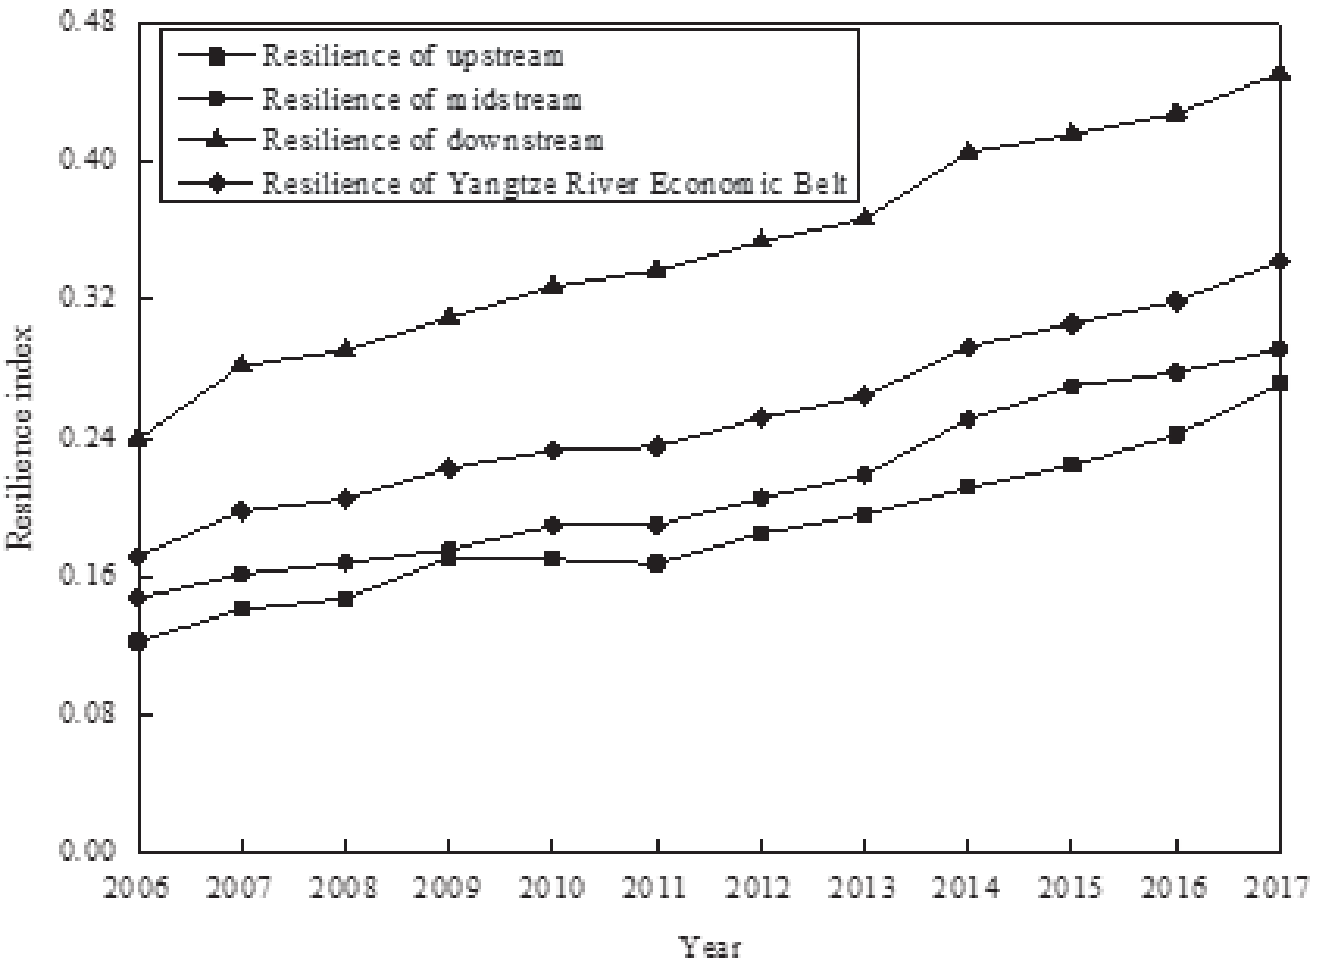
From the perspective of the comparison of the three drainage basin units such as upstream, midstream and downstream, the spatial differentiation of the resilience of the tourism environmental system in Yangtze River Economic Belt is distinct. Fig. 2 showed that the resilience index of the three drainage basin units all showed an upward trend from 2006 to 2017, and the overall sequence pattern was “upstream<midstream <downstream”. The findings revealed a discernible gradient decay pattern in the resilience of the tourism environmental system along the Yangtze River Economic Belt, exhibiting a stepwise decrease from coastal to inland regions. Specifically, the resilience index of the downstream region consistently surpassed the overall average value of the entire drainage basin. In contrast, both the midstream and upstream regions exhibited resilience indices lower than the basin-wide average. The resilience of the tourism environmental system along the Yangtze River Economic Belt presented a strong drainage basin differentiation, and the quality distribution of “society-economy-facility-ecology” environment carrier on which the tourism industry depended had significant spatial disequilibrium. The eastern coastal areas exhibited superior environmental foundations and robust capacities to support tourism development. In contrast, the central and western regions faced relatively limited resources and environmental conditions, posing constraints on the scope of tourism development activities. This contrast highlighted a pronounced contradiction between the expansive growth of the tourism industry and the environmental carrying capacity in these regions.
Spatial Agglomeration Characteristics
The global spatial autocorrelation model was used to analyze the spatial agglomeration characteristics of the resilience of the tourism environmental system in Yangtze River Economic Belt. As Shown in Table 3, the Moran'Iglobal were consistently positive from 2006 to 2017, the Z scores were all greater than 1.96, and passed the significance test at 1% and 5% levels. The results showed that the resilience of the tourism environmental system in Yangtze River Economic Belt presented a spatial positive correlation and had a significant spatial agglomeration effect, and the regions with higher or lower resilience tended to be concentrated and adjacent to each other in geographical space. In addition, the Moran'Iglobal showed an upward trend of “oscillating ups and downs”, indicating that the overall agglomeration intensity was continuously improving, and also reflecting the increasing spatial correlation of inter-regional tourism industry development with the promotion of national strategies such as high-quality development of the Yangtze River Delta, construction of urban agglomeration in the midstream of the Yangtze River, and integrated development of the Yangtze River Economic Belt. The spatial integrity and interdependence of the tourism environmental system had been strengthened.
Fig. 2.
Spatial evolution of tourism environmental system resilience in different drainage basin units of Yangtze River.
On the basis of the above, the local spatial autocorrelation model was further used to describe and analyze the similarity degree of provincial (municipal) resilience level agglomeration of the tourism environmental system. As per the local spatial autocorrelation model, the geographical space can be subdivided into four quadrants. The first quadrant designates the “High-High” cluster area, wherein the resilience index of the province (municipality) and its adjacent provinces (municipalities) is comparatively high, indicating a notable spatial correlation characterized by a high-level cluster.
The second quadrant represents the “Low-High” cluster area, indicating that the resilience index of the province (municipality) itself is comparatively low, while the resilience index of its neighboring province (municipality) is relatively high. This quadrant illustrates a spatial correlation marked by a transition from low to high resilience. The third quadrant characterizes the “Low-Low” cluster area, signifying that both the resilience index of the province (municipality) itself and those of its neighboring provinces (municipalities) are relatively low. This quadrant denotes a spatial correlation characterized by a low-level cluster. The fourth quadrant identifies the “High-Low” cluster area, wherein the resilience index of the province (municipality) itself is relatively high, while the resilience index of its neighboring province (municipality) is comparatively low. This quadrant displays a spatial correlation demonstrating a polarization pattern of high resilience in the middle and low resilience in the periphery.
As indicated in Table 4, during the years 2006, 2011, and 2017, the local spatial agglomeration of the tourism environmental system in the Yangtze River Economic Belt was predominantly concentrated in the “High-High” agglomeration area and the “Low-Low” agglomeration area. These two categories of distribution among provinces (municipalities) collectively accounted for approximately 81.8%. The “High-High” agglomeration area was distributed in the coastal developed provinces (municipalities) of Shanghai, Jiangsu and Zhejiang, while “low-low” agglomeration area was distributed in central and western provinces(municipalities) such as Hubei, Hunan, Chongqing, Guizhou, Yunnan, Sichuan. It reflected the “polarization” tendency of the resilience of the tourism environmental system in Yangtze River Economic Belt, which showed higher or lower levels of similar agglomeration. Meanwhile, the spatial and temporal transition of the resilience spatial agglomeration type in each province (municipality) during the study period was not significant, indicating that the resilience spatial agglomeration pattern of the tourism environmental system had strong stability and was in a “spatial-locked” state.
Table 3.
Moran'Iglobal of tourism industry environmental system resilience.
Table 4.
Local spatial agglomeration type of tourism environmental system resilience.
From the perspective of the agglomeration situation, the spatial agglomeration of tourism environmental system resilience between the upstream-midstream and downstream presented a strong “Matthew effect”. In general, three spatial agglomerations are formed, namely the Yangtze River Delta region with Shanghai, Jiangsu and Zhejiang as constituent units, the ring Yangtze River Delta region with Anhui and Jiangxi as constituent units, and the upstream-midstream of the Yangtze River region with Hubei, Hunan, Chongqing, Guizhou, Yunnan and Sichuan as constituent units. Additionally, the findings indicated that the resilience level of the tourism environmental system in the eastern coastal areas exhibited a relatively modest radiation driving effect on the central and western regions. The spatial spillover effect of inter-regional tourism development activities was not notably robust. There is a necessity for further development of the spatial coordination pattern, emphasizing “social and economic sharing, infrastructure construction, and ecological environment co-governance” within the Yangtze River Economic Belt. Enhancing the overall coordination level of the tourism environmental system is imperative for sustainable development.
Results of the Driving Factors of Tourism Destination Environmental System Resilience Evolution
In order to further identify the factors affecting the evolution of tourism environmental system resilience in Yangtze River Economic Belt, the Geodetector model was used to detect 24 index factors, and the q value of different index factors was compared to reveal the difference in the effect strength of each factor on the resilience of tourism environmental system. Due to the large number of indicator factors, based on the ranking relationship of the q value of the determining power, this study took the indicator factors with the top 30% of the determining power as the main driving factors (eight in total) to analyze the evolution of the tourism environmental resilience in the drainage basin.
The driving factors of the resilience evolution of the tourism environmental system in Yangtze River Economic Belt from 2006 to 2017 showed significant temporal succession. In 2006, the rank order of the eight main index factors and their determining power was “X11>X3> X1>X16>X5>X23>X19>X8”, and from the average value of the determining power of the environmental subsystems to which different index factors belong, the performance was “ecological environment>economic environment>social environment>facility environment”. It reflected that the ecological environment quality of this period was of great significance to the resilience of the tourism environmental system, and the ecological environment of the drainage basin played a prominent role in carrying the natural base of tourism development, and this period belonged to the “ecologically oriented“. In 2011, the rank order of the eight major index factors and their determining power was adjusted as “X2>X16>X9>X22>X1>X17>X19>X18”, and the average value of the determining power of each environmental subsystem was displayed as “economic environment>ecological environment>social environment>facility environment”, indicating that as time went by, the effect of economic environment on the resilience of the tourism environmental system was constantly increasing. A good economic foundation was an important support for the sustainable development of the tourism industry, and this period belonged to the “economically oriented“. In 2017, the rank order of the eight major index factors and their determining power was adjusted to “X12>X5>X23>X19>X9>X22>X3>X2”, and the rank order of the average determining forces of each environmental subsystem was “social environment>economic environment>facility environment”. It reflected that the social environment had become an important factor affecting the resilience of the tourism environmental system of the Yangtze River Economic Belt in the new era. High social carrying capacity, good social and cultural atmosphere, and strong social consumption demand were the necessary prerequisites to support the sound operation of the regional tourism industry. During this period, the factors influencing the resilience of the tourism environmental system evolved into ”socially oriented”.
Table 5.
Driving factors of tourism environmental system resilience evolution.
Conclusions
This study focuses on the Yangtze River Economic Belt and establishes an evaluation framework for the resilience of the tourism environmental system based on the dimensions of “economy-socio-ecology-facilities.” Employing the entropy weight model, spatial autocorrelation model, and Geodetector model, the research aims to investigate the spatio-temporal evolution characteristics and driving factors of regional tourism environmental system resilience. The key conclusions are outlined below:
(1) Temporal Evolution of Resilience: The resilience of the tourism environmental system in the Yangtze River Economic Belt demonstrated an overall upward trend from 2006 to 2017, with the resilience index increasing from 0.172 to 0.342. However, the growth stability was relatively poor, indicating persistent environmental risks associated with tourism development in the drainage basin.
The growth rate of environmental resilience varied significantly among subsystems, following the sequence of “economic environment>social environment> facility environment>ecological environment.” Similar evolutionary patterns were observed for different subsystems, leading to the formation of two convergence clubs: “social-economy” and “facility-ecology.”
(2) Spatial Heterogeneity
The resilience level of the tourism environmental system in the Yangtze River Economic Belt displayed significant spatial heterogeneity. The Yangtze River Delta, represented by Shanghai, Jiangsu, and Zhejiang, exhibited a high leading and spatial cluster development trend. In contrast, the central and western regions, typified by Guizhou, Chongqing, and Jiangxi, showed relatively low resilience levels.
There was a notable spatio-temporal transition in the distribution of resilience grades among provinces (municipalities). The resilience levels in the upstream, midstream, and downstream regions all exhibited an upward trend, with a gradient attenuation pattern decreasing from coastal to inland.
(3) Spatial Correlation
Positive spatial correlation was observed in the resilience level of the tourism environmental system. Regions with similar resilience levels tended to concentrate, with an overall increase in agglomeration intensity.
Local spatial agglomeration mainly occurred in coastal “high-high” areas and “low-low” areas in the central and western regions. The spatial agglomeration of resilience levels between the upstream, midstream, and downstream demonstrated a strong “Matthew Effect.”
(4) Temporal Succession of Driving Factor
The driving factors influencing the resilience evolution of the tourism environmental system in the Yangtze River Economic Belt exhibited significant temporal succession. The determining forces of different index factors and their ordinal relationships underwent constant changes, with a succession law of “ecologically oriented → economically oriented → socially oriented.”
Despite the insightful findings, certain limitations exist. The complexity of factors influencing resilience and their interrelationships, coupled with the evolving understanding of resilience connotations, necessitates further refinement in terms of index selection, theoretical understanding, and mechanism analysis. Future research should strive for a more scientific and comprehensive resilience index system. Additionally, considering the limitations of data scale and statistical caliber, subsequent studies should explore the spatio-temporal evolution and driving factors of tourism environmental system resilience at micro-geographical units and over long-term time series for enhanced reference value in advancing the sustainability of the tourism industry in the Yangtze River Economic Belt.

