

Introduction
Since China’s reform and opening up in 1978, agriculture has advanced quickly and reached a new level of production capacity, ensuring both national stability and food security. China’s total grain production will expand by 1.24 times over 1978 to 682.8475 million tons in 2021, while the value of all agricultural output will rise by 69.1 times over 1978 to 783.951 billion yuan. However, the agricultural economy’s rapid expansion has resulted in a high consumption of chemicals like fertilizers, pesticides, agricultural films, and other chemicals, which has led to a decline in the quality of cultivated land [1], excessive agricultural carbon emissions (ACE) [2], agricultural non-point source pollution (ANSP) [3], and other issues. Additionally, excessive agricultural resource consumption, ecological environment damage, and other issues have also become more prominent, which seriously restricts the development level of China’s agriculture [4]. China is the top agricultural producer and emitter of carbon, and its ACE is significantly greater than the average for the world [2]. The “dual carbon” target, which calls for reaching carbon neutrality by 2060 and the carbon peak by 2030, presents a significant opportunity for China’s agricultural production to reduce carbon emissions [5]. Major plans were made for reducing carbon emissions in the planting and breeding industries in the “Implementation Plan for Carbon Emission Reduction and Sequestration in Agriculture and Rural Areas” released by the Ministry of Agriculture and Rural Affairs and the National Development and Reform Commission in 2022; at the same time, the report of the 20th National Congress will also raise the construction of agricultural power to an unprecedented height, which means the agricultural production mode needs to make qualitative changes. In recent years, Chongqing has released the 14th Five-Year Plan (FYP) for Promoting Agricultural and Rural Modernization (2021-2025) and the 14th FYP for Agricultural Ecological Environment Protection and Agricultural Waste Resource Utilization (2021-2025), which have given the development of Chongqing’s agricultural economy a new direction. Even though Chongqing has made enormous strides in the economic development of agriculture, agricultural environmental pollution is still a major concern today. Therefore, in light of the “dual carbon” target, boosting AEE is a viable option for agricultural green transformation and upgrading and a crucial means of achieving ACE reduction and controlling ANSP [6].
AEE is a specialized application of the theory of ecological efficiency within the agricultural domain. It investigates the correlation between agricultural inputs and outputs, emphasizing the need to minimize agricultural production inputs and ecological environment pollution in order to attain optimal output levels [7, 8]. Regarding the investigation of AEE, both local and international experts mostly concentrate on the following three dimensions: The primary focus of research on AEE measurement includes the utilization of many models, including the Analytic Hierarchy Process (AHP) [9], the integration of emergency and life cycle methods [10], and the super-efficiency SBM model [11, 12]. The second aspect of the study focuses on the examination of the spatiotemporal evolution characteristics of AEE. This investigation primarily employs analytical techniques such as kernel density estimation analysis [13], a spatial autocorrelation model [14, 15], and the building of a spatial Markov probability transfer matrix [16]. The third aspect pertains to the examination of the many components that exert influence on AEE. Certain scholars argue that various factors such as the per-capita net income of farmers, investment in agricultural fixed assets, educational attainment of labor, industrial structure, effective irrigation area, sown area per labor, planting structure, urbanization rate, and agricultural machinery density have the potential to either facilitate or impede the enhancement of agricultural efficiency [17, 18]. In contrast to prior investigations, this study makes three primary contributions. Firstly, in terms of research scope, this paper examines the AEE of Chongqing at the micro-county level, as opposed to the national [19-22], provincial [23-25], or regional level [26-28]. This approach offers a novel perspective for scholars to explore the matter of agricultural green development within a specific region in isolation. Secondly, in terms of the research concept, this paper integrates the “dual carbon” objective and incorporates the notion of low carbon in agriculture into the assessment framework of AEE. It also considers the ACE index, which is often overlooked, as an undesirable output in order to enhance the accuracy of the calculations. This approach is expected to facilitate the effective implementation of government policies and initiatives by providing more precise results for relevant stakeholders. Thirdly, in terms of research methods, this study employs the super-efficiency SBM-ESDA model as a research method to examine the AEE in district and county of Chongqing. The model is used to effectively differentiate and compare the evaluation units with an efficiency value of 1. Furthermore, it analyses the spatiotemporal dynamic evolution characteristics of Chongqing’s AEE and its influence on the surrounding regions. The findings of this study offer theoretical support for the subsequent agricultural transformation, upgrading, and development in Chongqing. Hence, this study focuses on 38 districts and counties in Chongqing from 2010 to 2021 as the designated research area. The study employs ACE and ANSP as undesirable outputs and utilizes the super-efficiency SBM-DEA model and ESDA to assess the AEE of each district and county in Chongqing. The analysis of the spatiotemporal dynamic evolution characteristics of AEE is beneficial for enhancing AEE, fostering agricultural green development, and holding significant implications for achieving the “double carbon” target [29, 30]. Simultaneously, it also elucidates the trajectory for agricultural development challenges in expeditiously progressing regions both domestically and internationally. The aims of this study are as follows: (1) The evaluation index system of AEE was established using the super-efficiency SBM-DEA model, and the AEE of each district and county in Chongqing was assessed. (2) The ESDA model was employed to analyze the spatial and temporal evolution patterns of AEE in each district and county of Chongqing. (3) By integrating the specific characteristics of each district and county in Chongqing and the spatiotemporal evolution patterns of AEE, this study proposes optimization recommendations to enhance AEE.
Materials and Methods
The Study Area
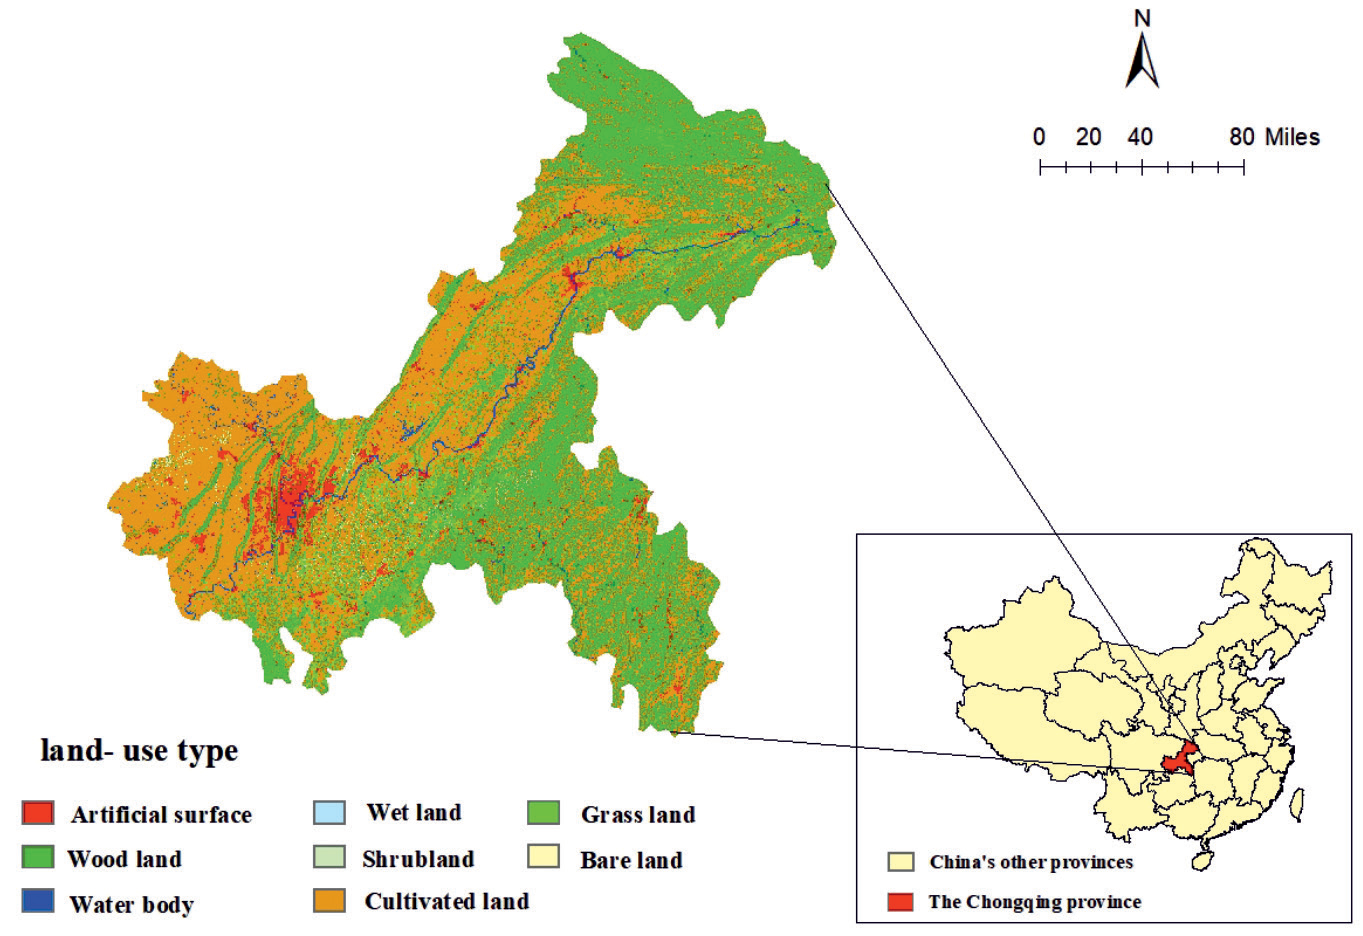
Chongqing, situated in the southwestern region of China (105°11’-110°11’E, 28°10’-32°13’ N), is recognized as one of the four municipalities directly administered by the Central Government of China. The urban area spans a total land area of 82,402 square kilometers, serving a significant function in facilitating the development of the western region. Furthermore, it holds a crucial position as a connecting hub between the “belt and road” initiative and the Yangtze River economic belt. The topography of the region exhibits a steady decline from the southern Yangtze River valley towards the north. In the northwest and central areas, the landscape is mostly characterized by hills and low mountainous features. Conversely, the southeastern region, particularly around the Daba and Wuling Mountain ranges, showcases a greater prevalence of sloping land. The terrain of the region exhibits higher elevations in the southeastern and northeastern areas, while lower elevations are observed in the central and western portions. The Chongqing region comprises a mountainous terrain covering approximately 76% of its total area, while hills account for approximately 22% of the region. The remaining 2% is occupied by a river valley. The climate in this region is characterized as a subtropical monsoon humid climate, exhibiting warm temperatures during winter and early spring, hot temperatures during summer, and cold temperatures during autumn. This climate pattern is further distinguished by the presence of four distinct seasons. The land use categories in Chongqing can be broadly classified into eight categories: artificial surface, woodland, water body, wetland, shrub land, cultivated land, grassland, and bare land. Among these, cultivated land mostly serves the purpose of agricultural production. Chongqing’s topography and climate pose challenges to its agricultural productivity, resulting in limited grain output and obstacles to large-scale agricultural operations inside the province. Nevertheless, several cash crops, such as potatoes, citrus, and rapeseed, hold a significant share of China’s agricultural landscape (Fig. 1).
Method Setting
Super-Efficiency SBM-DEA Model
Data Envelopment Analysis (DEA) is a non-parametric technique used for measuring efficiency. It primarily examines various input and output indicators, calculates the optimal input-output weights to determine the most efficient production route, and subsequently applies linear programming to each decision-making unit [12]. Tone incorporated the slack variable into the objective function to enhance the differentIation of efficiency among decision-making units (DMU) and assess their efficiency values in the presence of undesirable outputs [31-34]. This approach enables the optimization of both profit maximization and the improvement of the benefit ratio structure. The model being referred to is the non-radial super-efficiency DEA model, specifically the Slacks-Based Measure (SBM) model. The mathematical expression is as follows:
(1)
Where, ρ* is the efficiency value; x,y are input and output numbers, respectively; i,r are input and output DMU, respectively; Si–,Si+ are input and output relaxation variables, respectively; λ is the weight. If ρ*≥1, it is relatively efficient; If ρ*<1, there is an efficiency loss and the ratio of input to output needs to be optimized.
Exploratory Spatial Data Analysis (ESDA)
ESDA is a crucial study technique within the field of spatial econometrics. Its primary objective is to uncover and analyze the occurrence of geographical dependency, spatial correlation, and spatial autocorrelation pertaining to specific features within neighboring geographic areas. The analytical methods primarily consist of two distinct approaches: Global spatial autocorrelation analysis (GSA) and Local spatial autocorrelation analysis (LSA). The GSA primarily focuses on examining the level of correlation and heterogeneity of a specific property across neighboring or similar geographic areas. This is often quantified using the widely utilized global Moran’s I index [35-37]. The formula for calculating this index is as follows:
Where, I is the global Moran’s I index, n is the number of space units, Yi and Yj are the observed values of i space units and j space units, respectively, and Wij is the space weight matrix (If the spaces are adjacent, it is 1; if the spaces are not adjacent, it is 0). The observed value S2 is the variance and the observed value Y̅ is the mean.
The LSA is the examination of the degree of correlation between attributes of local spatial units or the same attributes of neighboring local spatial units within a given region. The Moran scatter plot and the Local Indicators of Spatial Association (LISA) test are frequently employed in academic research and analysis. The formula for the local Moran’s I index [38, 39] is as follows:
Ii is the local Moran’s I index, m is the number of spatial units, Xi and Xj are the attribute values of i-space units and j-space units, respectively, Wij is the spatial weight matrix, and X̅ is the mean.
Data Sources
The land-use types data for the study area primarily originated from Globeland 30 (http://www.globall and cover.com/ (accessed on 2 August, 2023)). The social and economic data were predominantly obtained from the 2011–2022 Chongqing Statistical Yearbook and the China County Statistical Yearbook. In instances where specific data points were missing, an interpolation method was employed to estimate their values. The analysis was conducted based on the five levels of AEE in different districts and counties of Chongqing, as presented in Table 1 of the research findings by ZHANG et al. [17].
Calculation of Agricultural Eco-Efficiency
In order to employ the super-efficiency SBM-DEA model for the purpose of assessing the AEE of each district and county in Chongqing, it becomes imperative to carefully choose appropriate input and output indicators. The AEE index system (Table 2) has been chosen based on its representativeness and accessibility of indicators.
The selection of input indicators in this study is mostly based on the research conducted by Coluccia [40] and Pang [13] et al. These indicators encompass several factors such as labor, capital, land, fertilizer, pesticides, agricultural film, irrigation, and machinery. The measurements encompassed a range of variables, including the number of agricultural employees (ten thousand individuals), rural electricity consumption (ten thousand kW·h), total area of crop cultivation (thousand hm2), quantity of fertilizer applied (t), quantity of pesticides applied (t), quantity of agricultural film used (t), extent of effective irrigation area (thousand hm2), and total power of agricultural machinery (kW). It is important to highlight that the focus of this study is on the specific sector of the planting industry within agriculture. Therefore, the calculation of the number of agricultural employees is derived by multiplying the number of employees in the primary industry by the ratio of the total agricultural output value to the total output value of agriculture, forestry, animal husbandry, and fishery.
Table 1.
The standard for classifying efficiency levels.
| Levels | Complete efficiency | High efficiency | Medium efficiency | Low efficiency | Inefficiency |
|---|---|---|---|---|---|
| Range of values | TE 1 | 0.8≤TE<1 | 0.6≤TE<0.8 | 0.4≤TE<0.6 | TE<0.4 |
The super-efficiency SBM-DEA model incorporates both the desired output and the undesirable output in the output index. The desired output primarily encompasses the total agricultural output value and the agricultural carbon sink. Some scholars perceive the total agricultural output value solely as the desired output [31-33], whereas others consider both types as the desired output [41]. The total agricultural output value (ten thousand yuan) was chosen as the desired output in this study. On one hand, it is worth noting that the quantification of the total agricultural output value is relatively easy, but obtaining data on the agricultural carbon sink in each district and county of Chongqing from 2010 to 2021 presents challenges, and on the other hand, the total agricultural output value encompassed a broader range. The undesirable output is quantified using the carbon emissions from agricultural land (t) and the quantity of ANSP (t) [42], the formula for estimating carbon emissions from agricultural land is: E = ΣEi = ΣTiδi, where E represents agricultural carbon emissions, Ei represents the carbon emissions originating from different carbon sources, Ti represents the quantity of each carbon emission source, δi and represents the emission coefficient associated with each carbon emission source [43]. Referring to the study, six distinct categories of carbon emission sources were identified, both direct and indirect. These categories encompass chemical fertiliser, pesticide usage, agricultural film application, diesel fuel consumption, agricultural irrigation practices, and tillage methods. The emission coefficients associated with the respective quantities are 0.8956 kg/kg, 4.9341 kg/kg, 5.18 kg/kg, 0.5927 kg/kg, 25 kg/hm2, and 312.6 kg/km2. The formula for estimating ANSP is: EUA = Σi=1n PEiQi, where EUA represents the amount of agricultural pollution discharged, PEi represents the output of each agricultural non-point source pollutant. Qi represents the pollutant discharge coefficient of each pollutant, which is derived by evaluating the pollution production rate and loss rate associated with each pollution source [42]. This article primarily focuses on agricultural non-point source pollutants, which encompass fertiliser, pesticides, agricultural film, crop straw, and rural living.
Table 2.
Evaluation index system of AEE.
Results and Discussion
Temporal Evolution Analysis of AEE
Based on the DEA model theory, the AEE values of Chongqing and its 38 districts and counties were computed using the MAXDEA software. Two models were employed: the CCR-DEA model, which did not account for the undesirable output, and the SBM-DEA model, which did consider the undesirable output. The comprehensive efficiency value of the entire city can be observed in Fig. 2. In contrast, the analysis reveals that the super-efficiency SBM-DEA model yields a lower estimation of AEE compared to the efficiency value obtained from the CCR-DEA model. This discrepancy suggests that the CCR-DEA model tends to overestimate the true utilization of agricultural resources while neglecting the consideration of undesirable output factors such as ACE and ANSP. Hence, the utilization of the super-efficiency SBM-DEA model enables a more accurate representation of the actual efficiency value.
Temporal Evolution Analysis of AEE at City-Level
The data shown in Fig. 2 illustrates that the AEE of Chongqing has exhibited a consistent fluctuation around 0.8 between 2010 and 2021. This observation suggests that there remains significant potential for enhancing the AEE of Chongqing. Based on the analysis of Table 3, it can be observed that the efficiency grade of the 38 districts and counties in Chongqing from 2010 to 2021 is characterized by a prevalence of districts and counties exhibiting complete efficiency, low efficiency, and inefficiency. Conversely, the occurrence of districts and counties demonstrating high efficiency is limited to a range of 0-3 throughout the specified period. Furthermore, the number of districts and counties displaying medium efficiency remained below 5 for the majority of the years under consideration. While the count of districts and counties exhibiting complete efficiency experienced a rise from 10 in 2010 to 16 in 2021, the count of districts and counties with low efficiency remained relatively stable at approximately 10. This situation has hindered the progress of the AEE in the region of Chongqing. From 2010 to 2021, the AEE in Chongqing exhibited a pattern characterized by an initial increase, followed by a decrease, and then a subsequent increase. Notably, over the period from 2016 to 2019, the AEE saw significant fluctuations. However, despite these fluctuations, the overall trend of the AEE remained positive, indicating a gradual improvement in AEE over time. Since the initiation of China’s reform and opening up policy in 1978, the Communist Party of China (CPC) core Committee has placed significant emphasis on agricultural matters and has released a succession of No. 1 core documents to provide guidance for the advancement of China’s agricultural sector. However, there is a disparity in the level of agricultural modernization between Chongqing and certain other agriculturally developed regions.
Temporal Evolution Analysis of AEE at Regional Level
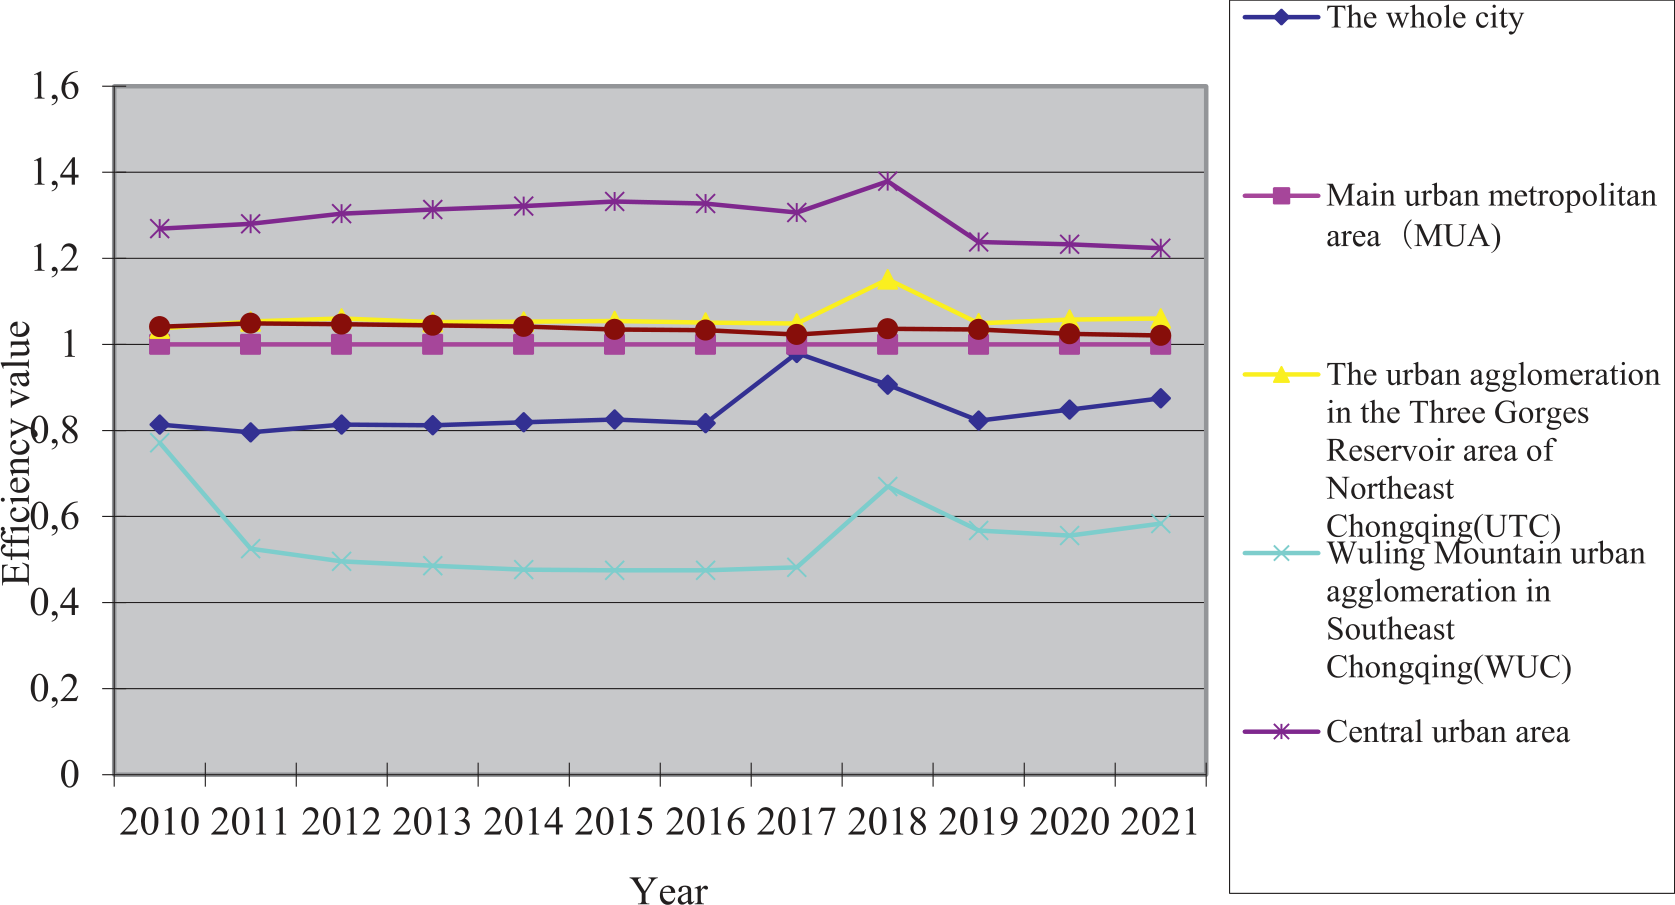
According to the administrative division of regions, Chongqing can be broadly categorized into “one district and two groups”. These include the main urban metropolitan area (MUA), the urban agglomeration in the Three Gorges Reservoir area of Northeast Chongqing (UTC), and the Wuling Mountain urban agglomeration in Southeast Chongqing (WUC). The MUA can be further divided into the central urban area and the main urban new area. The central urban area includes Yuzhong, Jiangbei, Nanan, Jiulongpo, Shapingba, Yubei, Dadukou, Beibei and Banan. The main urban new area encompasses Bishan, Jiangjin, Changshou, Nanchuan, Fuling, Yongchuan, Hechuan, Qijiang, Tongliang, Dazu, Rongchang, and Tongnan. The UTC comprises Wanzhou, Kaizhou, Liangping, Fengdu, Dianjiang, Zhong, Yunyang, Fengjie, Wushan, Wuxi, and Chengkou. Lastly, the WUC includes Qianjiang, Wulong, Shizhu Tujia Autonomous, Pengshui Miao Tujia Autonomous, Youyang Tujia Miao Autonomous, and Xiushan Tujia Miao Autonomous. By examining the AEE data for the three areas (Fig. 3) throughout the period from 2020 to 2021, it is evident that Chongqing consistently exhibits the trend of UTC>MUA>WUC and central urban area>main urban new area. Furthermore, there is a steady convergence observed between WUC, UTC, and MUA, indicating that despite UTC’s relatively small agricultural scale, it has made notable advancements in ecological agriculture and resource utilization. The primary drivers of economic development in UTC are the green industry of “Three Gorges Manufacturing” and modern high-efficiency agriculture with distinct mountain characteristics known as “Three Gorges Farmers”. Significant emphasis is placed on the synchronised advancement of agricultural economic growth, ecological environmental preservation, and resource conservation. Furthermore, there is an increased emphasis on agricultural environmental protection awareness, stricter regulations on controlling ANSP, and a greater promotion of emission reduction and carbon reduction efforts. The economic development conditions of MUA exhibit favourable characteristics, with its resource endowment, planting structure, technological progress, and other elements demonstrating a clear superiority over other regions. The implementation and utilisation of advanced agricultural production technology and equipment, such as high-efficiency water-saving irrigation technology and drone seeding technology, have resulted in significant reductions in ACE and ANSP. The districts and counties within the jurisdiction of WUC exhibit a prominent presence of industries, cultural and tourism integration, but the agricultural farmland area with a high and stable yield, which is safeguarded against drought and flood, is limited. Conversely, there is a significant proportion of medium and low yield fields, indicating a weak capacity to withstand natural disasters. Additionally, the district faces severe ANSP, substantial pressure to maintain zero growth in pesticide and fertiliser usage, and the absence of an established agricultural green development system. The efficiency of utilising agricultural resources is currently suboptimal, necessitating a pressing need for the transformation and upgrading of the agricultural sector.
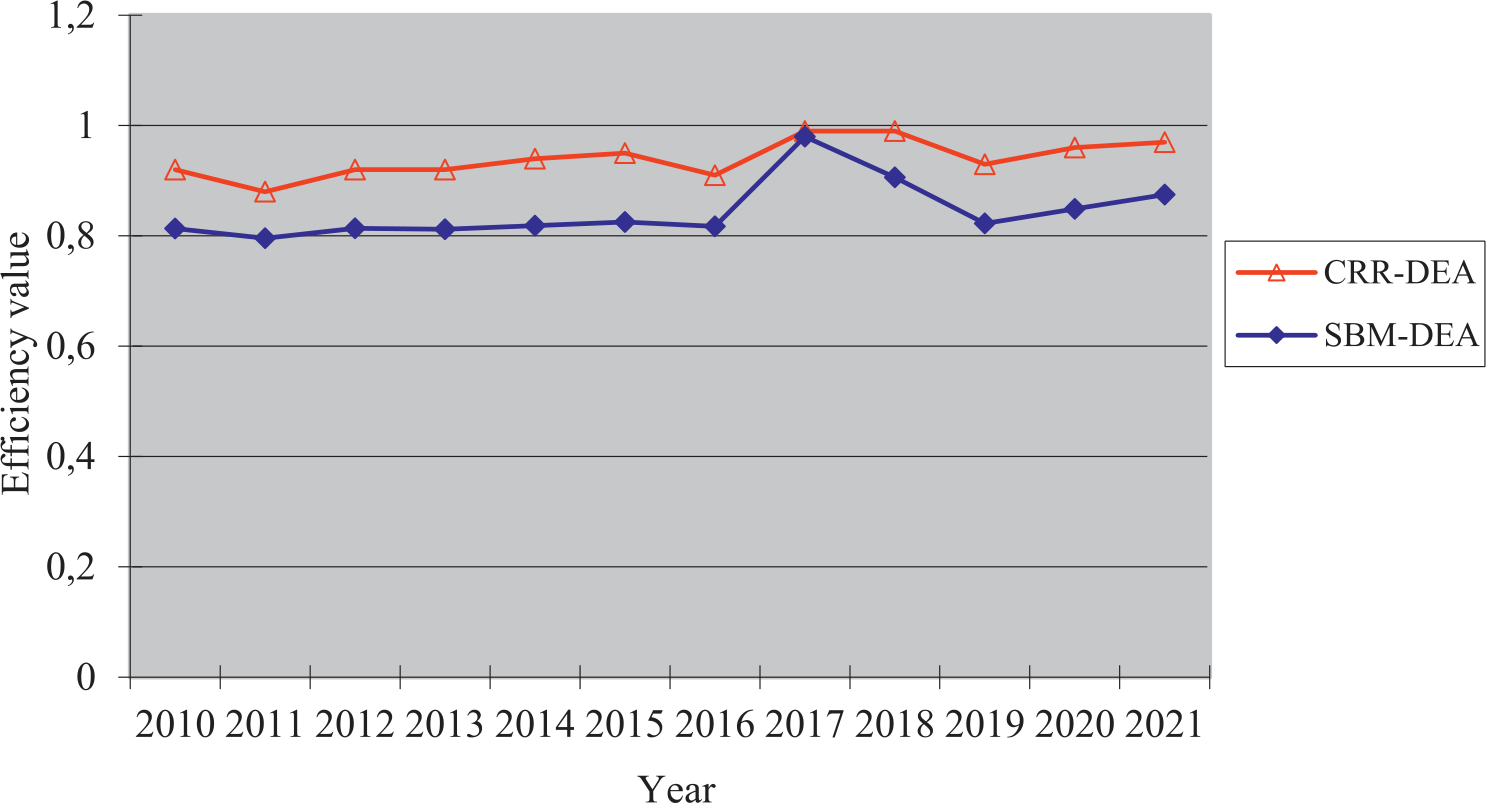
Table 3.
The number of AEE grades in each district and county of Chongqing from 2010 to 2021.
Overall Differences in AEE
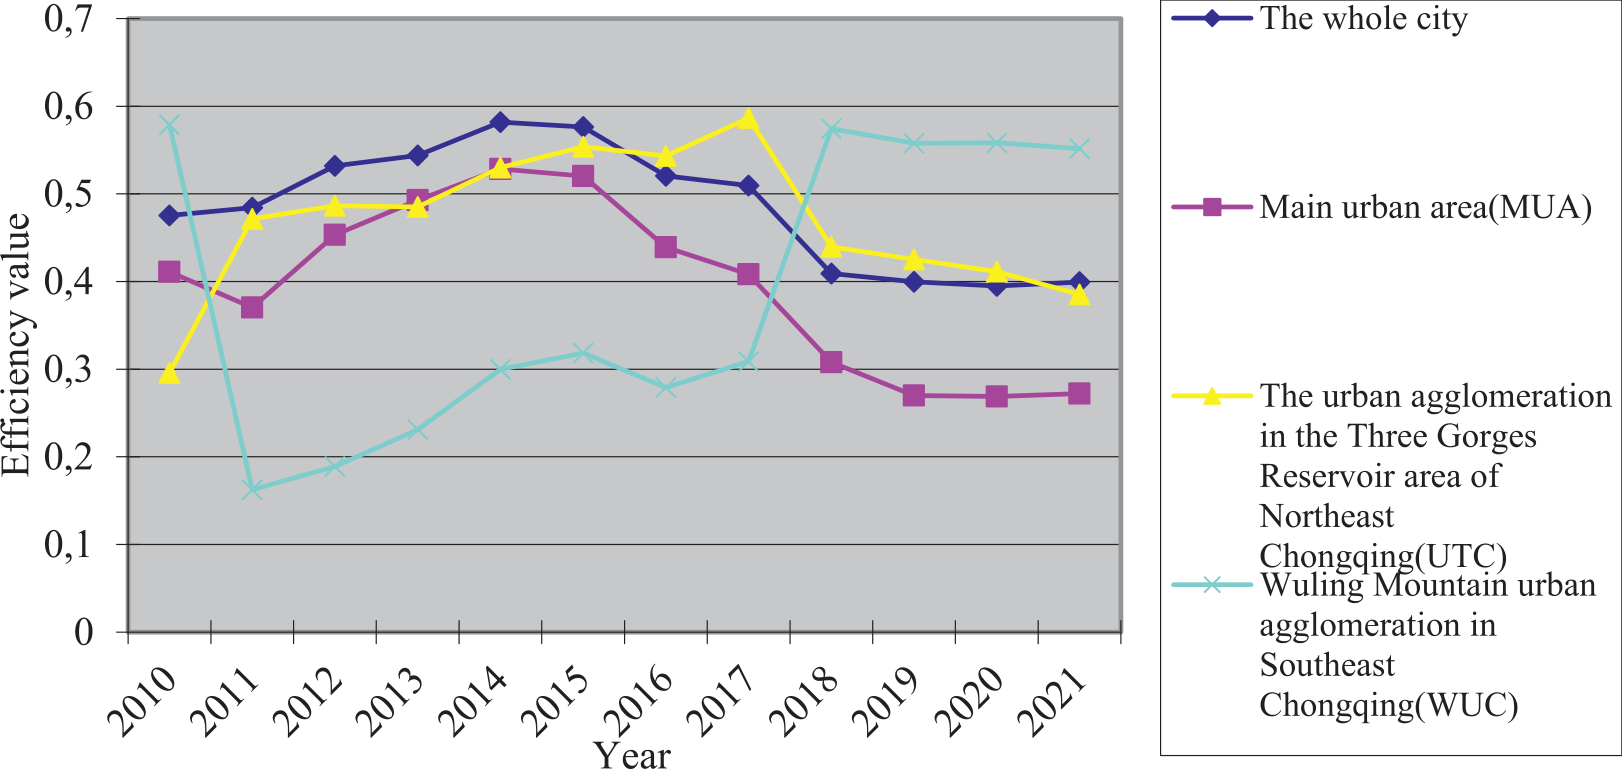
Between 2010 and 2021, the coefficient of variation for AEE in Chongqing exhibited a pattern of fluctuation (Fig. 4). Subsequently, starting from 2018, a consistent downward trend in the coefficient of variation was observed, indicating a progressive reduction in the disparities of AEE throughout the 38 districts and counties in Chongqing. At the regional level, the coefficient of variation for AEE in MUA and UTC is comparable to that observed across the entire city. However, the coefficient of variation for AEE in UTC is greater than that in MUA, suggesting a significant disparity in the growth of AEE inside UTC. The central urban area of MUA provides a radiation drive that confers several advantages in the integration of agriculture and tourism, leisure agriculture, and the enhancement of agricultural technology. In contrast, UTC lacks an effective radiation growth pole drive. Hence, it can be inferred that there exists a discernible positive correlation between AEE and location conditions in Chongqing. The coefficient of variation for AEE in WUC exhibits a fluctuating pattern characterized by a sequence of declines, increases, and subsequent declines. This can be attributed to the unique agricultural industry development approach known as “one county and one special” in WUC, which results in varying influencing factors for each industry. Consequently, the disparity in AEE across different districts and counties experiences intermittent contraction and expansion.
Spatial Pattern Analysis of AEE
Spatial Pattern Distribution of AEE
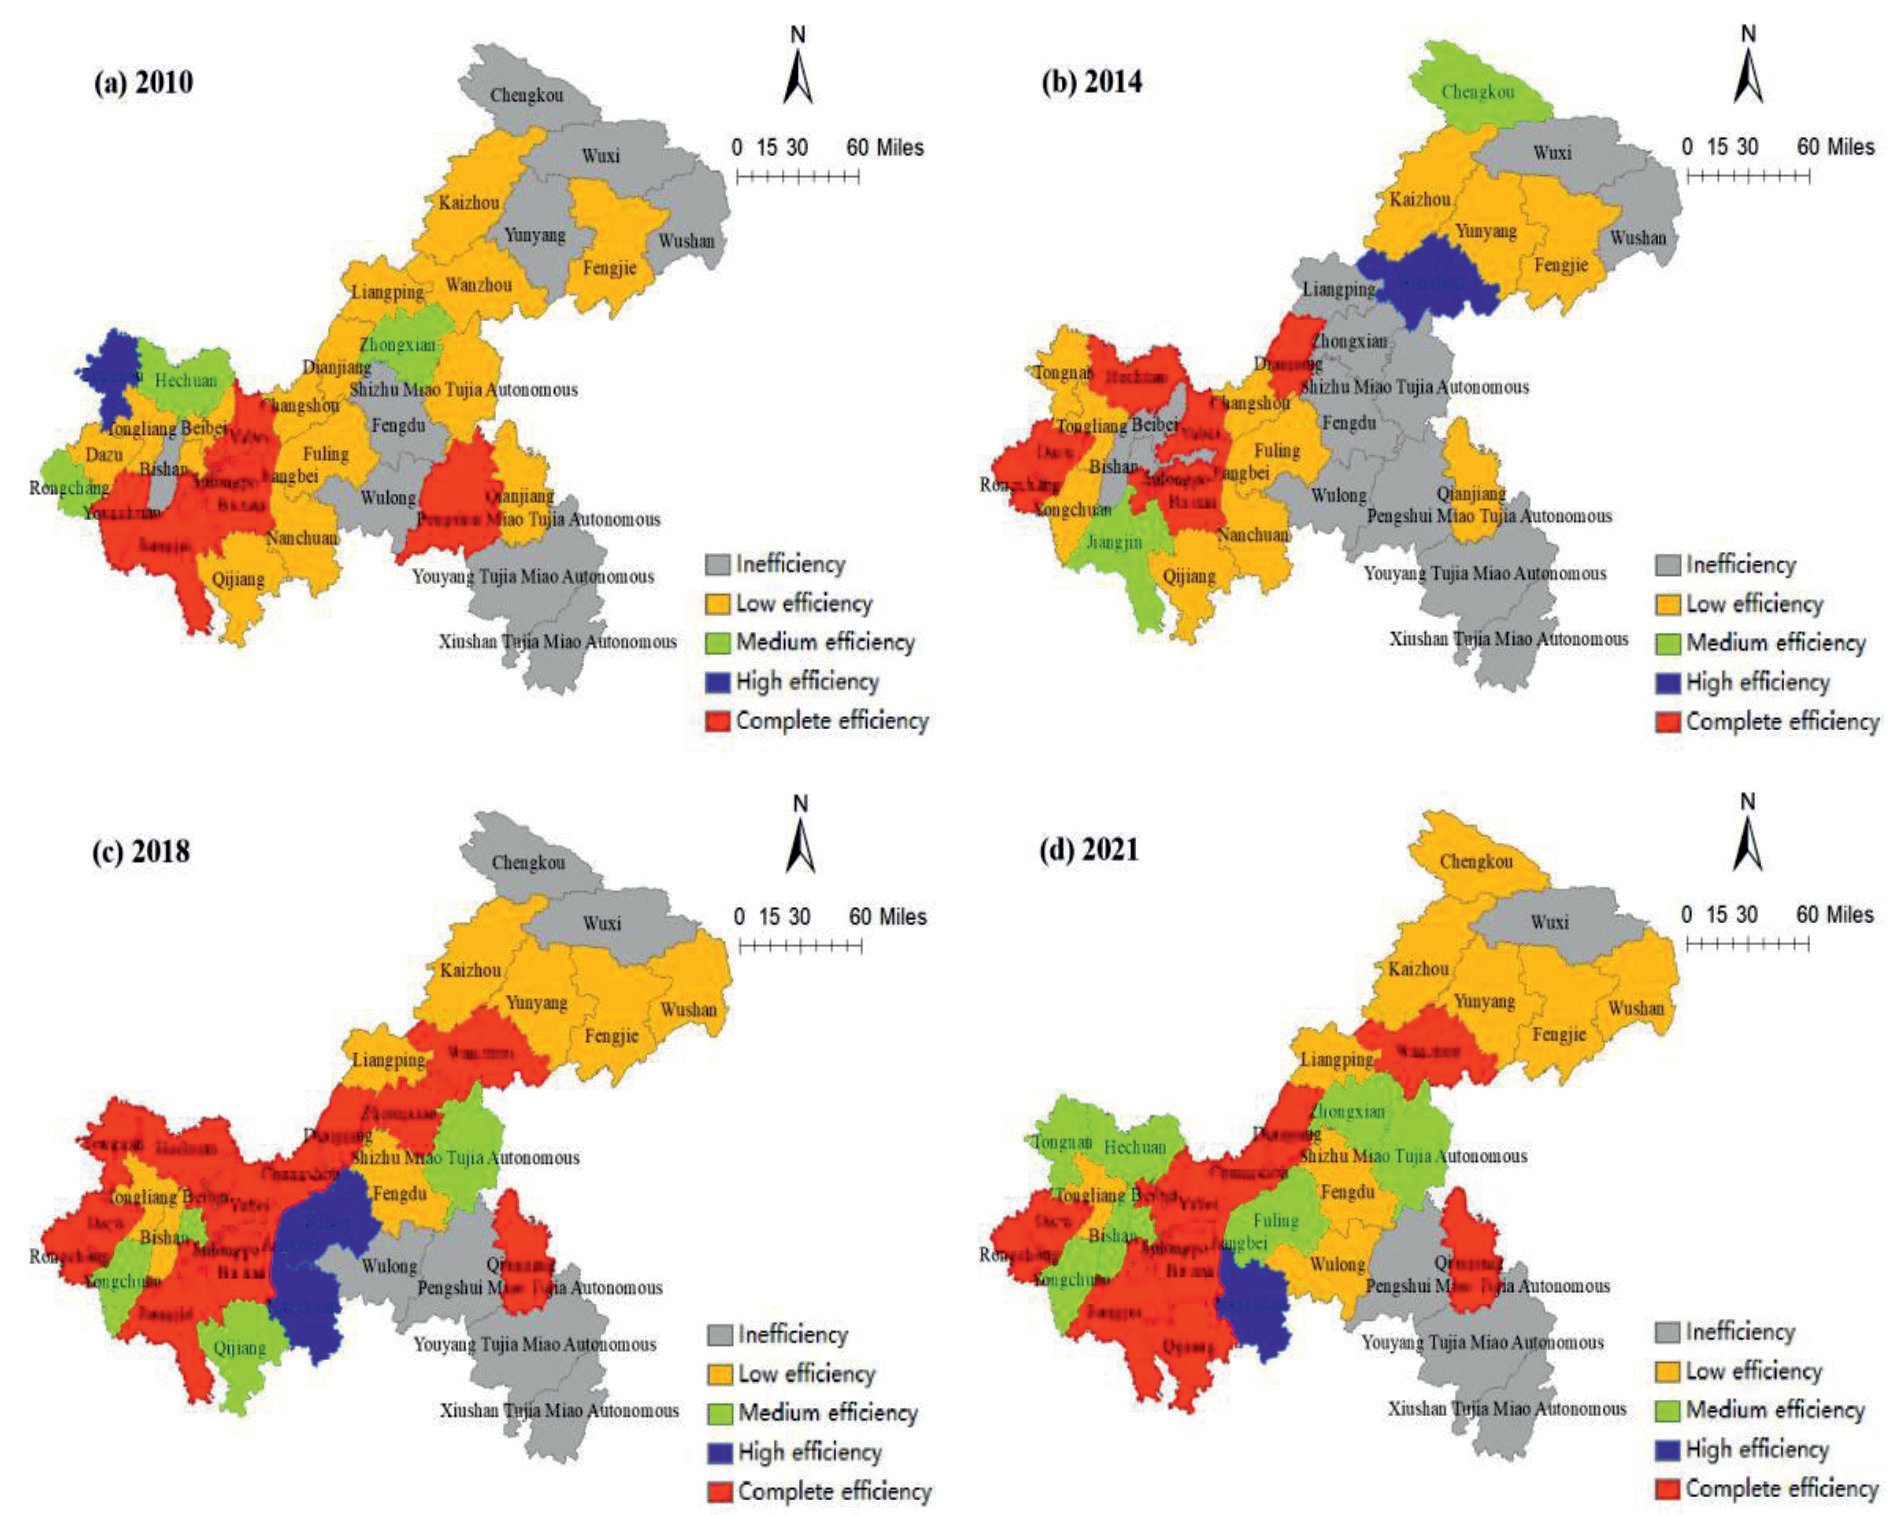
To elucidate the spatial pattern characteristics of AEE in Chongqing, this study has chosen four notable years, namely 2010, 2014, 2018, and 2021. The visualization of AEE throughout the 38 districts and counties in Chongqing has been accomplished using ArcGIS 10.8 software (Fig. 5).
Fig. 5 illustrates the AEE levels of various districts in Chongqing in 2010. The districts of Yuzhong, Datukou, Jiangbei, Jiulongpo, Nan’an, Yubei, Banan, Jiangjin, Yongchuan, and Pengshui Miao and Tujia Autonomous achieved complete efficiency. Tongnan demonstrated high efficiency, while the remaining districts and counties exhibited medium or below-average efficiency levels. The presence of numerous low-efficiency districts and counties poses a constraint on the overall improvement of AEE in the city. In comparison to the year 2010, the efficiency levels of Dazu, Hechuan, Rongchang, Dianjiang, and other districts and counties in 2014 have demonstrated improvement and have reached a state of complete efficiency. However, the overall level of AEE in the entire city has not experienced effective improvement, but rather has declined from a high efficiency level to a medium efficiency level. In contrast to the data from 2014, the overall energy efficiency of the entire city exhibited a positive trajectory in 2018. Specifically, both Jiangbei and Jiangjin regions experienced a rise in AEE, thereby regaining the level of complete efficiency. In the year 2021, a total of 16 districts and counties achieved complete efficiency in the AEE sector. These districts were primarily located in the central urban area, as well as in Rongchang, Dazu, Jiangjin, Wanzhou, and other regions. Notably, the spatial distribution pattern has undergone a shift from the central urban area being the focal point in 2010 to the main axis now being Jiangjin-Dianjiang-Wanzhou, with Rongchang-Dazu and Qianjiang serving as the two wings.
Changing Trend of Spatial Pattern of AEE
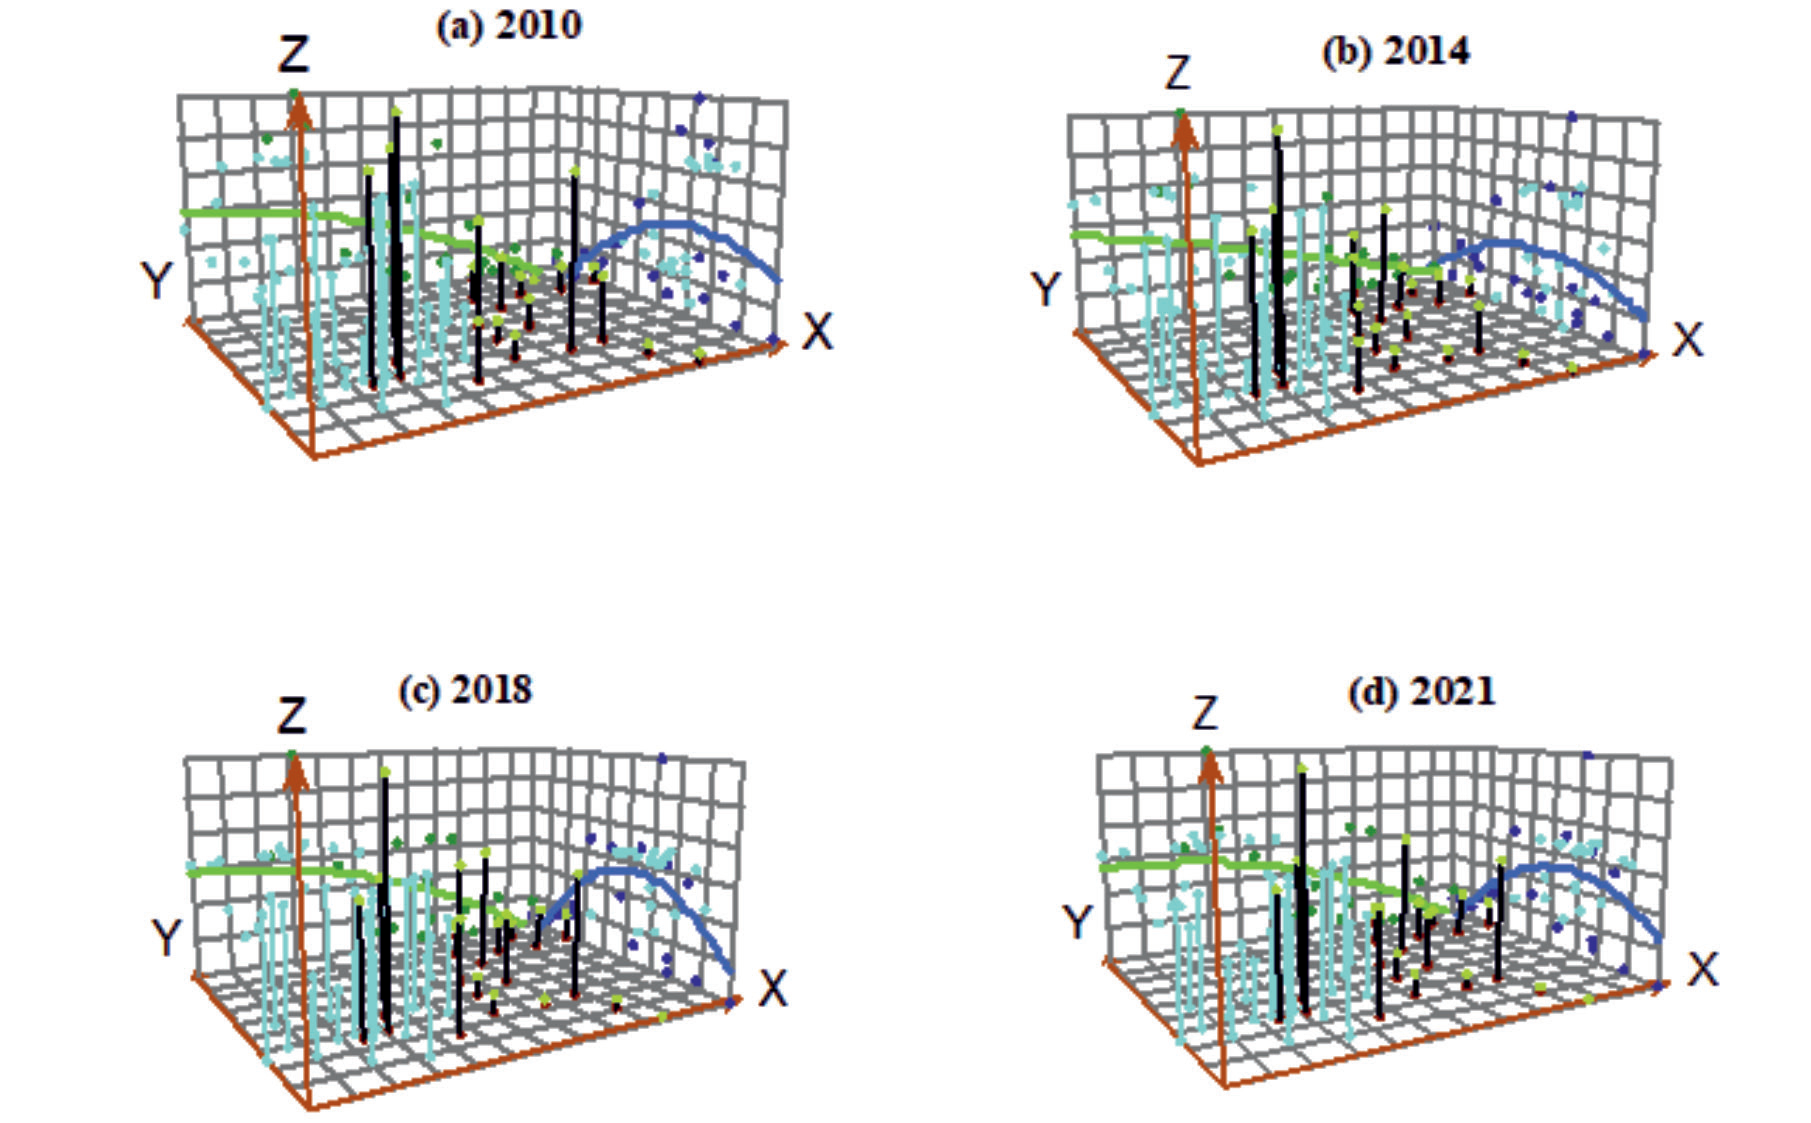
To examine the spatial pattern change trend of AEE in Chongqing, the trend analysis tool within ArcGIS 10.8 software was employed. This tool facilitated the creation of a three-dimensional trend map depicting the AEE values across 38 districts and counties in Chongqing for four selected years (Fig. 6). In this map, the AEE value for each district and county was assigned as the Z value, while the due east and due north directions were designated as the X and Y values, respectively.
The analysis of Fig. 6 reveals that the spatial distribution of Chongqing’s AEE in the east-west direction exhibited a gradual decline from west to east in 2010. Additionally, a distinctive inverted U-shaped pattern was observed from the north to the south. These findings suggest that the overall level of Chongqing’s AEE was relatively low during the specified time period, with the primary differentiating factor being the regional disparity in the north-south direction. In contrast to the year 2010, the spatial distribution of Chongqing’s AEE in 2014 exhibited a notable decline in the east-west direction with a pronounced west-to-east gradient. Additionally, the AEE demonstrated a characteristic inverted U-shaped pattern, indicating an upward tendency in the north and south directions, the AEE saw a drop, with its average value declining from 0.81 in 2010 to 0.79. The spatial projection of AEE in 2018 and 2021 exhibits a comparable pattern to that observed in 2010, in the east-west direction, there is a gradual decline from west to east. Conversely, in the south-north direction, there is an inverted U-shaped growth trend. However, the magnitude of the change is substantial, indicating an increased spatial disparity between the south and north directions. During the period of investigation, it was observed that the magnitude of change in AEE was more pronounced in the north-south direction compared to the east-west direction. This suggests that the disparity between the northern and southern regions was greater than that between the eastern and western regions. This finding aligns with the regional economic development pattern observed in Chongqing.
Spatial Correlation Analysis of AEE
GSA Analysis of AEE
The GeoDa 1.20 software was utilized to compute the global Moran’s I index, standard deviation, Z-statistic test, and p significance level of AEE in 38 districts and counties of Chongqing across four representative years. The spatial weight matrix was established using the spatial proximity matrix Queen criterion (Table 4).
The analysis of Table 4 reveals that the global Moran’s I index of AEE in Chongqing exhibits positive values ranging from 0.2082 to 0.5304 during the study period. Furthermore, all p-values associated with these values are found to be less than 0.05, satisfying the significance test at a 95% confidence level. The analysis suggests that the AEE in Chongqing exhibits favorable spatial autocorrelation, indicating the presence of clustering among districts and counties. Despite a decline in the global Moran’s I index of AEE in Chongqing between 2010 and 2014, subsequent data from 2014 to 2021 reveals a rising trend, with values increasing from 0.2082 to 0.4337. This suggests a growing agglomeration pattern within Chongqing, wherein lower districts and counties tend to cluster together, exhibiting characteristics of both H-H and L-L spatial agglomeration.
LSA Analysis of AEE
To examine the spatial concentration of AEE within the 38 districts and counties of Chongqing at a localized level, the software GeoDa 1.20 was employed to generate LISA agglomeration maps for AEE in four selected years (Fig.7). The data presented in Fig.7 illustrates the count of districts and counties exhibiting positive spatial correlation, specifically H-H and L-L agglomeration, for the years 2010, 2014, 2018, and 2021, the respective counts for these years are 12, 5, 11, and 14. These figures suggest a discernible pattern of increasing strength in the H-H and L-L agglomeration of AEE in Chongqing from 2014 to 2021. The prevalence of districts and counties exhibiting High-Low (H-L) and Low-High (L-H) agglomeration patterns is relatively stable at approximately five. Through a comparative analysis of the four distinct types of agglomeration, it is possible to gain a comprehensive understanding of their respective characteristics and implications.
The H-H agglomeration mostly exhibits a spatial distribution pattern concentrated on central urban areas, namely Dadukou, Banan, Jiulongpo, South Bank, Jiangbei, and Yubei. Additionally, a limited number of MUA, such as Jiangjin and Changshou, also contribute to the overall distribution of the agglomeration. Changshou has been included in the H-H agglomeration since 2018, while Qijiang joined the ranks in 2021. The rationale behind this is that the central urban area of Chongqing holds significant ecological importance as a functional area and a popular tourism destination. Consequently, there exists a pressing need for stringent ecological environmental protection measures. The central urban area primary focus lies in the development of recreational agriculture and ecological agriculture. Hence, the AEE in these regions operates at either optimal efficiency or high efficiency, exerting a discernible radiation-induced influence on the adjacent areas. Nevertheless, there continues to exist a specific quantity of L-H agglomeration regions adjacent to H-H agglomeration regions, and it is imperative to consistently enhance the dispersion impact of H-H agglomeration regions over the course of agricultural economic development in the forthcoming years.
Table 4.
Global Moran’s I index distribution of AEE in Chongqing (2010, 2014, 2018, 2021).
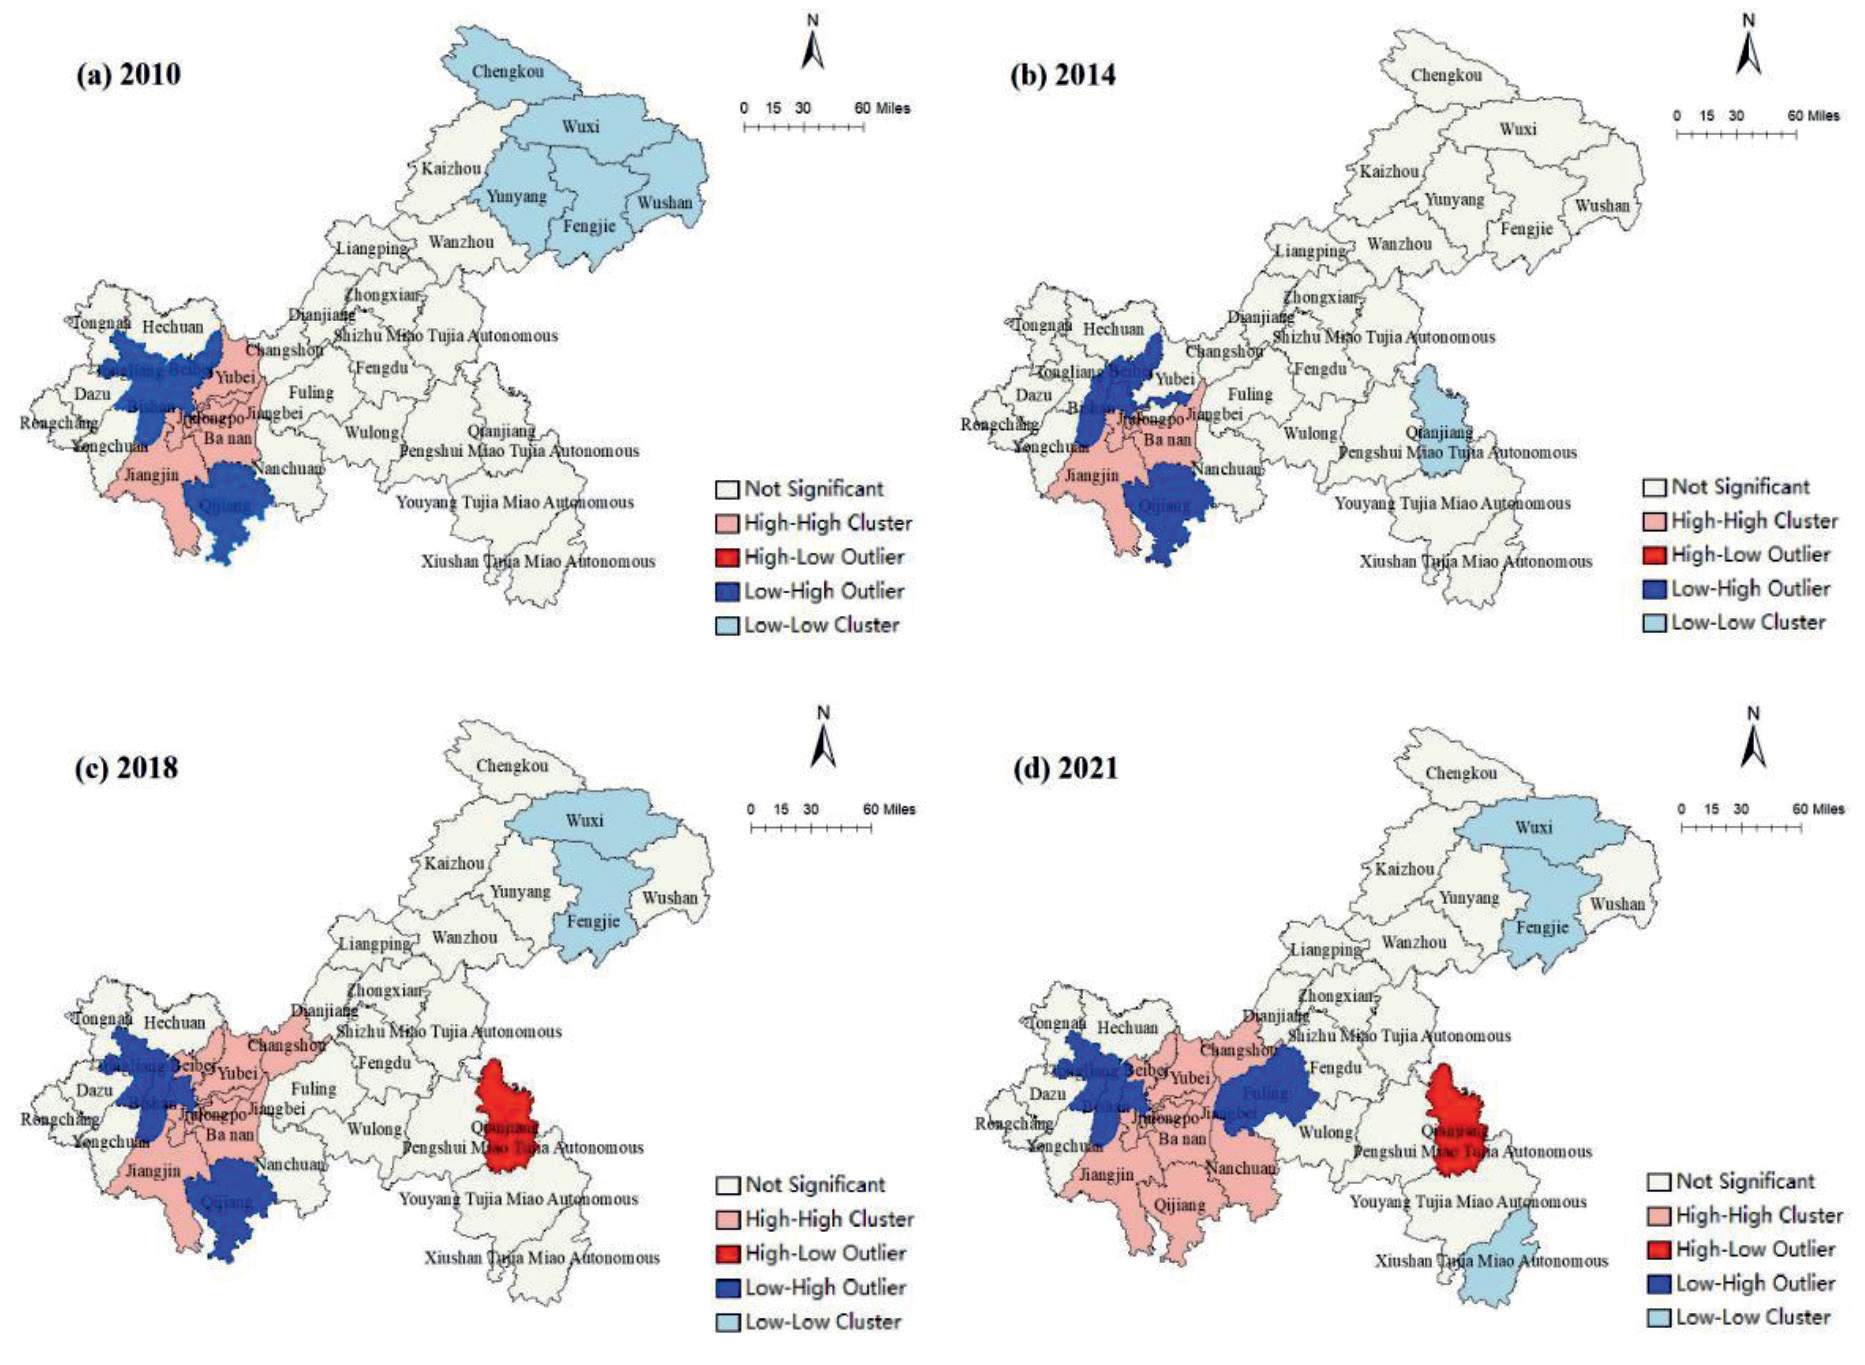
The L-H agglomeration is mostly concentrated in the western and southern regions of the central urban area, with these areas being in close proximity to the H-H agglomeration areas. In the year 2010, the region consisted of five districts, namely Shapingba, Tongliang, Beibei, Bishan, and Qijiang. However, by 2021, the number of districts had been reduced to four, specifically Shapingba, Tongliang, Bishan, and Fuling. Within this agglomeration area, Shapingba, Tongliang, Bishan, and Qijiang have consistently been present. Notably, Qijiang has experienced a noteworthy enhancement in its AEE, transitioning from a L-H agglomeration level to a H-H agglomeration level. This shift can be attributed to the influential contributions made by Jiangjin, Banan, and Nanchuan in the domains of ecological environment, modern agriculture, and science and technology investment.
The L-L agglomeration area is predominantly located in the eastern region of the UTC. This distribution can be attributed to the evident disadvantages of the eastern location within the UTC, which are influenced by factors such as the level of economic development, agricultural labor force, and population. Consequently, the eastern region faces limitations in terms of capital investment, scientific and technological investment, and ecological investment, resulting in relatively limited progress in these areas. Additionally, the agricultural economy in the eastern region lags behind in terms of development. Between the years 2010 and 2021, there was a decrease in the number of L-L agglomeration areas from 5 to 3, indicating a discernible downward trajectory. Three districts, namely Chengkou, Wushan, and Yunyang, underwent a transition from being part of an agglomeration characterized by L-L in 2010 to becoming regions of negligible significance. This shift suggests that districts and counties that are concentrated and adjacent, and exhibit low levels of AEE, may have adverse effects on the surrounding areas.
The H-L agglomeration areas are primarily scattered throughout a small portion of the WUC. H-L agglomeration areas increased from 0 to 1, including Qianjiang, between 2010 and 2014. Indicating that Qianjiang boosted its agricultural investment over the study period, which also helped to reduce the ecological environmental pollution brought on by agricultural production and raised the level of AEE, the city’s status changed from non-significant in 2010 to H-L agglomeration in 2021. However, the AEE of Pengshui and Youyang, which are close by to one another, has always been in the inefficient area, and there is a geographical advantage to “being spread,” so their AEE has plenty of opportunity to grow.
From 2010 to 2021, it can be observed that a majority of districts and counties in Chongqing, approximately 60%, lack discernible agglomeration features. This suggests that the level of agglomeration in the agricultural economy within most districts and counties in Chongqing is rather low. During the study period, it was observed that the number of H-H agglomeration areas in AEE exhibited a consistent upward trend. Notably, Changshou and Qijiang districts and counties were sequentially included in the H-H agglomeration areas, suggesting that the central urban area exerted a significant influence on the surrounding regions. Conversely, the number of L-L agglomeration areas displayed a declining pattern over the years, with districts and counties such as Wuxi and Fengjie consistently falling within this category. Hence, in the pursuit of comprehensive rural revitalization and the expedited modernization of agriculture in the 14th FYP period, Chongqing should undertake the task of consolidating and disseminating successful practices in the efficient utilization of agricultural resources within the central urban areas. Additionally, it should enhance its guidance in the adoption of modern agricultural science and technology, modern management techniques, and optimal resource allocation in the eastern regions of the UTC and the WUC. Enhance the overall proficiency of AEE in Chongqing.
While this study used super-efficiency SBM-DEA and ESDA models to investigate the dynamic evolution characteristics of AEE and spatial patterns in each district and county of Chongqing, it is important to acknowledge several limitations that warrant further discussion: This study employs the super-efficiency SBM-DEA model to examine the impact of undesirable output factors on efficiency. However, due to data collection challenges, this study only considers ACE and ANSP as undesirable outputs, while neglecting the influence of agricultural production on other dimensions, such as the deterioration of cultivated land quality and soil erosion. Consequently, there exists a certain degree of deviation between the AEE value and the actual value, highlighting the need for further improvement in future research. Furthermore, the indicators chosen for analysis in this study are limited to those that have readily available data and can be easily quantified. However, it is important to note that certain factors, such as agricultural economic policy and government management level, which are challenging to quantify yet have a significant impact on AEE, have not been included in the analysis. Addressing this limitation and incorporating these factors into the index system will be a key focus of future research. Thirdly, the level of AEE influences the quality of agricultural economic development. In light of the need to build agricultural power more quickly, it is important to find ways to coordinate rapid agricultural development with the protection of the environment and the conservation of natural resources. This will help prevent the AEE from declining due to overuse of agricultural resources and ecological environment damage.
Conclusions
This study employs the super-efficiency SBM-DEA and ESDA models to assess the AEE of 38 districts and counties in Chongqing. It further conducts a quantitative analysis of the temporal evolution features, spatial pattern change trend, and spatial correlation of AEE in Chongqing. By comparing the super-efficiency SBM-DEA model with the CRR-DEA model without considering the undesired output, the following conclusions have been derived. The results indicate that the CRR-DEA model disregards the impact of undesirable output factors such as ACE and ANSP and overestimates the actual utilization of agricultural resources, whereas the super-efficiency SBM-DEA model is more consistent with the actual agricultural production process. Nevertheless, the two models’ AEE measurements in Chongqing are at a high level, suggesting that there is still possibility for efficiency growth. From a temporal perspective, the AEE of Chongqing has consistently been in the high efficiency category between 2010 and 2021, with a gradual upward trend. This suggests that there is potential for further improvement in future AEE. From a spatial perspective, the distribution of spatial pattern is uneven, displaying a development pattern of UTC>MUA>WUC. In terms of the trend in spatial pattern change, it can be observed that the east-west direction exhibits a gradual decline from west to east, while the north-south direction demonstrates a growing trend resembling an inverted U-shape. However, it is noteworthy that the disparity in the north-south direction is more pronounced compared to the east-west route. Regarding spatial correlation, the AEE in Chongqing revealed a positive spatial autocorrelation. Moreover, notable patterns of H-H agglomeration and L-L agglomeration were observed across the various districts and counties. The H-H agglomeration primarily concentrates in the center urban area and exhibits a tendency to expand towards adjacent areas and counties. Conversely, the L-L agglomeration is predominantly located in the eastern region of the UTC and displays a discernible decline. During the study period, there was an observed rise in the quantity of districts and counties in Chongqing that exhibited a positive spatial correlation of AEE. This suggests that the agglomeration characteristics of AEE were gradually strengthened.
In light of the “dual carbon” target, this study offers remedies and proposals for Chongqing to enhance Agricultural Emissions Efficiency by considering the current state of agricultural growth. These recommendations focus on two key aspects: reducing ACE and enhancing the efficiency of agricultural resource utilization.
Firstly, optimize the ANSP control system and enhance the AEE [44, 45]. Currently, the AEE in Chongqing exhibits a consistent variation around 0.8. This suggests that there is still potential for enhancing AEE. It is worth noting that the overutilization of agricultural resources and the degradation of the ecological environment are strongly intertwined with AEE. Therefore, it is imperative for Chongqing to effectively integrate many dimensions of agricultural production, including resources, technology, and societal factors [46]. This entails optimizing the system for controlling ANSP, thereby enhancing AEE. Specifically, it can be carried out from several aspects: First, to ensure the efficient prevention and control of ANSP, improve the financial support for ANSP control, implement administrative law enforcement, technology promotion, and other supporting funds in the treatment process; Second, increase awareness of ANSP control through knowledge lectures and media commentary, encourage regional agricultural production and operation subjects to volunteer for ANSP control work, and raise their self-discipline awareness [47]; Third, to master the fixed-point monitoring of diverse ANSP, increase the dynamic monitoring of pollution by establishing state control points of ANSP monitoring in all districts and counties of the city. At the same time, professional training should be given to the monitoring personnel to improve the accuracy of data monitoring, so as to improve the efficiency of ANSP control.
Secondly, foster the use and advancement of novel agricultural production technologies, while advocating for environmentally sustainable agricultural development. The excessive utilization of agricultural resources, such as pesticides, fertilizers, and agricultural films, during the process of agricultural production can directly contribute to the fall of AEE. In recent years, the agricultural departments in Chongqing have been aggressively advocating for the implementation of the zero-growth policy concerning chemical fertilizers and pesticides. As a result, there has been a noticeable decline in the overall usage of pesticides, chemical fertilizers, and agricultural film on an annual basis. Nevertheless, when considering long-term sustainable development, there remains significant potential for reducing the utilization of agricultural resources, such as pesticides, fertilizers, and agricultural films. Therefore, it is imperative for governmental bodies and agricultural departments to proactively advocate for the adoption of soil analysis technology. This technology enables the identification of distinct soil types, thereby facilitating the determination of appropriate chemical fertilizers and dosage needs for each soil type. By using this approach, it becomes possible to achieve rational fertilization practices, thereby mitigating the adverse environmental impacts resulting from the irrational use of fertilizers. It is imperative to actively advocate for the widespread adoption of environmentally friendly plant protection technologies. By doing so, we may effectively mitigate the occurrence of pests and diseases, while simultaneously minimizing the reliance on pesticides. This approach not only diminishes the potential harm posed to microorganisms within the ecosystem, but also safeguards human health. Another measure is to design and fabricate a novel biodegradable agricultural film with the aim of mitigating the adverse effects of residual film on water quality and soil, thereby promoting sustainable agricultural practices.
Finally, in conjunction with the distinctive features of agricultural growth in the region of Chongqing, it is imperative to use the strengths and address the weaknesses in order to maximize its potential. The spatial distribution of AEE in Chongqing has an uneven pattern, characterized by a distribution trend of UTC>MUA>WUC. Among them, WUC exhibits the lowest AEE, consistently occupying a position within the lower efficiency spectrum over the majority of observed years. The limitations primarily stem from geographical factors characterized by an abundance of mountains and a scarcity of arable land. Consequently, the implementation of agricultural modernization encounters challenges. In their pursuit of increased productivity, farmers resort to the extensive use of pesticides, fertilizers, and agricultural film, thereby leading to significant pollution from non-point sources in the agricultural sector. Therefore, WUC has the potential to integrate regional characteristics and adopt a transformative approach to agricultural development. This can be achieved through the promotion of fine agriculture, the adoption of advanced agricultural production technology, the cultivation of safe melons and fruits, the implementation of soilless culture and fish farming, and the establishment of modern mountain leisure agricultural parks. These initiatives aim to enhance the value of agricultural products and improve agricultural ecological efficiency. UTC possesses a favourable allocation of natural resources. Wanzhou, Kaizhou, Dianjiang, Zhongxian, and Yunyang are widely recognised as the primary regions within Chongqing that exhibit significant agricultural productivity in terms of grain cultivation. Efforts can be consistently made to facilitate the establishment of high-quality farmland and foster the advancement of agriculture in a manner that is both efficient and of superior standards. MUA exhibits favourable economic growth circumstances, whereas the availability of agricultural land resources is limited. The potential areas of emphasis include the advancement of contemporary urban agriculture, the augmentation of investments in agricultural research and technology, and the facilitation of carbon reduction initiatives. In summary, the AEE of UTC and MUA exhibits a reasonably high level. Specifically, the former is situated inside the complete efficiency area, while the latter falls within the high efficiency area. In the future, it is recommended that efforts be made to sustain their agricultural development advantages, assume a leadership role, and further enhance their influence and impact on the surrounding regions.

