

Introduction
The ongoing international trade frictions and the global new pneumonia epidemic have put forward higher requirements for the construction and green development of China’s industrial and supply chains (hereinafter referred to as “the two chains”) to be “autonomous and controllable, safe and efficient” [1]. The reshaping, stability and safety of the two chains is an urgent issue, and the multiple balanced and coordinated development of the two chains is the basis for the sustainable development of China’s economy [2]. As the foundation of the two chains, the stable operation and balanced development of the regional logistics system has become a hot issue that needs attention. According to Logistics Equilibrium Theory (LE), the balanced and orderly operation of the regional logistics system depends on the dynamic balance between the demand for logistics resources and the supply of logistics resources in the quantity, structure, space and time dimensions (QSST) of the regional logistics system structure [3], i.e. the core issue of regional logistics equilibrium is reflected in the matching relationship between the demand for system functions and the supply of system resources. The core issue of regional logistics equilibrium is reflected in the matching relationship between the demand for system functions and the supply of system resources [4], that is, the matching relationship between the structure of the regional logistics system constructed according to the requirements of certain system functions and the logistics resources that can be supplied inside and outside the system. In reality, the balance of time, space, quantity and structure within the logistics system can effectively solve the problem of optimizing the logistics system for C2M service manufacturing [5]; the regional logistics supply and demand in the eastern coastal provinces are better matched and have a greater pull on the regional economy [6]. From theory and reality, it is easy to find that the degree of matching between the structure of the regional logistics system and logistics resources, i.e. the degree of matching, on the one hand, restricts the degree of realization of the system’s functional objectives, on the other hand, it is also the basis and premise for the design of the regional logistics system and the formulation of the regional logistics strategy. Therefore, how to effectively control the matching state and matching level of the regional logistics system structure and logistics resources can help achieve the goal of safe and efficient operation of China’s industrial chain and supply chain, and promote regional economic development. Based on the above analysis, how to measure the degree of matching between the regional logistics system structure and logistics resources becomes a key technical point that needs to be broken through, and is the key to finding and judging the problems that exist in the realistic matching relationship between the two.
The current research on the matching of regional logistics system structure and logistics resources is mainly focused on the following three aspects. The main conclusions include : the integration of logistics resources is the basis for the operation of logistics networks [7]; logistics networks can also further optimize the allocation of logistics infrastructure resources to form a shared, fast and cost-optimized logistics system [8]; the reasonable allocation of logistics resources in the regional logistics system can improve the efficiency of regional logistics operations, thus providing support for sustainable regional economic growth [9]. The second is the study on the mechanism of matching between the two. The main conclusions are : the criteria for determining whether the spatial layout of regional logistics is reasonable include the indicators of logistics infrastructure and other resource elements [10]; the correlation between the physical carriers of logistics system such as logistics network, nodes and spatial layout and the integration and allocation of logistics resources during the construction. Thirdly, the research on the measurement methods of matching the two, mainly using the coupling coordination degree model, grey correlation analysis, vector auto-regressive model, spatial regression model, etc. [11-15]. The coupled coordination model uses the coupling degree to explain the interrelationship between several subsystems, and the coordination development degree to measure and evaluate the coordination development of the system as a whole. The model is easy to calculate and the results are intuitive. It is widely used to study the degree of matching between multiple systems in different areas of the economy and society, such as matching industrial structure, matching economic growth and financial agglomeration, matching supply and demand of various types, etc. [16, 17]. In summary, there is a certain theoretical consensus on the matching relationship between the structure of regional logistics system and logistics resources and the matching mechanism, but in terms of the construction of measurement methods, most studies have focused on the selection of specific methods, but neglected the construction of a measurement method system based on the matching relationship and the matching mechanism, lacking the theoretical basis for the use of measurement methods.
This study starts from the logistics equilibrium theory, analyses the matching performance of the regional logistics system structure (RLSS) and logistics resources (LR) in terms of quantity, structure, time and space, and constructs a matching degree measurement model of the matching relationship between the two, aiming to use it to judge the matching degree of the regional logistics system structure designed in reality and the existing logistics resources, as a basis for determining the matching of the two, and to lay the foundation for the subsequent adjustment, optimization or enhancement of the matching relationship between the two. It is also used as a basis for the subsequent adjustment, optimization or enhancement of the matching relationship between the two, so as to eventually converge to a regional logistics equilibrium state, and to provide a new theoretical perspective for regional industrial development and supply chain logistics system upgrading.
Experimental Design
Mechanism and Process Model of RLSS and LR Matching Based on QSST Equilibrium
Analysis of the Model
The establishment of a modern regional logistics system structure should be planned and designed with the objective of maximizing the system’s function, and needs to be underpinned by the various logistics resources required for the establishment of the system structure. The matching of regional logistics system structure and logistics resources includes two aspects : one is the process of planning and designing the system structure according to the functional requirements of the system and the required logistics resources ; the other is the process of matching the existing logistics resources according to the needs of the system structure. The matching of the two is essentially the process of interaction between the above two processes to achieve a balanced state of logistics and maximize the realization of system functions.
Matching Mechanism of the Model
The equilibrium between supply and demand in the system is common in human society, such as the equilibrium between supply and demand in the industrial economy and the equilibrium between supply and demand in the ecosystem. In the construction of regional logistics system, there is also a pair of supply and demand equilibrium relationship, that is, the balance of supply and demand of logistics resources. The regional logistics system is always optimized in the pursuit of the goal of maximizing the system function, and the realization of the system function requires the construction of a certain system structure, and a certain system structure requires various types of logistics resources as the basis, and there must be a long-term, dynamic supply and demand relationship between the demand for such resources and the supply of logistics resources in reality.
Like the supply and demand relationship in other systems, there is an ideal state of supply and demand between the logistics resources required for the establishment of the regional logistics system structure and the logistics resources supplied in reality, i.e. a balanced state of supply and demand between the two. In order to achieve this ideal state, it is necessary to continuously match the regional logistics system structure and logistics resources dynamically, so that the two tend to reach the ideal matching degree under the existing logistics technology level, and then close to the equilibrium of supply and demand between the two.
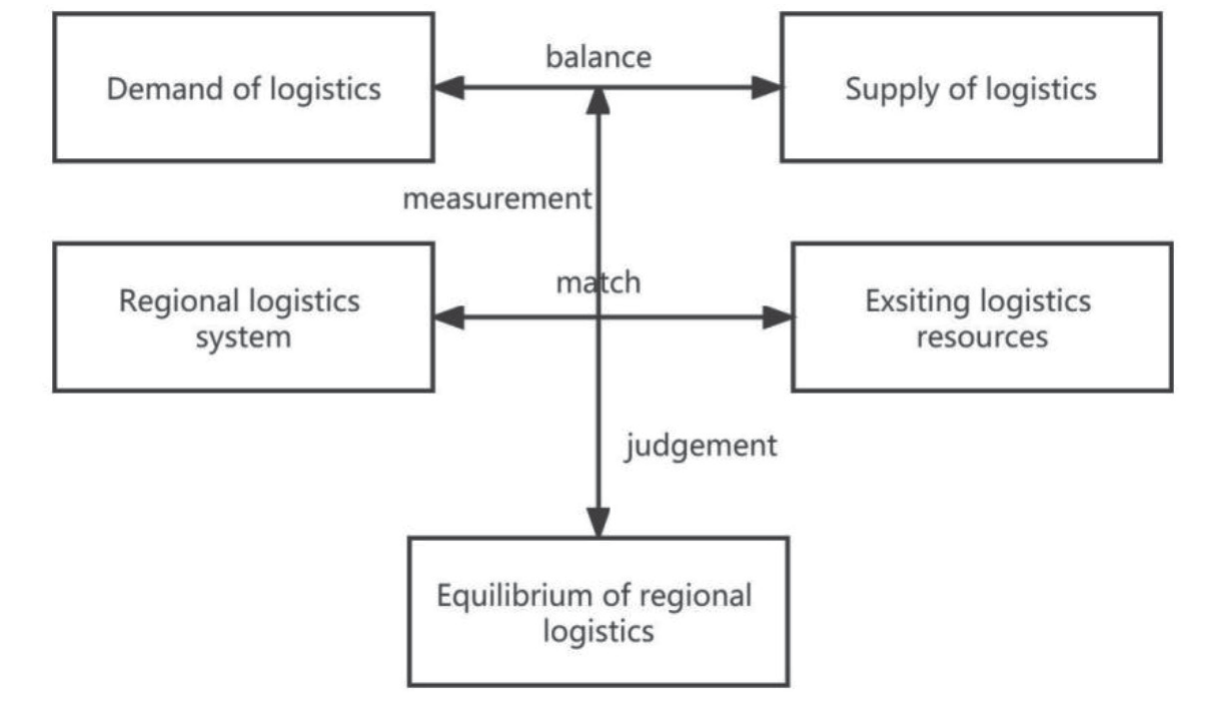
This equilibrium state cannot be achieved by considering the equilibrium between supply and demand in terms of resource quantity or resource time alone. Based on the logistics equilibrium theory, the logistics equilibrium state has to measure the equilibrium of logistics resources in the four dimensions of quantity, structure, space and time (QSST). The theory of logistics equilibrium is to introduce the idea of equilibrium into the field of logistics management, and its significance is to pursue the ideal state of consistent equilibrium between the supply and demand of logistics elements in each process link in the logistics system, so as to realize the equilibrium situation of total supply and total demand of the whole logistics system. The level of logistics technology is the basis of logistics equilibrium, and there are different logistics equilibrium under different levels of logistics technology. Therefore, logistics equilibrium is a dynamic development process, and its state follows the path of “unbalance - equilibrium - unbalance - equilibrium ......” path, from low level equilibrium to high level equilibrium, is continuously developed and optimized.
To sum up, as shown in Fig. 1, there is a supply and demand equilibrium between the regional logistics system structure and logistics resources, and the state of this supply and demand relationship needs to be determined by measuring the degree of matching between the two. If the degree of matching between the two can reach the ideal state of consistent reciprocity, then the system objective of logistics balance can be achieved, and regional logistics balance is an important attribute and judgment criterion to measure the matching degree of regional logistics system structure and logistics resources.
The Establishment of the Model Based on QSST Equilibrium
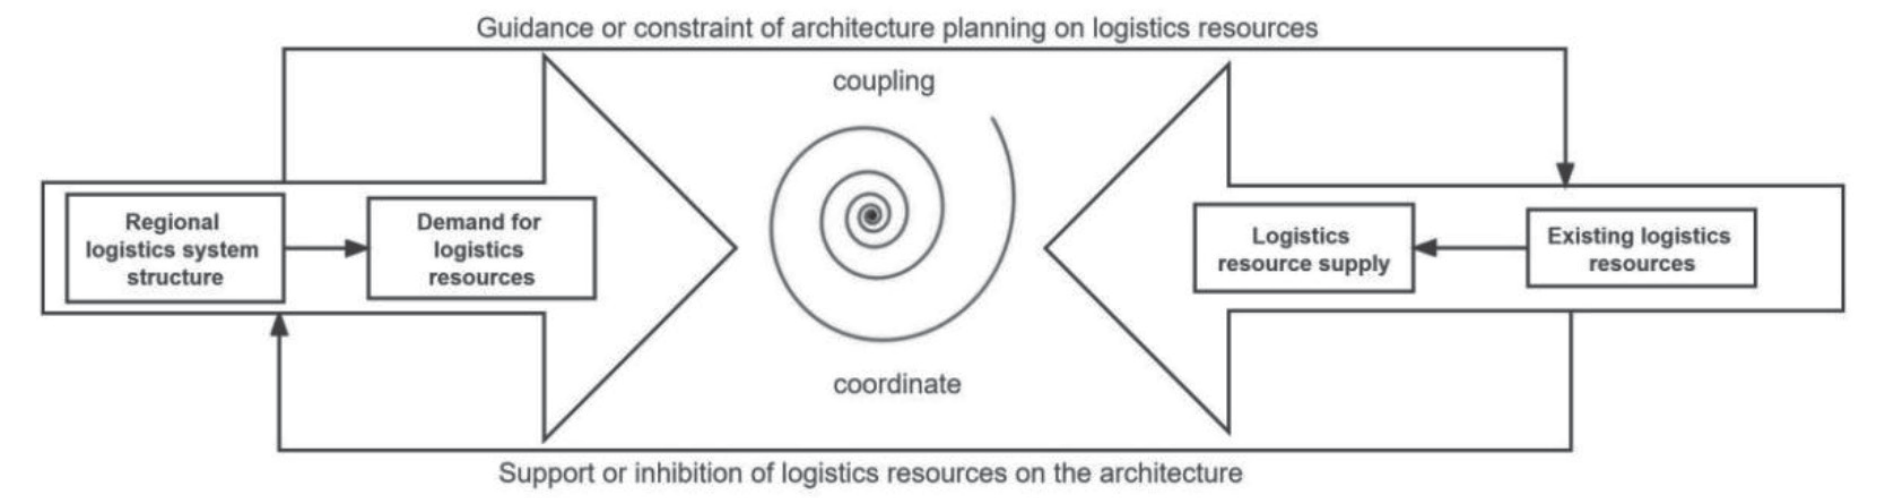
The establishment of a modern regional logistics system structure should be planned and designed with the objective of maximizing the system function, and needs to be based on the various logistics resources required for the establishment of the system structure. The matching of regional logistics system structure and logistics resources includes two aspects: one is the process of planning and designing the system structure according to the requirements of the system function and the required logistics resources; the other is the process of matching the existing logistics resources according to the needs of the system structure in the four dimensions of quantity, structure, time and space of resources. The matching of the two is essentially the process of interaction between the above two processes to achieve a balanced state of logistics and to maximize the realization of the system function.
Resource quantity matching is the basis for realizing the overall matching of regional logistics, it is the matching between the quantity of logistics resources required for the establishment of the system structure and the quantity of logistics resources that can be supplied in reality to take place. When the gap between the two is bigger, the lower the matching of resource quantity; the smaller the gap between the two, the higher the matching of resource quantity ; when the two are exactly equal, the regional logistics system structure and logistics resources achieve the best matching in terms of resource quantity.
The structure is the relationship between the elements. The structure of the regional logistics system and logistics resources not only need to match the quantity of resources, but also need to match the structure of resources according to the requirements of the functional objectives of the system, which is expressed as the difference between the proportional relationship between the various types of logistics resources required by the regional logistics system and the proportional relationship between the logistics resources that can be supplied in reality. When the proportion of various logistics resources owned by the region can meet the proportion of logistics resources required by the logistics system structure, the level of matching between the two resource structures reaches the ideal state. If the ratio of required logistics resources does not match the ratio of available logistics resources, there may be a relative surplus of logistics resources, i.e. the required resources are insufficient and the useless resources are idle.
The spatial matching of resources refers to whether the spatial layout requirements of the regional logistics system structure for the required logistics resources are consistent with the spatial layout of the logistics resources available in reality. When the spatial layout of the two is consistent, this level of spatial matching of resources is ideal. When the spatial layout of the two is inconsistent, the existing logistics resources need to be deployed in accordance with the system structure planning requirements. This spatial allocation of logistics resources needs to be based on the rational setting of road network infrastructure etc.
Resource time matching refers to whether the logistics resources required by the regional logistics system structure can reach the resource demand point within the required time period, which is reflected in the punctuality and efficiency of the existing logistics, i.e. the timeliness of logistics (logistics timeliness index). When the required logistics resources can reach the resource bottleneck point within the required time frame, the time match between the two is ideal. When the required logistics resources cannot be delivered within the required time frame, the time match between the two depends on the size of the difference between the required and the realistic delivery time.
The matching between the structure of the regional logistics system and logistics resources is a matching relationship between the structure of the regional logistics system and the logistics resources inside and outside the region in order to achieve a regional logistics equilibrium and thus maximize the functional objectives of the regional logistics system, and to interact, coordinate and adapt to each other. The degree of matching, i.e. the degree achieved by the matching relationship, is a measure of the level of matching between the structure of the regional logistics system and the logistics resources. The larger the gap between the two, the lower the matching degree; the smaller the gap between the two, the higher the matching degree. The degree of matching can fully reflect the matching situation between the structure of the regional logistics system and logistics resources, so as to guide the development of the two towards a more balanced matching direction, thus realizing a balanced state of regional logistics and making the functional objectives of the regional logistics system optimal.
Based on the above analysis, a conceptual model of regional logistics system structure and logistics resource matching based on QSST equilibrium is constructed, as shown in Fig. 2.
Ideas and Steps for Measuring the Matching Degree of the Model
Based on the above analysis, the measurement system of regional logistics system structure and logistics resources matching based on QSST equilibrium includes two levels of measurement, micro matching and macro matching.
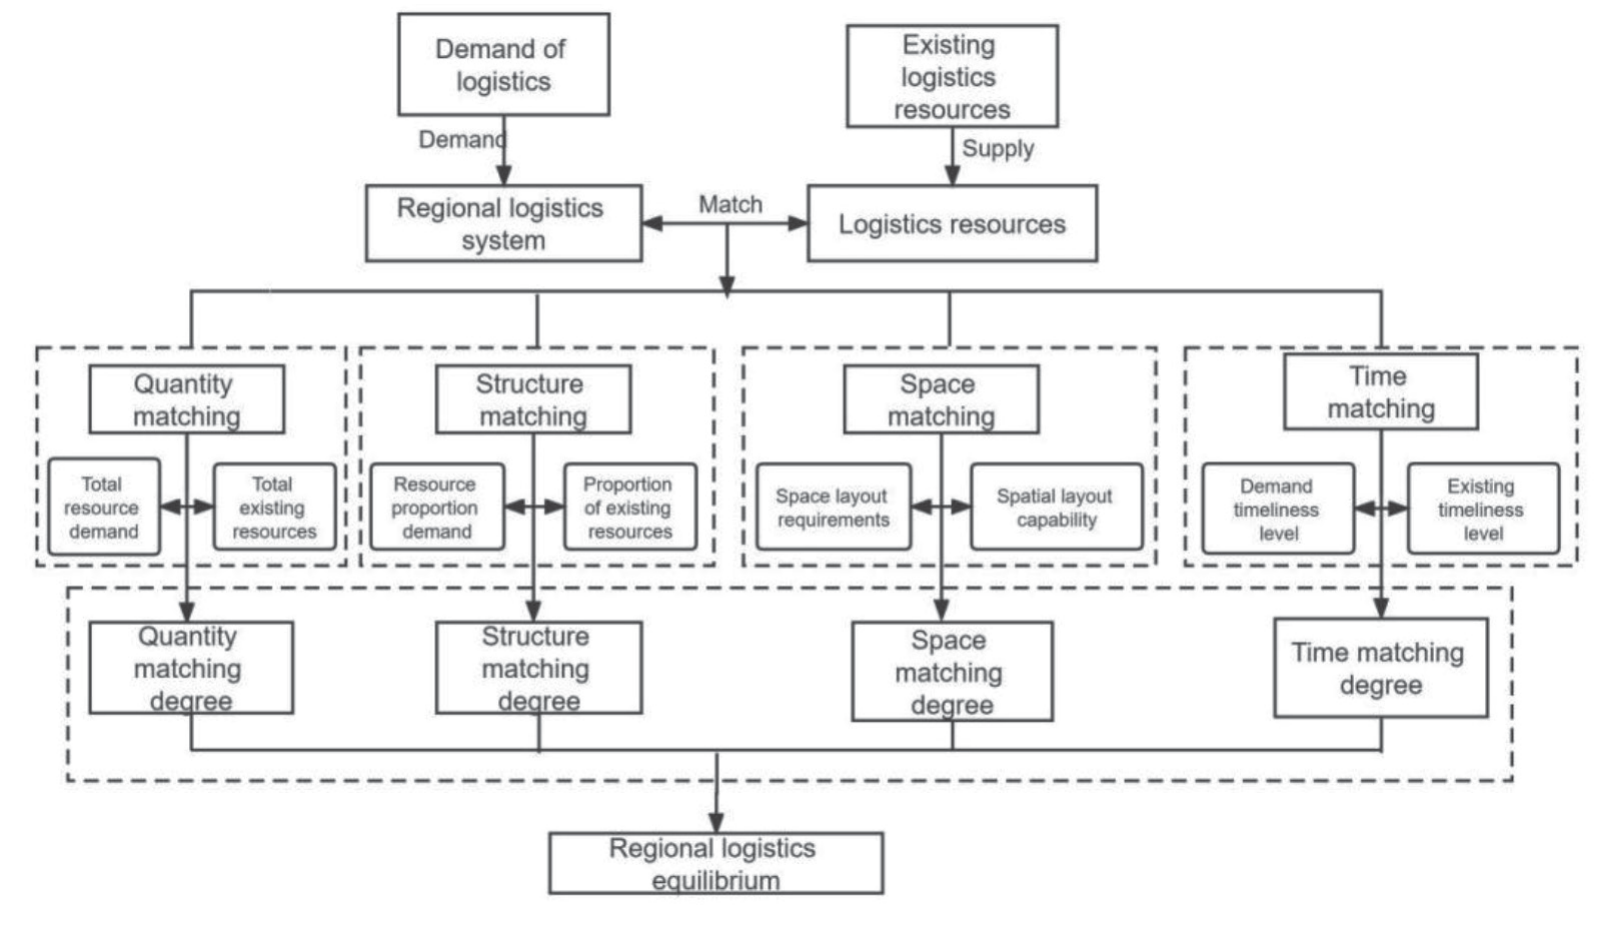
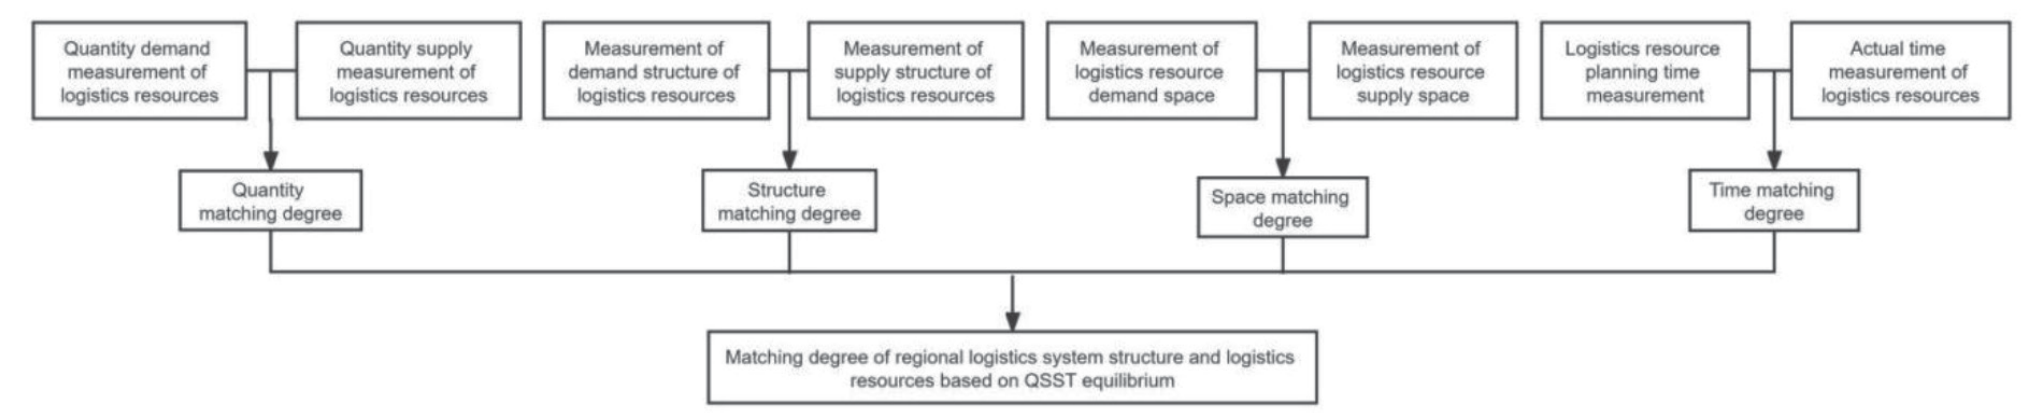
The matching of the two in the four dimensions of quantity, structure, space and time of resource demand and supply is the basis for the overall equilibrium of regional logistics, which is expressed in the degree of closeness between supply and demand. The macroscopic matching of the two is based on the coupling relationship between the two. Coupling is a basic concept in physics, which refers to the phenomenon of interdependence, interaction and mutual influence between two or more systems or elements within a system [18]. They are not simply one-way linear cause-effect relationships, but mutually causal and mutually determining and shaping relationships. As shown in Fig. 3, the coupling relationship between the structure of the regional logistics system and logistics resources is expressed as follows.
(1) The guiding or restraining effect of the regional logistics system structure on logistics resources. Reasonable system structure planning can play a guiding role for logistics resources inside and outside the region, so as to further rationalize the allocation of resources, enhance the efficiency of resource utilization and improve regional logistics efficiency ; unreasonable system structure planning will constrain the function of resources, resulting in waste of resources and increasing regional logistics costs.
(2) The support or inhibition of the regional logistics system structure by the supply of logistics resources. The planning and establishment of the system structure requires matching logistics resources as a basis to ensure the operation of the regional logistics system and the realization of the system’s functional objectives; when the existing supply of logistics resources cannot meet the needs of the system structure, it will have an inhibiting effect on it and hinder the function of the system.
With the overall coupling of the regional logistics system structure and logistics resources, the quantitative, structural, spatial and temporal matching between the two is not fragmented and unrelated. On the contrary, the four matches influence and coordinate with each other. The single pursuit of the highest degree of the four matching degrees does not make the overall matching reach the best, but requires the reasonable allocation of logistics resources under the functional requirements of the regional logistics system, so that the four are coordinated and unified, and finally the overall function can be maximized.
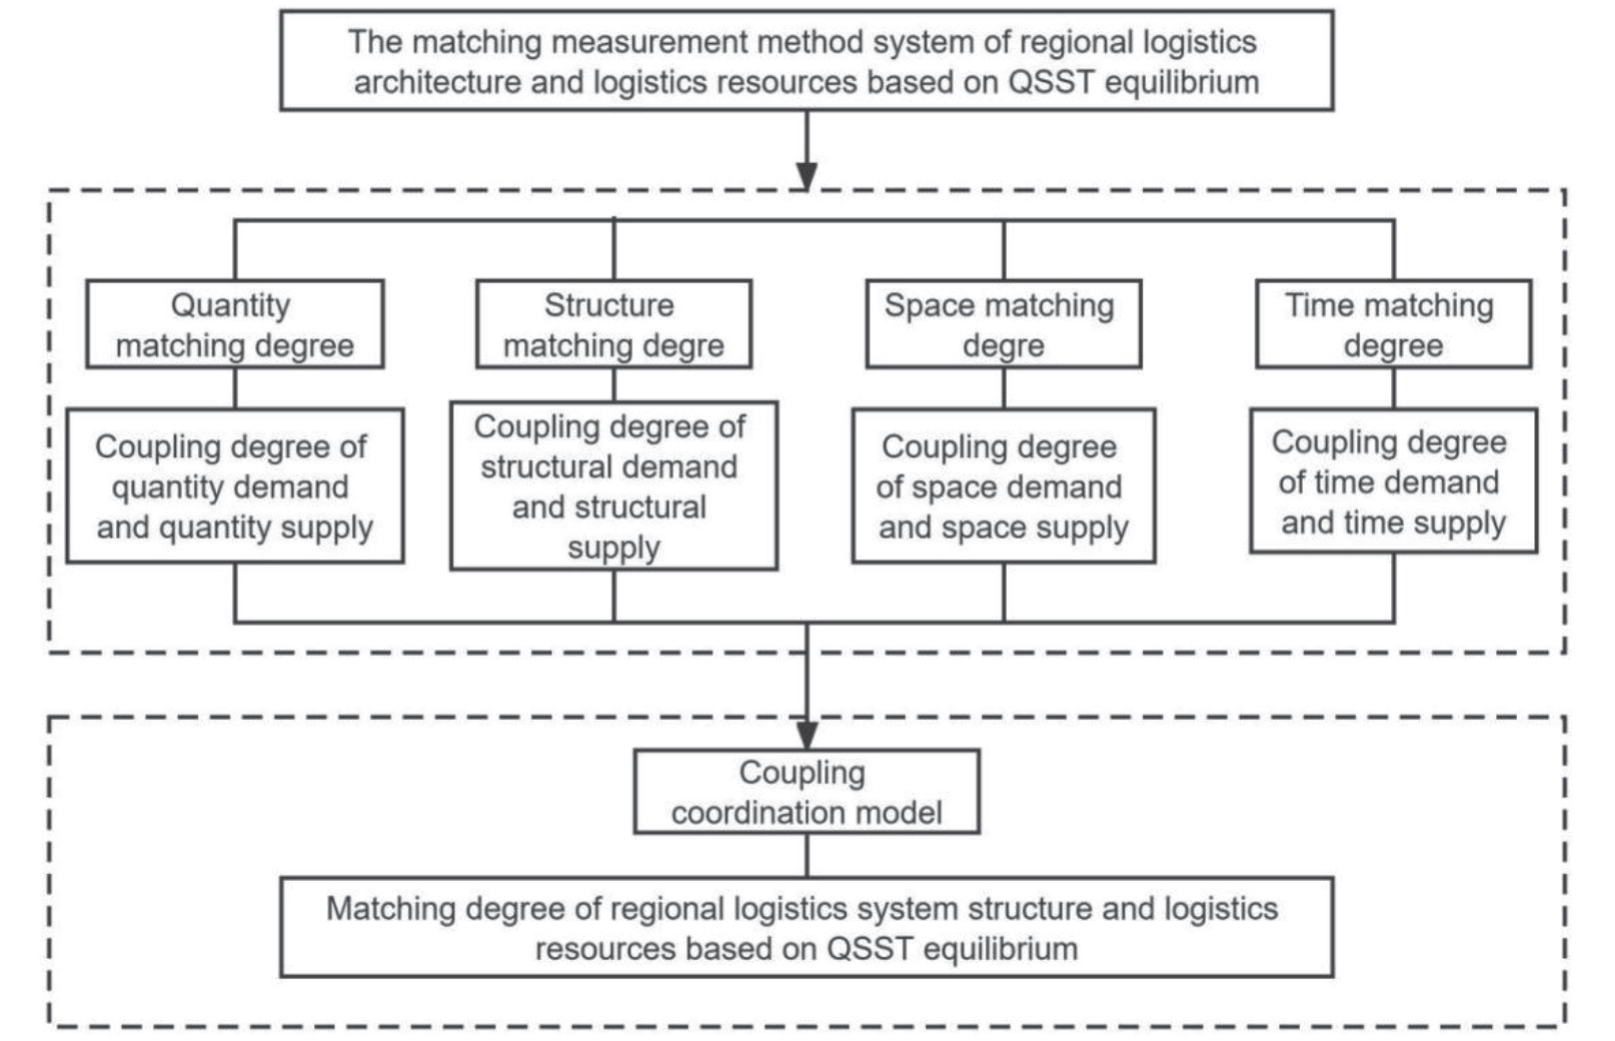
Based on the above analysis to construct a QSST equilibrium-based regional logistics system structure and logistics resources matching degree measurement method system is shown in Fig. 4. The specific measurement steps are shown in Fig. 5.
Matching Degree Measurement Based on QSST Equilibrium
The coupled coordination model uses the degree of coupling to explain the interrelationships between several subsystems and the degree of coordination to provide a comprehensive evaluation of the whole system. The results of this model are intuitive and are widely used in empirical studies of the level of coupling and coordination between systems in various fields, such as the environment, economy and population. However, the traditional coupling coordination model is reduced in the validity of the C-value, therefore, this paper introduces a modified coupling coordination model to measure the overall matching degree [19], increasing the differentiation of the C-value, which is calculated as followed.
Quantity Match Degree
The formula for calculating the quantity match degree between the two is as followed:
Cv1 is the quantity match degree between the two. S1 is the quantity supply of existing logistics resources, and D1 is the quantity demand for logistics resources by the regional logistics system structure.
Structure Match Degree
The formula for calculating the structure match degree between the two is as followed:
Cv2 is the structure match degree between the two. S2 is the structure supply of existing logistics resources, and D2 is the structure demand for logistics resources by the structure of the regional logistics system.
Space Match Degree
The formula for calculating the space match degree between the two is as followed:
Cv3 is the space match degree between the two. S3 is the space supply of existing logistics resources, and D3 is the space demand for logistics resources by the regional logistics system structure.
Time Match Degree
The formula for calculating the time match degree between the two is as followed:
Cv4 is the time match between the two. S4 is the time supply of the available logistics resources, and D4 is the time demand for logistics resources by the regional logistics system structure.
Total Match Degree
The matching degree problem in this study includes four indices of regional logistics system structure and logistics resources in terms of quantity, structure, time and space, i.e. n = 4. According to the previous formulae for quantity match degree, structure match degree, time match degree and space match degree:
(6)
D is the total match degree, T is the comprehensive coordination coefficient, reflecting the contribution of the four to the matching degree D, and taking values in the range of (0, 1). α 1,α2,α3,α4 are respectively the weighting coefficient of Cv1,Cv2, Cv3,Cv4.
Discrimination and Analysis
Cv1 is the gap between the number of logistics resources needed to build the structure of the regional logistics system and the number of existing logistics resources supplied is 0-1. The closer the value is to 1, the smaller the gap between the total demand for logistics resources and the total supply ; the closer the value is to 0, the larger the gap between the total demand for logistics resources and the total supply.
Cv2 is the gap between the structural ratio of logistics resources needed to build the structure of the regional logistics system and the supply structure of existing logistics resources is 0-1. The closer the value is to 1, the smaller the gap between the demand structure and the supply structure of logistics resources ; the closer the value is to 0, the larger the gap between the demand structure and the supply structure of logistics resources.
Cv3 is the gap between the spatial layout of logistics resources needed to build the structure of the regional logistics system and the spatial layout of the existing logistics resources is 0-1.
The closer the value is to 1, the smaller the gap between the demand structure of logistics resources and the supply structure ; the closer the value is to 0, the larger the gap between the demand structure of logistics resources and the supply structure.
Cv4 is the difference between the planned time for the delivery of logistics resources needed to build the regional logistics system structure and the actual time for the delivery of existing logistics resources is 0-1. The closer the value is to 1, the smaller the difference between the planned time for the delivery of logistics resources and the actual time ; the closer the value is to 0, the larger the difference between the planned time for the delivery of logistics resources and the actual time.
The value of D indicates the overall gap between the logistics resources needed to build the structure of the regional logistics system and the existing logistics resources on the basis of the four dimensions of quantity, structure, space and time, and its value ranges from 0 to 1. The closer the value is to 1, the smaller the gap between the two ; the closer the value is to 0, the larger the gap between the two.
Table 1.
Regional logistics system structure and logistics resources matching.
| First level indicators | Second level indicators | Indicator description | Unit |
|---|---|---|---|
| Quantity match degree Cv1 | Total demand of logistics resources D1 | Total social logistics X1 | Trillion |
| Total supply of logistics resources S1 | Freight turnover X2 | Billion tonne kilometers | |
| Structural match degree Cv2 | Demand structure of logistics resources D2 | Manufacturing value added/GDP X3 | / |
| Supply structure of logistics resources S2 | Manufacturing PMI/(Manufacturing PMI+Non-manufacturing PMI) X4 | / | |
| Space match degree Cv3 | Demand space of logistics resources D3 | Density of national-level industrial parks X5 | units/km2 |
| Resident population density X6 | people/km2 | ||
| Supply space of logistics resources S3 | Density of logistics parks above scale X7 | units/km2 | |
| Density of public logistics facilities X8 | km/km2 | ||
| Time match degree Cv4 | Plan time of logistics resources D4 | Logistics punctuality * material flow X9 | / |
| Actual time of logistics resources S4 |
Example Analysis and Discuss
Data Sources and Description of Indicators
In this paper, the relevant logistics data from 2011 to 2020 were selected as the research sample, and the original data were obtained from the China Statistical Yearbook, China Logistics Yearbook, as well as the statistical yearbooks and statistical bulletins of various provinces and cities. Based on the research content of this paper and the previous research results [20- 22], a regional logistics system structure and logistics resources matching index system is designed, including four primary indicators of quantity matching, structure matching, spatial matching and time matching, and eight secondary indicators of total logistics resources demand and total logistics resources supply, etc. The specific description of each indicator is shown in Table 1.
Where the density of public logistics facilities X8 is expressed as the sum of road, rail, air and water transport densities ; the difference between the planned time of logistics resources D4 and the actual time of logistics resources S4 is expressed as the product of the logistics punctuality rate and the material flow rate, i.e.
X8 = road density + rail density + airline density + inland waterway density
X9 = road punctuality*road freight volume/total freight + rail punctuality*rail freight volume/total freight + flight punctuality*air freight volume/total freight + shipping punctuality*shipping freight volume/ total freight2.
Matching Measurement Process
Data Standardization
The common processing methods for data standardization are mainly extreme difference standardization, z-score standardization, deviation standardization and standard deviation standardization,etc. After using the above methods to standardize the data, either 0 or 1 values or negative values appear, and the calculation of matching degree cannot be carried out. Therefore, according to the research needs and data characteristics, this study draws on the deviation coefficient model to standardize the data [23] , which is calculated as followed:
Q denotes the standard deviation value, and denotes the average value.
The formula for standardizing the data in this study is
After processing the raw data, the data of each indicator in the measurement index system of the structure of China’s logistics system and the matching of logistics resources between 2011 and 2020 are shown in Table 2.
Measurement of QSST Degrees
(1) Measurement of quantity match degree. According to Tables 1 and 2, the data of total demand for logistics resources D1 , and total supply of logistics resources S1for each year are derived, as shown in Table 3. The quantity match degree Cv1 is calculated according to equation (4) for each year, as shown in Table 4.
(2) Measurement of structure match degree. According to Tables 1 and 2, the data of logistics resource demand structure D2 and logistics resource supply structure S2 for each year are derived, as shown in Table 5. The data for the indicators selected in this example analysis, D2 and S2 , are all ratio values, which are not suitable for calculation using the upper formula. Therefore, the human capital structure and industrial structure deviation calculation method is used to Cv2 [24]. The structure match degrees of China in each year are shown in Table 6. To facilitate subsequent calculations, the results of Cv2 are shown in Table 7 after the values have been shifted.
(3) Measurement of space match degree. According to Tables 1 and 2, the data of logistics resource demand space D3 , and logistics resource supply space S3 were derived for each year, as shown in Table 8. The space match degree of China Cv3 is calculated for each year, as shown in Table 9.
(4) Measurement of time match degree. According to Tables 1 and 2, the time match degree of China Cv4 can be derived for each year, as shown in Table 10.
Total Matching Degree
This study considers that the quantity, structure, space and time match degree of regional logistics system structure and logistics resources are all equally important in contributing to the overall matching degree D. Therefore, the weight coefficients of the four α1, α2, α3, α4, the total match degree between of China in each year is shown in Table 11.
Table 2.
Data table on indicators of China (2011-2020).
Table 3.
Data tables of total logistics resources demand and supply indicators (2011-2020).
Table 4.
Quantity match degree of China (2011-2020).
| No. | 2011 | 2012 | 2013 | 2014 | 2015 | 2016 | 2017 | 2018 | 2019 | 2020 |
|---|---|---|---|---|---|---|---|---|---|---|
| Cv1 | 0.143650515 | 0.128090601 | 0.040793897 | 0.041865923 | 0.014480429 | 0.013595492 | 0.010810536 | 0.057808336 | 0.1050436 | 0.10078319 |
Table 5.
Data table on indicators of logistics resource demand and supply (2011-2020).
Table 6.
Structure match degree of China (2011-2020).
| No. | 2011 | 2012 | 2013 | 2014 | 2015 | 2016 | 2017 | 2018 | 2019 | 2020 |
|---|---|---|---|---|---|---|---|---|---|---|
| Cv2 | 0.125583171 | 0.097502742 | 0.057056814 | 0.042944516 | -0.006668154 | -0.039420522 | -0.042894121 | -0.046469228 | -0.075444665 | -0.106635516 |
Table 7.
Structure match degree of China (2011-2020).
| No. | 2011 | 2012 | 2013 | 2014 | 2015 | 2016 | 2017 | 2018 | 2019 | 2020 |
|---|---|---|---|---|---|---|---|---|---|---|
| Cv2 | 1.125583171 | 1.097502742 | 1.057056814 | 1.042944516 | 0.993331846 | 0.960579478 | 0.957105879 | 0.953530772 | 0.924555335 | 0.893364484 |
Table 8.
Data table of demand space and supply space indicators (2011-2020).
Table 9.
Space match degree of China (2011-2020).
| No. | 2011 | 2012 | 2013 | 2014 | 2015 | 2016 | 2017 | 2018 | 2019 | 2020 |
|---|---|---|---|---|---|---|---|---|---|---|
| Cv3 | 0.256480424 | 0.165959415 | 0.15614925 | 0.135794676 | 0.069077031 | 0.054810859 | 0.003034422 | 0.024967225 | 0.093156759 | 0.186137736 |
Table 10.
Time match degree of China (2011-2020).
| No. | 2011 | 2012 | 2013 | 2014 | 2015 | 2016 | 2017 | 2018 | 2019 | 2020 |
|---|---|---|---|---|---|---|---|---|---|---|
| Cv4 | 0.99874110 | 1.002881767 | 0.979968577 | 0.972125608 | 0.965506429 | 0.986792335 | 1.035135952 | 1.041795155 | 1.019494456 | 0.997558621 |
Table 11.
Total match degree of China (2011-2020).
Analysis of Results
The measured four match degrees and the total match degree are shown in Table 12 and Fig. 6.
Analysis of the Current Situation
China’s logistics industry has entered a period of rapid development since its accession to the WTO. The main contradiction in the development of China’s logistics industry has changed evolving from the contradiction between the demand for logistics and the inadequate supply of logistics services to the contradiction between the demand for logistics and the inadequate, uncoordinated, unbalanced and unsustainable development of logistics for high-quality and efficient economic development [25]. In 2012, the total cost of logistics in China In 2012, China’s total logistics costs were 18% of GDP, double the proportion of developed Western countries. Influenced by the sloppy economic development and unreasonable industrial structure, China’s logistics industry also has problems such as sloppy development, unreasonable structure and weak competitiveness. In order to transform the development of the logistics industry and achieve cost reduction and efficiency, the medium and long-term plan for the development of the logistics industry (2014-2020) (hereinafter referred to as the “medium and long-term plan”) was introduced in 2014, and the fundamental and strategic status of the logistics industry was reflected. in September 2018, the National Development and Reform Commission and the Ministry of Transport jointly issued the “National Logistics Hub Layout and Construction Plan” (hereinafter referred to as the “Plan”), the “Plan The Plan points out that by 2020, through optimization and integration, functional upgrading, the layout and construction of about 30 national logistics hubs with strong radiation-driving capacity, high level of modern operation and close interconnection; by 2025, the planning and construction of 212 national logistics hubs; by 2025, the layout and construction of about 150 national logistics hubs, to promote the total cost of logistics to GDP ratio of the whole society. By 2035, the basic formation of a national logistics hub network compatible with the modernized economic system. As can be seen, China’s logistics industry has gone through a stage of development from rough development to rational layout, aiming to guide the logistics industry on the fast track of high-quality development.
Matching Trend Analysis
(1) Overall trend analysis. As can be seen from Fig. 5, the overall matching degree (D) between the
Table 12.
Four match degrees and total match degree (2011-2020).
Fig. 6.
Trend of the matching degree between China’s logistics system structure and logistics resources (2011-2020).
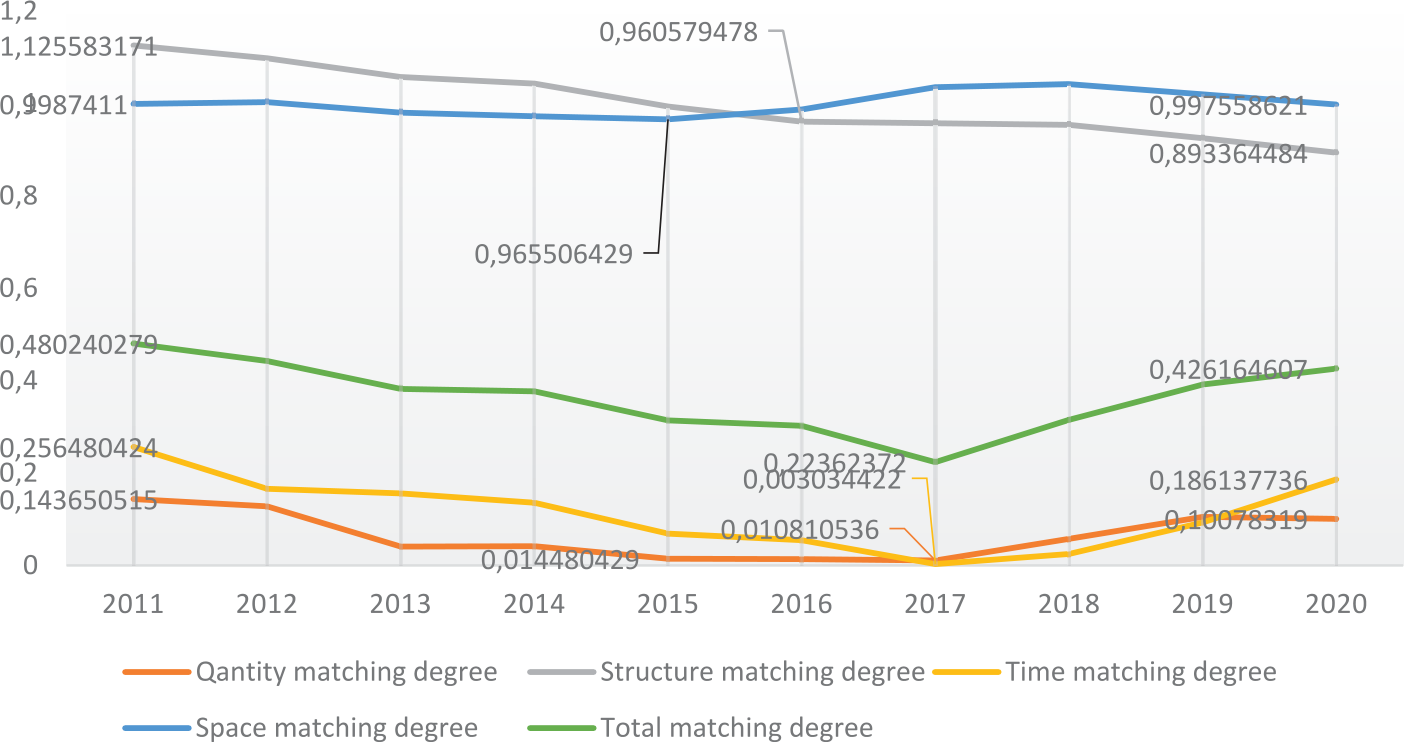
structure of China’s logistics system and logistics resources between 2011 and 2020 shows a first decrease and then an increase. Among them, the quantity, structure, spatial and temporal matching degree (Cv1, Cv2, Cv3, Cv4) of China’s logistics system structure and logistics resources between 2011 and 2017 all show a downward trend, resulting in the overall matching degree of the two decreasing during this time period. In reality, China’s logistics industry has not really played a role in promoting the rapid development of the national economy at this time. Therefore, revealing the change in the growth mode of the logistics industry, optimizing the structure of the logistics system and reducing costs and increasing efficiency have become important issues that need to be addressed urgently. Since 2017, all values except for the structural matching degree (Cv2) have changed from down to up, showing an upward trend, a change made possible by the establishment of the country’s strategic position for logistics sustainable development.
(2) Trend analysis of quantity match. Taking 2015 as the boundary, the quantity matching degree between 2011 and 2015 showed a stepwise decline. Based on the analysis of the real situation, the development of China’s logistics industry during that period was not sufficient, the demand for logistics and the supply of logistics services were extremely unbalanced in terms of quantity, and the logistics industry was developed in a sloppy manner with high logistics costs. With the introduction of the Medium and Long Term Plan, the status of the logistics industry in the national economy has continued to rise, the investment in infrastructure and other facilities in various regions has increased, the supply of logistics services has gradually met the social logistics demand, and the decline in quantity matching has gradually weakened and rebounded by 2017. This is also in line with the general law of development of demand and supply under market economy conditions, i.e. the number of logistics resources required for the structure of the logistics system is the first to be met. 2018 saw the introduction of the Plan, which helped China’s logistics industry to further develop with high quality, and the matching of the structure of the logistics system with the number of logistics resources also took the lead in steadily enhancing the stage.
(3) Trend analysis of time match. Similar to the development trend of quantity matching degree, taking 2017 as the boundary, the quantity matching degree showed a stepwise decline between 2011 and 2017. This indicates that along with the shortage of quantity matching, the time-efficient supply of logistics resources naturally cannot meet the time-efficient demand of the logistics system structure, which shows the same direction of the development trend of quantity matching and time matching. Similarly, when the quantity match is first satisfied, the time match between the system structure and logistics resources is no longer constrained by it, and the time match between the two also increases and shows an inflection point since 2017.
(4) Trend analysis of space match. From an overall perspective, the development trend of spatial matching is the most moderate, which also illustrates the regional characteristics of logistics development. From a macro perspective, logistics is always expressed as the “circulation of goods” within a certain zoning area, i.e. with the continuous development of the regional economy, logistics is bound to develop towards the functional goal of satisfying the “circulation needs of goods” within the spatial area of the region. Therefore, the standard deviation of spatial matching is the smallest among the four matching steady improvement of the spatial matching degree.
(5) Trend analysis degrees. Combined with the real situation analysis, the release of the 2015 Medium and Long Term Plan is conducive to the optimization
of China’s logistics spatial layout and the
construction of logistics infrastructure, promoting
the structure match. The structure match degree
has shown a decreasing trend since the beginning.
On the one hand, with 2017 as the cut-off point, the
structure of China’s logistics system and logistics
resources in terms of quantity, time, spatial matching
and overall matching all show a downward and then
upward development trend between 2011 and 2020.
The structural match, on the other hand, is declining,
and is not in sync with the overall matching trend.
This indicates that the structural matching between
the structure of China’s logistics system and logistics
resources is the key consideration for optimizing the
matching relationship between the two in the next
phase. On the other hand, although the state has
issued several planning documents at the strategic
level since 2014, the restructuring of logistics
resources is a long-term, slow and global process,
and its effects will inevitably take some time to
emerge, which is an important element that this
study will continue to focus on.
Conclusions
This paper addresses the issue of the regional logistics system structure’s demand for logistics resources and the effective supply of regional logistics resources, and conducts a thorough study on the measurement of the matching degree between the two, proposing a logistics equilibrium-based regional logistics system structure and logistics resources matching degree measurement model and measurement method design under the perspective of demand and supply. The main research findings are as follows: (1) The match degree of regional logistics system structure and logistics resources is expressed as the equilibrium degree between the logistics resources required by the system structure and the supply of existing logistics resources, and the matching of the two is to achieve a regional logistics equilibrium state for sustainable development. (2) Based on the matching relationship model between the regional logistics system structure and logistics resources, the matching degree of the two contains four sub-matching degrees : quantity, structure, space and time. (3) Based on the logistics equilibrium attributes and coupling coordination relationship between the two, this study proposes a measurement model and measurement method system for the matching degree of the regional logistics system structure and logistics resources.
(4) The results of the analysis of data related to the structure of logistics system and logistics resources in China from 2011 to 2020 confirm that the measurement model is basically correct and the structural mismatch between the two is an important element that needs to be addressed in China’s logistics industry.
The research in this paper is a major theoretical and methodological expansion and innovation in the study of the regional logistics system planning, system functional objectives and logistics resource matching, and is of guidance in analyzing the real-life problems such as the unreasonable structure of the regional logistics system, the difficulty in fully realizing the functional objectives of the system and the sustainable use of logistics resources, and lays the foundation for the next step in determining the matching of the regional logistics system structure and logistics resources.

