

Introduction
Since the reform and opening-up, China’s economy has experienced rapid growth and its industrial added value has jumped to first place in the world [1]. In 2010, China overtook Japan to become the world’s second largest economy [2]. However, the rapid pace of economic growth in China is accompanied by serious environmental pollution problems [3, 4], especially industrial pollution, which poses major challenges to the sustainable development of the economy [5]. Fossil energy is the main source of pollutant emissions. According to the China Energy Statistical Yearbook, taking 2019 as an example, China’s industrial energy consumption accounts for 66% of the total annual energy consumption, and in particular the manufacturing industry accounts for 83% of the total industrial energy consumption, making manufacturing the main share of China’s energy consumption. In addition, taking air pollution caused by industry as an example, the “China Statistical Yearbook on Environment in 2020” compiled by the National Bureau of Statistics and Ministry of Ecology and Environment shows that industrial sulphur dioxide emissions accounted for 86% of the country’s total sulphur dioxide emissions, industrial nitrogen oxide emissions accounted for 44% and industrial particulate matter emissions accounted for 85% in 2019. The “2020 Global Environmental Performance Index” released by Yale University shows that among the 180 countries participating in the ranking, China ranks only 120th in environmental performance, with a very low score of 37.3. Therefore, reconciling environmental protection with long-term economic growth is the key to sustainable development [6]. It is urgent, then, that China needs to achieve industrial green transformation, especially for the green transformation of manufacturing industry, which is the process of industry towards coordinating the development of economy, resources and ecological environment. In this regard, improving industrial green total factor productivity (GTFP) is an important metric for assessing the quality of economic growth.
The GTFP can better revise the traditional total factor productivity (TFP), and evaluate economic growth more comprehensively and truly. The measurement of traditional TFP is based on labor, capital inputs, and several desired outputs. However, it ignores the consideration of either energy or undesired outputs [7-8]. If they are missing, this can lead to a distorted assessment of productivity growth. This limitation can be easily solved by the GTFP, which can be regarded as an improved TFP under environmental constraints [9]. The GTFP can reflect the resource consumption and environmental costs when energy and environment become the main constraints to economic growth. Improving GTFP also means a dynamic strategy that promotes productivity growth while improving environmental performance. Therefore, some scholars conducted several studies focused on measuring green productivity growth to assess the sustainability of the economy [1, 10-14].
In order to achieve green growth and protect the environment, China has implemented a wide range of environmental regulation policies to control the negative externalities associated with environmental pollution caused by manufacturing enterprises [1, 15]. If there is no external pressure, such as the government’s environmental regulations, the manufacturing enterprises may not take the initiative to take environmental protection and pollution control measures. The government’s environmental regulation, which represents a kind of external constraint force on manufacturing enterprises, needs to simultaneously improve economic growth and environmental performance. However, can environmental regulation fix a market failure (externality) and promote GTFP in manufacturing? This is controversial. On the one hand, the implementation of environmental regulations will undoubtedly increase the costs for manufacturing enterprises, weakening enterprises’ market competitiveness under the assumption that other conditions remain unchanged [16]. To meet the government’s environmental standards, manufacturing enterprises need to upgrade their production facilities or spend more on pollution control. The effect of compliance costs is likely to crowd out capital investment in research and development (R&D), which is not beneficial to improving green innovation capabilities [17]. A lack of technological innovation may make it difficult to improve GTFP. However, on the other hand, the Porter hypothesis indicates that reasonable environmental regulation will encourage enterprises to innovate in green technology and improve their productivity and competitiveness [18]. The triggered innovation could partially or more than fully offset the compliance costs of regulation, which is called the effect of innovation offset. If the effect of innovation offset outweighs the effect of compliance costs, the enterprise’s productivity will be enhanced. The ability to increase the level of green technology innovation relies on the mutual game of the effect of compliance cost and innovation offset. Thus, the impact of environmental regulation on GTFP will be controversial. It may be positive, negative, or uncertain.
There is a question here: Why do environmental regulations have different impacts on GTFP? This may be because environmental regulations represent only an external constraint that companies are exposed to in the production and operation process. The enterprise’s internal force is competition ability by using technology, products, and services to survive in the fierce market competition. Thus, market competition can be an important factor in regulating the link between environmental regulations and GTFP. In theory, a competitive market can make resource allocation reach the state of Pareto efficiency, and increase resource allocation efficiency and TFP. Moreover, the survival of the fittest mechanism of market competition can stimulate enterprises to escape from the effect of market competition, thereby boosting the productivity of enterprises. Although market competition can be the internal motivation to stimulate enterprises’ continuous innovation, it will inevitably make the innovation rent of enterprises dissipate round after round, which hurts enterprises’ further innovation and improvement of productivity. Thus, the paper will deeply discuss the impact of market competition and environmental regulation on GTFP.
Using the panel data of 28 major manufacturing industries in China from 2003 to 2016, this paper employs Data Envelopment Analysis (DEA) to measure GTFP in the manufacturing industry. Different from previous studies, this paper uses the global frontier MML (Metafrontier-Malmquist-Luenberger) index, which is based on the Epsilon-Based Measure (EBM) model combining radial and non-radial properties, to measure the GTFP. This approach can not only solve the intertemporal unsolved problem of the traditional ML (Malmquist-Luenberger) index but also investigate the heterogeneity of the manufacturing industry. Second, this paper investigates the impact of environmental regulations and market competition on GTFP, and the combined effect of the two on GTFP. Third, under what conditions that the two form a combined positive effect on improving GTFP is analyzed.
The contribution of this paper has three points. First, this paper uses the global frontier MML index, which is based on the EBM model, to measure the GTFP. This approach can supplement the existing literature on measuring the GTFP. Second, in the context of China, this paper studies the relationship between environmental regulations and GTFP from the perspective of market competition and investigates the combined effect of environmental regulations and market competition. This can break through the conclusion of promoting, inhibiting, and neutral regulation effect from the pure perspective of environmental regulations, attracting scholars to pay attention to the endogenous role of market competitiveness, which can explain the reality of diversification. Third, the discussion on the condition, under which the combined effect of environmental regulations and market competition can better play the role of promoting GTFP, can further provide empirical reality for the government’s environmental regulations and market-oriented reform in China.
The remainder of the paper is arranged as follows. Section 2 reviews the literature. Section 3 shows the material and methods in this paper. Section 4 presents the empirical results and discussion. Section 5 is devoted to the conclusion of this paper and provides related policy implications.
Literature Review
For the relationship between environmental regulation and GTFP, there are abundant efforts in the literature to be made to explore their relationship. Some scholars think that environmental regulation can boost increases in GTFP. By using an improved ML productivity index to measure the green productivity growth of China’s manufacturing sector, Li and Lin [19] found that environmental regulation in China would increase green productivity in manufacturing. Inmaculada et al. [20] tested the Porter hypothesis using data from 14 OECD countries. They showed that environmental regulation had a beneficial effect on TFP and more stringent environmental regulations could help improve energy efficiency. Cheng and Kong [1] estimated the industrial GTFP from 2000 to 2019 in 30 Chinese provinces and found that environmental regulations favored the growth of GTFP. Zhang et al. [21] and Luo et al. [22] also found that environmental regulation positively affected the growth of GTFP in China.
Another branch of literature postulates that environmental regulations hinder the improvement of GTFP. Yang et al. [23] investigated the effect of China’s carbon intensity constraint policy on green production performance and found that it hindered the improvement of green production performance. Tang et al. [24] reexamined the Porter hypothesis by using China’s “Two Control Zone” as a quasi-natural experiment. They showed that command-and-control environmental regulation inhibited the growth of enterprise total factor productivity. Zheng and Chen [25] measured the interprovincial GTFP in China and showed that environmental regulation inhibited the increase in GTFP.
While some other scholars put forward that there is a nonlinear relationship between environmental regulations and GTFP, or that the effect that environmental regulations have on GTFP is uncertain. Wang and Shen [26] adopted the GML index to measure China’s industrial productivity by considering environmental factors and showed that the degree of environmental regulations had an “inverted U–shaped” relation with productivity. Zhao et al. [27] tested the effect of environmental regulations on the total factor productivity of China’s carbon-intensive industries, and they also found a significant inverted U-shape relationship between them. Zheng et al. [28] examined the relationship between environmental regulation and economic efficiency by using data from 11 coastal provinces and cities in China and found a U-shaped relationship between them. From the spatial dimension perspective, Jiang et al. [29] found a linear, nonlinear (U-shaped or inverted U-shaped) or nonsignificant relationship between environmental regulation and its GTFP in Chinese cities.
For the role of market competition in China, China has adopted progressive economic reform since the beginning of its reforms and opening-up in the late 1970s, unlike the radical reforms in the Soviet Union and Eastern Europe. Such reform makes the influence of market competition on resource allocation gradually enhanced. In the context of China, few scholars have studied whether market competition regulates the relationship between environmental regulations and GTFP. Though some scholars have examined the factors that affect green productivity growth in China, such as economic scale, green finance, technology innovation, technical progress, agglomeration, environmental decentralization, and structure [8, 13, 30-32], how does market competition affect GTFP? Will the differences in market competition lead to different effects of environmental regulations on GTFP? If environmental regulations have the innovation incentive effect, can they become a choice for enterprises to enhance their market competitiveness, so the internal force of market competition and the external constraint force of environmental regulations can combine to promote the improvement of GTFP more effectively? The answers to these questions remain uncertain, and clarifying these questions is the core of this paper.
Material and Methods
Using DEA to Measure GTFP
DEA is a data-driven performance evaluation method and does not require the production function to be specified, thus it is often used to evaluate the relative efficiency of decision-making units (DMUs) with multi-output and multi-input. Conventionally, DEA methods mainly include the radial model and the non-radial model, which can be used to construct the nonparametric productivity index to measure DMU productivity change over time. However, the above models have some shortcomings in measuring productivity. In the radial model, inputs and outputs need to move in the same proportion towards the production frontier, which deviates from the reality that DMUs often do not move in the same proportion to the optimal target value. Non-radial (Slacks-Based Measure) SBM model can overcome the above defects by making the inputs and outputs move to the optimal target value with different slack values, but the SBM model aims to maximize the inefficiency of inputs or outputs in the process of performance evaluation, which is contrary to the original intention of the evaluator to reach the production frontier with the shortest distance. To make up for the deficiencies of the above two models, the Epsilon-Based Measure (EBM) model was proposed by Tone and Tsutsui [33], which combines the features of the radial model and non-radial model. Therefore, this paper will build a productivity index based on the EBM model to measure GTFP.
On the other hand, most scholars use the Malmquist-Luenberger (ML) productivity index to measure GTFP. But adjacent cross-reference Malmquist model was adopted in the ML productivity index, causing no transitivity in this index, namely ML(2,1)*ML(3,2)≠ML(3,1).1 The ML index also faces a potential linear programming infeasibility problem in measuring cross-period directional distance functions. The global Malmquist-Luenberger (GML) Productivity Index proposed by Oh [34] can better resolve these problems. Moreover, group heterogeneities need to be considered in the process of measuring GTFP. Ignoring the DMUs’ heterogeneity can yield biased measures of productivity growth. Therefore, based on a metafrontier approach, Oh [35] incorporated group heterogeneities to measure the environmentally sensitive productivity growth and called it the Metafrontier-Malmquist-Luenberger (MML) productivity index.
In this paper, the EBM model will be utilized to construct the MML productivity index to measure GTFP based on the global production possibility set, which is one of the distinctive features of this paper. The non-oriented and variable returns-to-scale EBM model including undesirable outputs is as follows:
(1)
In the above function,
The MML index defined on the global technology set and its decomposition are as follows:
(2)
Where
Group Division and Index Section
When measuring the GTFP based on the MML index, DMUs need to be grouped. Since GTFP reflects the change of resource and environment-friendly technology and the basic technological level of the manufacturing industry can also influence its development of green technology, this paper follows the study of Li et al. [36] and divides 28 major manufacturing industries into three groups: low, medium and high technology manufacturing industries.2 The results are shown in Table 1.
With reference to the existing literature [16, 37], the specific input variables, desirable output variables, and undesirable output variables are described below:
(1) Input variables. The manufacturing capital, employment and energy consumption are considered in the model. The capital uses the net value of fixed assets of manufacturing industries as a proxy variable, and uses the fixed asset investment price index (the base period is 2003) to deflate the data. That is, the data is transformed into the constant price in 2003. The employment is represented by the annual average number of persons employed in the manufacturing industries. The energy consumption is expressed by the total energy consumption of every manufacturing industry. These data are obtained from China Industry Statistical Yearbook and China Energy Statistical Yearbook.
(2) Desirable output variable. The industry’s gross industrial output value for every manufacturing is utilized as the desirable output variable. Since the data on gross industrial output value is not available after 2012, the following formula is used in this paper to calculate the gross industrial output value: Gross industrial output value = Industrial sales output value/product sales rate. The data is also converted into the constant price in 2003 by using the producer price indices for industrial products. The data is obtained from the China Industry Statistical Yearbook.
(3) Undesirable output variables. Industrial waste water discharged, industrial waste gas emission, industrial sulphur dioxide emission, industrial soot (dust) emission, and industrial solid wastes generated are used as the model’s undesirable output variables. The data are obtained from the China Statistical Yearbook on Environment.
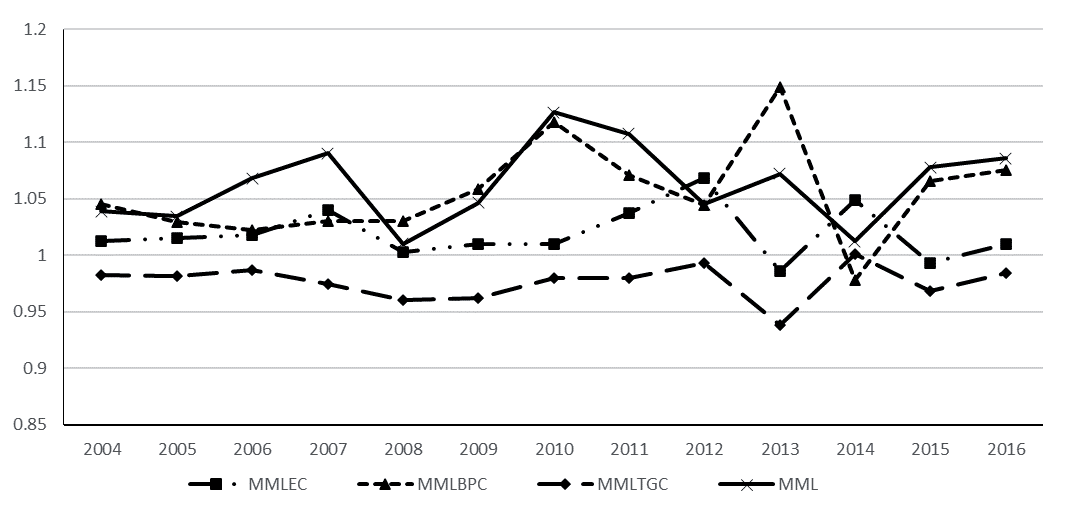
Fig. 1 shows the change trend of GTFP and its decomposition components in China’s industry. Regarding productivity change, GTFP fluctuates greatly, but it still has made progress during the sample period, with an overall average of 1.0628 in the result of MML. The paper further analyzes the components of productivity growth. On the whole, the line of MMLBPC is located at the top among the lines of MMLEC, MMLBPC, and MMLTGC, indicating that the progress of green technology plays an important role in contributing to the improvement of GTFP. The line of MMLEC is located between the line of MMLBPC and MMLTGC while the line of MMLTGC is located at the bottom. Moreover, the overall average of MMLEC, MMLBPC, and MMLTGC are 1.0195, 1.0554, and 0.9766 respectively, indicating the technical progress, efficiency improvement of green technology, and that the gap between the global and the green technology frontier of industry group has been enlarged.
Table 1.
Group division of manufacturing industries
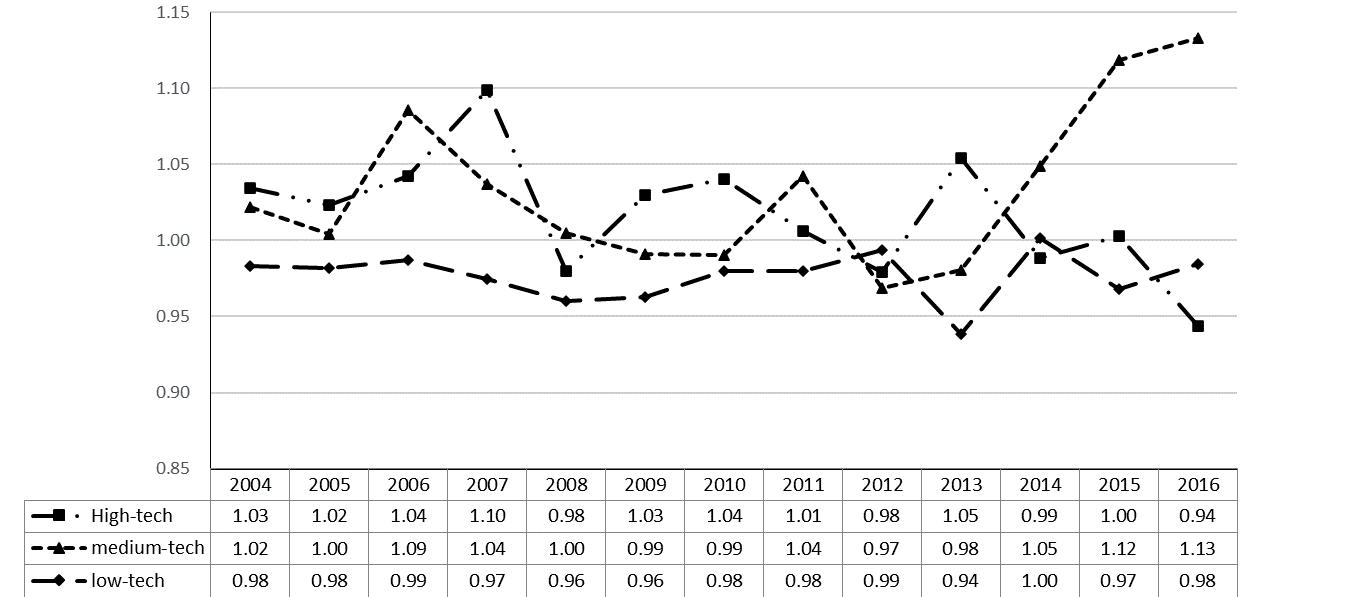
To further analyze the green technical leadership effect of a specific group, Fig. 2 shows the change trend of MMLTGC in high-tech, medium-tech, and low-tech industries. On the whole, the line of high-tech and medium-tech industries is located above the low-tech industry, and most high-tech and medium-tech industries’ averages of MMLTGC during the sample period are greater than 1. This implies that green technology is dominated by the high-tech and medium-tech industry, especially by the medium-tech industry because the overall average of the medium-tech industry, 1.0329, is greater than 1.0172 of the overall average of the high-tech industry. Most low-tech industries’ averages of MMLTGC during the sample period are less than 1, suggesting a decline in the technological levels of low-tech industries relative to global green technology progress.
Econometric Model Establishment
According to previous studies, there may be a nonlinear relationship between environmental regulations and GTFP. Therefore, the dependent variable (GTFP), core explanatory variables environmental regulation (ER), and its quadratic term (Sqr_ER) are added to the model. Considering that GTFP may also be affected by the other variables, that is control variables (Control), the paper firstly constructs the following regression model:
To analyze the moderating effect of market competition on GTFP under the influence of environmental regulation, the market competition (MC) and its interaction term with environmental regulation (MC*ER) are added to the Eq. (3). The following model can be obtained:
Where i represents the manufacturing industry, t represents time. αi and βi are the coefficients of the variables. Industry and time fixed effects are captured by μi and σt respectively. And εit is the disturbance term.
Variable Description
Dependent Variable: Green Total Factor Productivity (GTFP)
The paper uses the global frontier MML index, which is based on the EBM model, to estimate the GTFP of China’s manufacturing industry.
Core Explanatory Variables
Environmental regulation (ER): referring to the research of Zugravu and Kheder [38], the ratio of gross industrial output value to the total energy consumption is utilized to measure the environmental regulation intensity of each manufacturing industry. This index can better describe the real impact of the government’s environmental measures. Moreover, a higher value of this index suggests that the government has stricter environmental regulation measures on the manufacturing industry.
Market competition (MC): referring to the research of Shi et al. [37], the PCM (Price-Cost Margin), which can be obtained by using the formula
Control Variables and Data Sources
This paper also introduces other explanatory variables as control variables. Especially, following the previous literature [16, 37], the natural logarithm value of the difference between the sales value of industry and the delivery value of industrial exports, the proportion of the export delivery value of each manufacturing industry in the total export delivery value, and the ratio of interest expense to fixed assets value are used to represent the home market scale (HMS), trade participation (TP) and industry capital level (ICL), respectively. In general, the increase in the size of the home market scale can stimulate technological innovation and improve productivity. For TP, the stronger the international competitiveness of an industry is, the more advanced the technical level of an industry will be. For ICL, the industry capital level can affect R&D investment, which will affect technological innovation and industry productivity. Additionally, the natural logarithm value of revenue from principal business measures the industry scale (IS), which affects its output and pollution emissions. The ratio of fixed assets value to total assets is used to indicate the level of asset specificity (AS), which will also have a certain impact on the decision-making of the enterprise’s R&D investment. The proportion of the state-owned capital in total paid-in capital is taken to express the level of state-owned assets (SOA). In general, private enterprises face greater pressure from market competition than state-owned enterprises. To be able to survive in the fierce market competition, it has more strong motivation to improve its productivity level.
Table 2 summarizes the descriptive statistics of the variables included in this paper. 28 major manufacturing industries in China are included as the research samples during the period from 2003 to 2016 and the data for each variable are obtained from the China Industry Statistical Yearbook, China Statistical Yearbook on Environment, China Energy Statistical Yearbook, and China Labour Statistical Yearbook. 3
Results and Discussion
Estimation Result of the Basic Model
Since the panel data may suffer from inter-group heteroskedasticity, intra-group autocorrelation, and inter-group cross-sectional correlation and these problems can influence the quantitative methods that this paper chooses, the test for the above problems needs to be first analyzed, as shown in Table 3 below. According to the results of relevant statistical tests, the panel data used in this paper has inter-group heteroskedasticity, intra-group autocorrelation, and inter-group cross-sectional correlation. The Hausman test is further taken to determine whether the fixed effect model or random effect model is used. Since the statistical value of the Hausman test is 38.00 and its P value is 0.0001, the null hypothesis that the random effect model should be used is rejected at the significance level of 1%. Thus, the fixed effect model that corrects the problems of inter-group heteroskedasticity, intra-group autocorrelation, and inter-group cross-sectional correlation is first employed for regression analysis. The regression results are shown in Table 4.
Model 1 is the regression result of Eq. (3). The coefficient of ER is significantly negative and the coefficient of Sqr_ER is significantly positive, indicating that there is a “U-shaped” relationship between environmental regulation and GTFP. Model 2 is the regression result of Eq. (4). As can be seen from Model 2, the signs and significance of ER and Sqr_ER coefficient do not change obviously, indicating the robustness of the regression result in Model 1. For the interaction term of MC and ER, its coefficient is positive at the 1% significant level, meaning that the improvement of market competition degree favors the positive promotion effect of environmental regulation on GTFP.
From the results of Model 1, it can be seen that the Porter hypothesis can only be valid under the conditions of strict environmental regulations, which is the same as the conclusion of Zheng et al. [28]. Until the turning point is reached, the environmental regulation will dampen improvements in GTFP. However, improving environmental process regulation can promote GTFP improvement when the level of government’s environmental regulation exceeds its turning point. The reasons are as follows. Environmental payment costs triggered by the lower intensity of environmental regulation are a small part of the total enterprise costs, thus enterprises may pay pollution discharge fees rather than spend on innovation. That is, enterprises lack the incentives to conduct green technology innovation to achieve energy conservation and emission reduction [31, 39]. Additionally, even if enterprises carry out green technology innovation, its technology may not be mature at the initial stage of innovation, which will make the emission reduction effect of pollutants insignificant. Thus, the effect of innovation offset may not fully compensate for the effect of compliance cost, leading to the negative impact of environmental regulation on GTFP. When the strength of environmental regulation is high, enterprises will have a high compliance cost, which is emerging from stringent environmental regulations [31]. To effectively reduce the production costs of enterprises, enterprises will be stimulated to conduct green technology innovation and produce environment-friendly products to improve their competitiveness. Therefore, the effect of innovation offset will exceed the effect of compliance cost and further contribute to GTFP improvements.
Table 2.
The statistical description of variables.
Table 3.
The panel data test.
Table 4.
Estimation results of the basic model.
From the results of Model 2, it can be seen that the external constraint force of environmental regulations and the internal force of market competition can form a significant positive combined force to effectively improve GTFP, which can break the positive, negative, or nonlinear U-shaped conclusions of previous literature on productivity based solely on the external constraint force of environmental regulations. The results can be explained as follows. On the one hand, market competition can further stimulate enterprises to invest more in green technology and environment-friendly products during the external constraint force of environmental regulations. Environmental regulations can to some extent be the environmental barrier set by the government in the market, so some high-pollution enterprises may be shut down due to strict environmental regulations. Retained enterprises will be environment-friendly and their research and development investment will further focus on green technology innovation to obtain a competitive advantage and to survive in fierce market competition. The environmental characteristics of the products can be the product differentiation strategy of enterprises, which will make products have additional attributes, so as to attract consumers in certain market segments. On the other hand, the improvement of market competition can limit the negative impacts of rent-seeking on GTFP by increasing the rent-seeking costs in the industry. The government is the primary subject of environmental regulations and may provide rent-seeking space between government environmental departments and enterprises, which can distort the resource allocation of enterprises and then hinder the benefits of environmental regulations on GTFP. When the market competition degree is improved, that is, the number of enterprises in the industry has increased, the government departments can be supervised by more enterprises in the industry and rent-seeking activities can also be curbed. These all are conducive to improving the positive effect of environmental regulation on GTFP.
Robustness Analysis
To verify the robustness of the above regression results, this paper adopts the following methods to conduct a robustness test. (1) Changing the measure method of MC. The sales value of an industry is used to measure MC and its regression result is shown in column 2 of Table 5. (2) Endogeneity analysis. Considering the endogeneity of ER due to the possible bidirectional causality between ER and GTFP, the paper conducts the method of Two Stage Least Square (2SLS) and Generalized Method of Moments (GMM) by using the lagged term of ER as instrumental variables. The regression results are shown in columns 3 and 4 of Table 5 and indicate that the instrumental variables selected in the model are valid. (3) Adding the lagged term of GTFP to the model. Considering the influence of lagged productivity growth on current productivity growth, the paper further includes the lagged term of GTFP in the empirical model and uses the System GMM method to conduct the estimations. The regression results are shown in column 5 of Table 5. The estimated results confirm that there is no second-order autocorrelation in the disturbance term and all the instrumental variables for the System GMM method are exogenous.
Table 5.
The robustness test results.
[i] Note: ***, **, * indicate significance at the 1%, 5%, and 10% levels, respectively. t or z statistics in parentheses. P value in square brackets. The underidentification test is Kleibergen-Paap rk LM statistics. The weak identification test is Kleibergen-Paap rk Wald F statistics and the critical value at the 5% level is 12.20.
Based on the regression results of robustness analysis, it can be seen that the signs and significance of ER and interaction term (MC*ER) do not change obviously, indicating the results in the basic model are robust. Although the significance of Sqr_ER decreases slightly, its coefficient is still positive, which may indicate that the degree of environmental regulations is still at a low level and the positive effect of environmental regulations on GTFP cannot work effectively.
It is worth noting that the coefficient of MC is significantly negative. In other words, the improvement of market competition alone hurts GTFP, which seems contrary to the theory that market competition is conducive to improving the efficiency of resource allocation and total factor productivity. This shows that market competition is not a panacea and there may be market failures in the field of externalities related to aspects of resources and environment. Or there may be a “U-shaped” relationship between market competition and GTFP, which will be similar to the role of environmental regulations on GTFP. To verify the “U-shaped” relationship between market competition and GTFP, the paper adds the quadratic term of MC (Sqr_MC) to the empirical model, the regression result is shown in column 4 of Table 4. It can be seen that the coefficient of Sqr_MC is significantly positive and the coefficient of MC is significantly negative, indicating a “U-shaped” relationship between MC and GTFP. That is, only when the degree of market competition is high can the market competition effectively promote the improvement of GTFP.
The Conditions for the Combined Effect of ER and MC
The above research shows a “U-shaped” relationship between ER and GTFP or MC and GTFP, indicating that relying solely on ER or MC has a certain negative effect on improving GTFP. Moreover, promoting GTFP requires the combined force of environmental regulations and market competition. The paper will then explore the following question: Does the combined force effectively improve GTFP only when the degree of environmental regulation or market competition is high?
To analyze the conditions for the combined effect of ER and MC, the paper first defines four dummy variables according to the mean value of ER and MC: Low degree of environmental regulation (LER), high degree of environmental regulation (HER), low degree of market competition (LMC) and high degree of market competition (HMC). When the value of ER or MC is less than its mean value, the LER or LMC is equal to 1. Otherwise, the HER or HMC is equal to 1. The interaction term of the above dummy variables, ER and MC (HER*MC*ER, LER*MC*ER, HMC*MC*ER, and LMC*MC*ER) is then added to the empirical model, and the regression results are shown in Table 6. According to the result of Model 4, the coefficient of the interaction term HER*MC*ER is significantly positive, while the coefficient of the interaction term LER*MC*ER is insignificantly negative. This indicates that the combined force of environmental regulations and market competition can promote the GTFP only when the degree of environmental regulation is high. According to the result of Model 5, it can also be seen that the coefficient of the interaction term HMC*MC*ER is significantly positive, while the coefficient of the interaction term LMC*MC*ER is positive, but not significant. This shows that the combined force of environmental regulations and market competition can promote the GTFP only when the degree of market competition is high. Thus, environmental regulation and market competition can form a combined effect to effectively improve the GTFP only when the degree of environmental regulation or market competition is high.
Effects Based on Different Periods
Since the 18th National Congress of the Communist Party of China added ecological progress to the cause of socialism with Chinese characteristics in 2012, the intensity of environmental regulations has been constantly improving. New investments in industries with high levels of pollution and high energy demand have been strongly limited, and emission standards for existing high-pollution and high-energy industries have been constantly raised. It seems that environmental regulations in China will have a positive impact on improving GTFP by increasing the penalties of enterprises with discharging pollutants stealthily and even shutting down some enterprises that cannot fulfill the criteria of government environmental regulations. However, whether enterprises are willing to accept increasingly stringent standards of environmental regulation mainly depends on whether they can survive in the fierce market competition. The Third Plenary Session of the 18th Central Committee of the Communist Party of China in 2013 emphasized that the market should play a decisive role in resource allocation, which is different from the role of the market before 2013. This will also make enterprises face increasingly fierce market competition. Thus, both environmental regulation and market competition have been further strengthened since 2012. There is a question here: is 2012 likely to be a time point where environmental regulation and market competition have different effects on the improvement of GTFP before and after it? To explore this question, the paper divides the research samples into two groups before and after 2012 and then conducts a regression analysis. The results are shown in Table 7.
Table 6.
The regression results about combined effect conditions.
It can be seen that the coefficient of ER is significantly negative and the coefficient of Sqr_ER is significantly positive before and after 2012, which indicates that the regression results of the basic model are robust. For the variable of MC, there is a different effect between MC and GTFP. Before 2012, the coefficient of MC is significantly negative and the coefficient of Sqr_ MC is significantly positive, indicating a “U-shaped” relationship between MC and GTFP. After 2012, the coefficient of MC is insignificantly positive and the coefficient of Sqr_MC is insignificantly negative, indicating that the market competition may not affect the improvement of GTFP. For the interaction term of MC and ER, the coefficients are all significantly positive before and after 2012, indicating that improving the level of market competition contributes to the positive promotion effect of environmental regulation on GTFP. However, the interaction term coefficient after 2012 is larger than that before 2012. This difference is also statistically significant by using Fisher’s permutation test (Bootstrap sampling 2000 times) with a P value of 0.0000 [40]. That is, the combined force of environmental regulations and market competition has more effectively promoted the improvement of GTFP after 2012 than before 2012.
Table 7.
Estimation results based on different periods.
Effects Based on the Technology Level of the Industry
Based on the group division of manufacturing industries in Section 3, the paper divides the research samples into three groups: low, medium, and high technology manufacturing industries, and then conducts a regression analysis. The results are shown in Table 8.
For low technology manufacturing industries, the coefficient of ER is significantly negative and the coefficient of Sqr_ER is significantly positive, indicating a U-shaped relationship between ER and GTFP. That is, only when the degree of environmental regulation for low technology manufacturing industries is high can it facilitate the improvement of GTFP. The coefficient of MC is significantly positive and the coefficient of Sqr_ MC is significantly negative, indicating an inverted U-shape relationship between MC and GTFP. For the interaction term of MC and ER, the coefficients are significantly positive, indicating an improvement of market competition degree of low technology manufacturing industries is conducive to the positive promotion effect of environmental regulation on its GTFP. For medium technology manufacturing industries, there is a significant inverted U-shape relationship between ER and GTFP. However, the coefficients of MC and Sqr_MC are not significant, meaning that market competition in medium technology manufacturing industries does not effectively promote the improvement of GTFP. The coefficient of the interaction term between MC and ER is significantly negative, indicating that the improvement of market competition level in medium technology manufacturing industries weakens the positive effect of environmental regulation on its GTFP. For high technology manufacturing industries, the coefficient of Sqr_ER is positive and the coefficient of ER is negative, but they are not significant, suggesting that environmental regulation in high technology manufacturing industries does not play an important role in improving GTFP. The coefficient of MC is positive but not significant, while the coefficient of Sqr_MC is significantly negative, showing that relying solely on the market competition for high technology manufacturing industries may not help improve GTFP. The coefficient of the interaction term between MC and ER is positive, but not significant, which indicates that environmental regulation and market competition have not formed a significant positive combined force to effectively promote the improvement of GTFP in high technology manufacturing industries. It can be seen that the positive combined force of MC and ER only appears in low technology manufacturing industries.
Table 8.
Estimation results based on the different technology levels of industry.
Conclusions
By using the panel data of Chinese manufacturing industries, this paper calculates the GTFP with the MML index, which is based on the EBM model and global production technology frontier. The paper then studies the effect of environmental regulation and market competition on GTFP and further analyzes the combined effect of environmental regulation and market competition on improving the GTFP in the manufacturing industry. The conclusions drawn from the study are as follows.
First, GTFP has made progress during the sample period and the progress of green technology plays an important role in promoting the improvement of GTFP. Second, there is a “U-shaped” relationship between ER and GTFP. The environmental regulation will promote the improvement of GTFP when the degree of environmental regulation is at a high level. As for the relationship between market competition and GTFP, it also shows a “U-shaped” relationship. Third, the external constraint force of environmental regulation and the internal force of market competition can form a positive combined force to quickly improve the GTFP, and this combined effect is well shown in the low technology manufacturing industries, but not in medium and high technology manufacturing industries. For the conditions of the combined effect, only when the degree of environmental regulation or market competition is at a high level can the combined force form.
Based on the results above, several policy implications are proposed.
(1) The progress of green technology mainly promotes the improvement of GTFP implying that China should continue to maintain its innovation-driven development strategy. The innovation contributes to technology progress and enables a shift of the production technology frontier. Moreover, the industry-university-research cooperation process plays an essential role in improving the innovation level, thus China should further strengthen the cooperation among industries, universities, and R&D institutions and improve the mechanism of the industry-university-research cooperation to accelerate the improvement of China’s technological innovation. Additionally, the leading role of high and medium technology manufacturing industries should be better played.
(2) China should impose stricter environmental regulation policies to stimulate enterprises to improve green technology levels in the manufacturing industry. The environmental regulation object needs to be gradually extended to the former “top students”, namely the high and medium technology manufacturing industries. Because most industries have the characteristics of the layout of the whole industrial chain, there may also be parts of resource destruction and environmental pollution in the medium and high technology manufacturing industry, which should be supervised by government environmental departments. Moreover, the environmental legislative work should be improved, which needs to give the environmental department greater autonomy of law enforcement and avoid the rent-seeking behavior between government environmental departments and enterprises. Additionally, enterprises play a crucial role in determining whether and to what extent a positive combined effect on improving China’s GTFP can be generated, therefore China should strengthen the encouragement of enterprises to engage in green technology research and development.
(3) China should further advance and deepen the market-oriented reform to promote green transformation in manufacturing industries. The entry and exit barriers need to be gradually broken down to improve the level of market competition. Moreover, an open and transparent competitive market should be constructed for enterprises with different scales, ownership types, and capabilities, which will effectively motivate the internal driving force of enterprises to invest in innovation and let the market competition play a better role in promoting the GTFP. Since the positive combined force of environmental regulation and market competition can occur when the degree of market competition is high, advancing and deepening the market-oriented reform will accelerate the arrival of environmental regulation inflection points. That is, environmental regulation can better improve the GTFP under the high degree of market competition.
Although this paper measures the GTFP by using a new method and investigates the effects of environmental regulation and market competition on GTFP, there is still one limitation, which could also be possible future research direction. The environmental regulatory system in China comprises command-and-control and market-based regulations, therefore future studies can be extended by analyzing the heterogeneity of the combined effect between different environmental regulation policies and market competition on GTFP.

