

Introduction
Faced with the increasingly prominent contradiction between the ecological environment and economic development, China has firmly chosen the path of green sustainable development. In 2020, President Jinping Xi announced the “Double Carbon Target” – aiming for a carbon peak by 2030 and carbon neutrality by 2060 – at the 75th United Nations General Assembly1, underscoring China’s determination in environmental governance and carbon reduction. In July 2023, President Xi emphasized at the National Ecological Environment Protection Conference the need to accelerate the promotion of green and low-carbon transformation of the development mode and to insist on green and low-carbon development as the fundamental solution to ecological and environmental problems2. This further clarifies environmental governance as a strategic focus of national development. In fact, since the 1980s, China has implemented numerous environmental regulation (ER) policies to combat pollution and protect the environment, achieving notable progress [1].
However, the impact of ER on carbon intensity (CI) is still controversial. According to the “Green Paradox” theory, weak ER leads to expectations of stricter future regulations. This causes fossil fuel producers to accelerate extraction and consumers to anticipate rising fossil fuel prices while maintaining high consumption levels in the short term, thereby increasing CI [2-4]. According to the “Forced emission reduction” theory, greater ER will reduce CI by stimulating green technology innovation [4], optimizing industrial structure (IS) [3], and transforming energy structure (ES) [5, 6]. Consequently, ER can have various impacts on CI. To further study the influence mechanism, this study adopts ES as the intermediary mechanism based on the “Green Paradox” theory and selects technological innovation (Pat) and IS for comparative analysis. Furthermore, given China’s huge geography, there are substantial regional disparities in economic development and ER implementation. President Xi emphasized the need for the strictest ecological environment governance system, encompassing aboveground and underground, land and sea coordination, and regional linkage. Studying the relationship between ER and CI across different regions from a dynamic spatial perspective can provide valuable insights for addressing urgent ecological environment governance issues.
The available research has extensively examined the impact of ER on CI, although several areas require more investigation. First, while many researchers have looked at ER’s direct and indirect impacts on CI [2, 4, 7], regional disparities and spatial interactions have not been fully considered. Second, although some studies have compared regional disparities, there is no consensus. For instance, Guo and Chen (2018) discovered that ER has a more pronounced emission reduction effect in eastern China than in the middle and western regions [8]. Conversely, Wang et al. (2019) argued that the effect of ER on CI was insignificant in western, weaker in eastern, and stronger in middle China [9]. Wu et al. (2020) concluded that the ER effectively reduces CI in the eastern and middle regions but has no effect in western China [10]. According to Wang and Zhang (2022), the carbon abatement effect of ER takes on an inverted “U” form in eastern and middle China but has no effect in the western and northeastern regions [11]. Therefore, ER’s regional disparities in carbon emission reduction impacts necessitate further research. Finally, the above studies do not take into account the spatial interactions between ER’s emission reduction impacts and related mechanisms, which are crucial for developing a regional linkage environmental governance system. Differing from the existing literature, this paper combines the Stochastic Impacts by Regression on Population, Affluence, and Technology (STIRPAT) model with a dynamic spatial Durbin model (DSDM) to investigate the spatial interactive characteristics and regional disparities in the carbon emission reduction effects of ER and associated mechanisms in China.
China’s political and economic environment provides a unique context for studying the impact of ER on CI. First, China’s environmental governance operates primarily through a “top-down” system [12, 13]. In pursuit of the “3060” goal, China has implemented stringent ER, with governments at all levels prioritizing environmental governance to meet emission reduction targets more effectively. Second, China’s numerous administrative units, each exhibiting different ER and economic development levels, offer a rich and varied dataset for comparative analysis. Specifically, this study examines the impacts of ER on CI and their spatial interaction using data from 30 Chinese provincial administrative regions from 2007 to 2019.
This study makes three marginal contributions. First, this study enriches the theoretical literature on how ER influences carbon emissions. While prior literature has not thoroughly examined the theoretical mechanisms underlying ER’s impact on carbon emissions [4, 14, 15], this research examines three mechanisms and their spatial interaction theories from both static and dynamic spatial perspectives. Second, employing the STIRPAT, DSDM, and mediation models, this paper empirically analyzes ER’s carbon mitigation effects through dynamic spatial lenses while comparing the differential roles of ES, Pat, and IS. Current research lacks consensus on ER’s operational mechanisms and rarely distinguishes between short-term versus long-term impacts [16-19]. Our analysis reveals that ER optimizes ES, Pat, and IS in the short term, while only Pat demonstrates persistent pollution reduction in the long term. Third, regional heterogeneity in ER’s effectiveness across eastern, middle, and western China is identified, showing that these mechanisms exhibit dynamic spatial interaction effects. This insight extends current research by demonstrating the spatiotemporal interdependence of ER’s operational mechanisms.
Literature Review
The Concept and Classification of ER
The word “regulation” is a legal term that means to regulate and restrict the behavior of economic subjects through laws, regulations, and macro systems. Previous studies have defined “regulation” as “the sum of a series of mandatory regulatory measures enacted and implemented by the state to meet the demands of certain interest groups”. Li and Liu (2023) hold that ER is an environmental standard or action formulated by the government to solve the external problems caused by environmental pollution [20].
ER can be classified into three types [21]: the first is command-and-control ER. These regulations involve government-imposed rules and measures that compulsorily restrict pollution discharge. This includes establishing environmental criteria for pollution emissions or product manufacture, as well as administrative penalties for companies that exceed pollution emission regulations. The second is a market-based incentive ER. These regulations use market mechanisms to guide enterprises in reducing pollution emissions. Examples include pollution charge systems and tradable permit systems. The third is public-participation ER. These regulations rely on environmental petitions, media pressure, and other forms of social opinion to compel the government to strengthen environmental supervision or companies to reduce pollution emissions. This includes public participation in environmental matters, transparency of environmental data, and voluntary environmental agreements [20]. Among these, formal ER includes command-and-control and market-based incentive ER, whereas public-participation ER is classified as informal ER [4, 22].
The Impact of ER on CI
The present literature focuses on three aspects of ER’s impact on CI. First, some scholars have identified a positive effect of ER on CI. Sinn (2008) introduced the “Green Paradox” effect, suggesting that fossil fuel producers, anticipating future declines in demand due to ER, might increase their current extraction rates, thus promoting carbon emissions [23]. Subsequent scholars empirically tested the positive impact of ER on CI. Wang and Wei (2020) discovered that tight ER adoption can have a significant “Green Paradox” effect on economic progress [24]. Zhang et al. (2021) identified this effect in China, where competitive ER behaviors among regions lead to pollution transfers, increasing carbon emissions [25]. Yin et al. (2022) noted that at lower ER intensities, the “Green Paradox” is prevalent, shifting to a carbon reduction effect with stronger ER [2]. Huang and Tian (2023) found that formal ER can inhibit Pat before peak emissions, thus generating a “Green Paradox” effect [4]. Additionally, Sorrell (2009) discussed the “Jevons Paradox”, where strict ER prompts companies to enhance energy efficiency through technological advancements, which paradoxically leads to more energy demand and pollution emissions [26].
Second, numerous scholars have identified a negative impact of ER on CI, highlighting the “forced emission reduction” effect. This effect arises as local governments continually elevate ER standards, compelling high-energy-consuming and high-polluting enterprises (HHE) to either innovate technologically or upgrade pollution control technologies, thereby promoting emission reductions. For example, Hashmi and Alam (2019) found that OECD countries’ CI can be decreased by raising environmental fees and awarding more ecologically favorable patents [27]. Zhang et al. (2022) indicated that the current carbon emission trading system has suppressed green Pat but significantly reduced CI [28]. Chang et al. (2023) observed that ER is positive for CO2 emission reduction by promoting green innovation [29]. Investment-based environmental regulation is the most effective, followed by command-and-control regulation. Li et al. (2023) demonstrated that ER can reduce CI in regions highly dependent on natural resources [30].
Third, some scholars have identified the dynamic characteristics of ER and CI. Guo and Chen (2018) noted that when ER measures are supported, China’s economic reliance on fossil fuels shifts from weak to strong and back again [8]. The relationship between ER and carbon intensity has a noticeable inverted “U” shape. Wang and Zhang (2022) discovered that the direct influence of ER on carbon emissions similarly has an inverted “U” shape [11]. ER can successfully reduce CO2 emissions in Chinese cities by encouraging industry structure improvement and technological innovation. Huang and Tian (2023) and Yang et al. (2023) demonstrated the inverted “U”-shaped impact that both formal and informal ER have on net CO2 emissions [4, 31].
Regional Disparities and Spatial Interaction of ER on CI
Some scholars have begun to focus on the regional differences in the impact of ER on CI. The influence of ER policies on CI varies significantly by region [9, 32]. Industrial investment is limited in regions with stricter ER, whereas industrial investment institutions thrive in regions with relatively weaker ER [32]. Guo and Chen (2018) discovered that the moderating influence of ER on CI was stronger in eastern than in middle and western China [8].
Furthermore, geographical links between environmental regulation and carbon emissions are receiving attention. Cheng et al. (2017) found that CO2 emissions exhibit significant local spatial clustering [33]. Command-and-control ER effectively reduces emissions but does not significantly impact technological progress, whereas market-based ER promotes technological advancement but is less effective in reducing emissions. Some studies have employed the SDM to examine the impact of ER on CI. Zhang et al. (2021) observed that competition among local governments in China leads to the nearby transfer of pollution and that spatial spillovers of ER are particularly pronounced in the western regions [25]. Huang and Tian (2023) discovered that China’s net CO2 emissions decrease from east to west and exhibit considerable regional clustering [4].
In summary, the concept of ER continues to evolve with ongoing research. The impact of ER on CI remains a debated topic, necessitating further investigation into ER’s carbon emission reduction effects. In conclusion, the concept of ER has evolved with research. The effect of ER on CI is still a controversial topic, and further research is needed to study the effect of ER on carbon emission reduction. The function of ES in the emission reduction process is clarified by comparing various mechanisms. While some scholars have begun exploring regional differences and spatial connections in the impact of ER on CI, their analyses have largely been static. The dynamic spatial effects of ER on CI require further study. This study seeks to fill this gap by investigating ER’s time and spatiotemporal lag effects on CI from a dynamic spatial viewpoint, assessing direct, indirect, and total impacts in both the short and long term.
Analysis of the Mechanism of ER on CI
The Promoting Effect of ER on CI
First, according to the “Green Paradox” effect, when the government tightens ER, it prompts expectations of even stricter regulations in the future, leading to increased energy costs. Consequently, businesses accelerate their current production activities to mitigate future costs, resulting in a short-term surge in fossil energy demand. This increased energy consumption promotes higher carbon emissions [23]. Therefore, ER may lead to a short-term rise in CI.
Second, according to the “Jevons Paradox” hypothesis, stringent ER can lead companies to improve energy efficiency through technological advancements. However, this increase in efficiency paradoxically stimulates higher energy demand, thereby exacerbating carbon emissions [26]. Consequently, stringent ER may accidentally contribute to increased CI.
The Inhibitory Effect of ER on CI
Two mechanisms, Pat and IS, are also adopted to compare the emission reduction effect of ES.
The first is energy structure. ER primarily influences the ES from both supply and consumption perspectives, and transforming the energy consumption structure can reduce CI [13, 34]. On the supply side, the development of clean energy sources like solar, wind, hydropower, and biomass is encouraged by ER policies, which raise support for renewable energy and enhance the output share of clean energy. On the demand side, ER policies mandate reductions in fossil fuel consumption and encourage a higher proportion of clean energy use, thereby reducing CI. For instance, the “Notice on Doing a Good Job in the Full Coverage of Renewable Energy Green Power Certificates to Promote the Consumption of Renewable Energy Electricity” by the National Development and Reform Commission, the Ministry of Finance, and the National Energy Administration3 proposes strengthening the green electricity responsibility of HHE and increasing their required level of green electricity consumption.
The second is technological innovation. The “Porter hypothesis” states that an appropriate level of ER can incentivize enterprises to engage in Pat, enhancing productivity, offsetting environmental protection costs, and increasing profitability [35]. Porter and Linde (1995) propose that effective ER can improve firms’ environmental performance through five main pathways [36]. 1) ER can prompt firms to identify inefficiencies in resource use, leading to technological advancements that enhance resource efficiency and reduce pollution. 2) ER focused on environmental information collection can highlight high-performing companies, allowing them to gain economic benefits and motivating them to strengthen their environmental measures. 3) By clarifying relevant laws and regulations, ER can reduce investment uncertainty for firms, emphasizing the significance of energy conservation and emissions reduction and encouraging firms to enhance their environmental practices. 4) ER can exert pressure on companies, compelling them to reduce emissions through Pat. 5) ER can balance the competitive environment during the transition period. Additionally, empirical studies have confirmed that ER can promote Pat, thereby reducing CI [7, 29, 37].
The third is industrial structure. By restricting the growth of HHE and encouraging green, environmentally friendly sectors, ER optimizes the IS. On the one hand, the government enforces strict ER measures on HHE, thereby curbing pollution at its source. For example, the “Regulations on the Prevention and Control of Air Pollution in Guangdong Province” prohibit the construction and expansion of high-pollution industrial projects listed in the catalog within the Pearl River Delta region. On the other hand, in order to encourage the sustainable growth of green and low-carbon sectors and to support the green transformation of HHE, the government has implemented a variety of tax and fiscal incentives. For instance, “The Guiding Opinions of the General Office of the State Council on Accelerating the Promotion and Application of New Energy Vehicles” proposes enhancing subsidy policies for new energy vehicles and providing tax incentives for their adoption. Additionally, empirical studies have demonstrated that ER reduces CI by optimizing the IS [11, 22, 38].
The Spatial Interaction Mechanism of ER on CI
First, due to the spillover effect of CO2 emission between different regions [39] or the inter-regional transfer of HHE [32, 40], regions implementing ER do not fully benefit from these regulations. This creates a spatial spillover effect of ER on CI. Through the spillover of CI, the carbon emission reduction effect of ER in nearby places might affect the local concentration of carbon.
Second, varying intensities of ER across regions cause production factors to migrate, driving enterprises unable to meet strict ER requirements to relocate to adjacent areas [32]. This migration impacts overall regional carbon management effectiveness. Additionally, when ER prompts the near transfer of high emissions [25], strict local ER pushes HHE to regions with weaker ER, resulting in an “extrusion effect” between regions.
Third, local governments exhibit imitative interaction behavior in ER, meaning the intensity of ER in adjacent areas influences the local region’s ER strength and consequently impacts local carbon emissions. This imitative competition behavior generally weakens the effectiveness of pollution control [25]. However, as China increasingly emphasizes environmental protection, the strategic interactions between local governments regarding ER have begun to shift towards a “race to the top” [41].
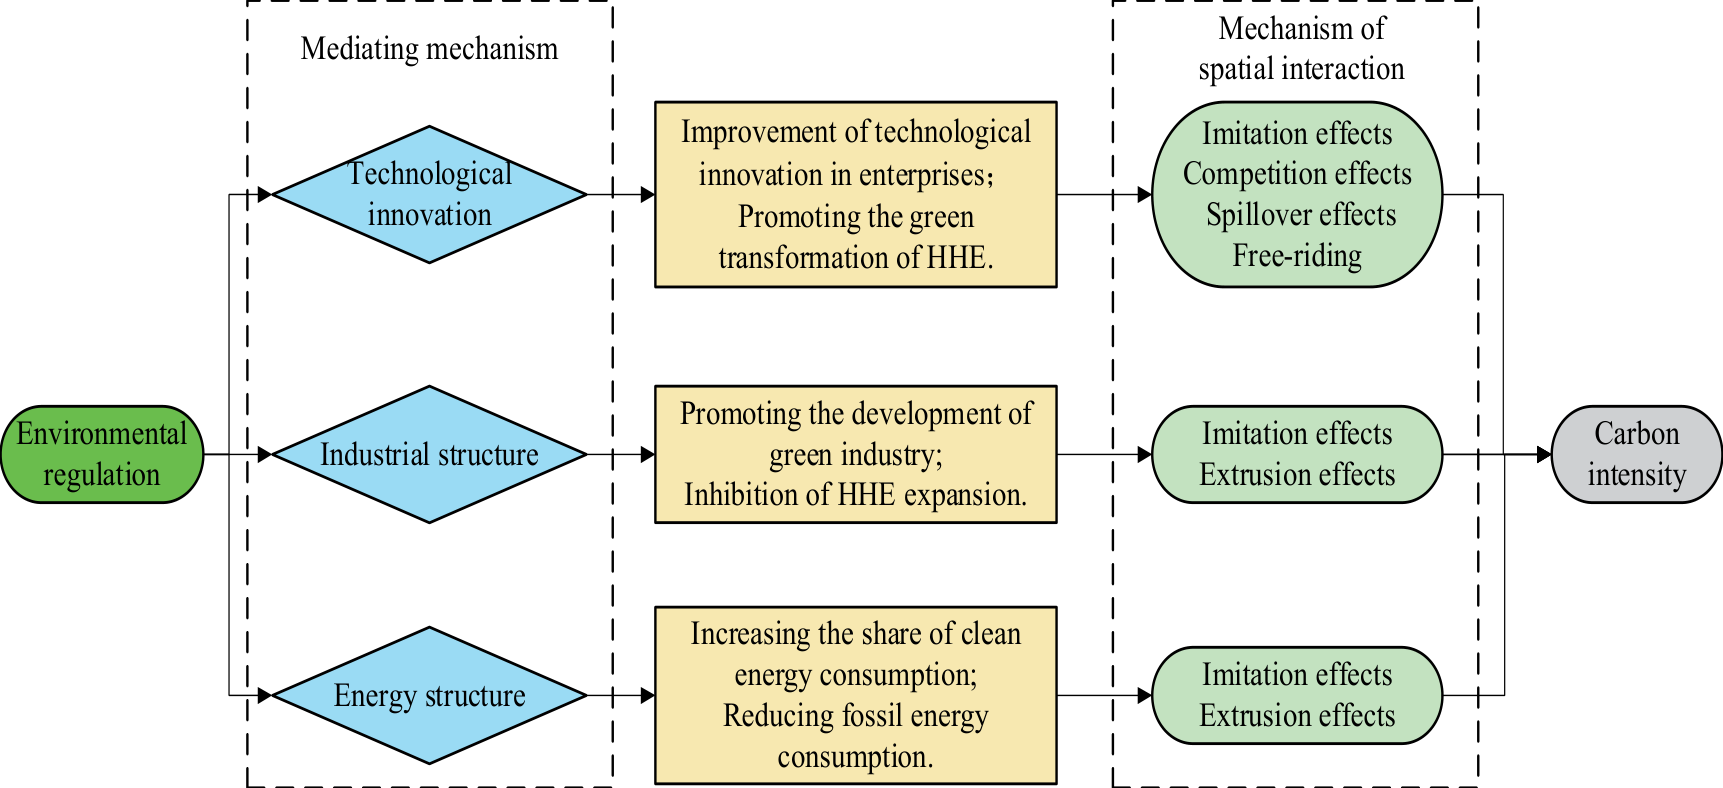
The specific spatial interaction effects can be analyzed through the three main mechanisms by which ER influences CI. First, the ES effect. Optimization of ES by local ER policies can affect the CI of other regions through “imitation effects” and “extrusion effects”. On the one hand, adjacent regions can imitate the local ER policies to reduce fossil fuel consumption [13], such as adopting centralized heating instead of decentralized heating and encouraging enterprises and institutions to use clean energy, thereby reducing regional CI. On the other hand, stringent local ER policies may push some HHEs to relocate to other regions rich in fossil fuels, increasing fossil fuel consumption and consequently raising CO2 emissions in those areas [10].
Second, the technology effect. The improvement in technology level due to local ER policies can affect the CI in adjacent regions through “imitation effects”, “competition effects”, and “technology spillover effects”. 1) When local ER policies promote green technology advancements, other regions may imitate and implement similar regulatory measures [42]. 2) In a “Race to the top” scenario of policy interaction, local environmental regulation-driven Pat may encourage neighboring regions to enhance their research and development investments in green technology [28], thereby reducing overall regional CI levels. 3) Positive spillovers from green technology innovation can improve the air quality of adjacent areas. However, if these areas opt to reduce their own investment in green technology, their “free-riding” behavior can undermine overall regional carbon reduction efforts.
Third, the structural effect. Promoting IS upgrading by local ER policies can affect the CI of other regions through “imitation effects” and “extrusion effects”. On the one hand, neighboring regions may imitate local ER policies to achieve specific emission reduction targets, driving their own IS upgrading [43]. The clustering of high-end manufacturing and productive service industries can produce positive spillover effects, optimizing the IS of these regions. On the other hand, strict local ER policies, such as restricting the expansion of HHE industries or blacklisting certain industrial developments, may push non-compliant HHEs to relocate to other regions [37, 39], thereby increasing the CI in those areas.
In conclusion, ER can impact CI through ES, Pat, and IS. The effects are depicted in Fig. 1.
Materials and Methods
Variables and Methods
Variables
This article studies the impact of ER on CI, involving the following variables:
First, the explained variable in this study is carbon intensity (CI), which is calculated as the ratio of CO2 emissions to GDP for each province from 2007 to 2019 [44]. Following the CO2 emission calculation method provided by the IPCC in 2006 [45], the total yearly CO2 emissions of 30 Chinese provinces were determined (Xizang, Hong Kong, Macau, and Taiwan were left out due to data inaccessibility). The formulas for CI are provided in Equations (1) and (2).
In Equation (1), Cpt represents the CO2 emissions of province p in year t. Eipt denotes the consumption of energy type i in year t in province p, σi represents the conversion coefficient of standard coal for the energy type i, and φi is the carbon emission coefficient for the energy type i. Specific coefficients are shown in Table 1. The conversion factor between carbon emissions and CO2 is 44/12.
In Equation (2), CIpt represents the carbon intensity of province p in year t. GDPpt represents the GDP of province p in year t.
Second, the explanatory variable is environmental regulation (ER). Since there is no uniform standard for measuring ER [13]. Compared to other types of ER, investment-based ER has been the most effective in promoting green innovation and reducing emissions [29]. Consequently, this paper uses the completed investment in industrial pollution control to represent the level of ER [20].
Third, control variables were included following prior research [48, 49]. Energy consumption intensity (EI), population size (P), and Per capita GDP (PGDP) of each province were used as representative variables for technology, population levels, and wealth, respectively. The data for the above variables are sourced from the China Energy Statistical Yearbook, the China Environmental Statistical Yearbook, the China Statistical Yearbook, the Wind database, and the various provincial statistical yearbooks. Definitions of the variables are provided in Table 2.
Econometric Methods
(1) Modeling the carbon abatement effects of ER
This paper combines the ISIRPAT model with the DSDM to establish an empirical model. To enhance the accuracy of the research, this study constructs three models incorporating the time lag term CIi,t–1 (Equation (3)), the spatiotemporal lag term WCIi,t–1 (Equation (4)), and both time and spatiotemporal lag terms simultaneously (Equation (5)), as shown below:
(4)
(5)
Table 1.
The coefficients for various energy types.
| Energies | Crude oil | Diesel oil | Fuel oil | Coal | Coke | LPG | Kerosene | Gasoline | Natural gas |
|---|---|---|---|---|---|---|---|---|---|
| σi | 1.4286 | 1.4571 | 1.4286 | 0.7143 | 0.9714 | 1.7143 | 1.4714 | 1.4714 | 1.2143 |
| φi | 0.5857 | 0.5921 | 0.6185 | 0.7559 | 0.8550 | 0.5042 | 0.5714 | 0.5538 | 0.4483 |
Table 2.
Defining variables.
μ represents the impact of the previous period’s CI of this province on its current period’s CI, W represents the spatial weight matrix, α represents the effect of the neighboring provinces’ previous period’s CI on this province, ρ represents the influence of the current period’s CI of the surrounding provinces on this province, and β2, β4, β6, β8 represent the effects of the neighboring provinces’ ER, PGDP, ES, and P, respectively, on the province’s CI.
(2) Modeling of the mechanism test
This study, incorporating the DSDM model, tests for the presence of mediating effects of ES effect, technological effect, and IS effect in the process by which ER influences CI through the construction of the following mediation models.
(6)
(7)
(8)
In Equation (7), M represents the mediator variables, which include the ES effect, the Pat effect, and the IS effect. The meaning of the other variables is consistent with Equations (1) to (5).
To compare the regional heterogeneity of ER, the regional division of this study is consistent with [39]. Each region is empirically tested by establishing Equations (3) to (8), respectively.
Results and Discussion
Empirical Results Analysis
Model Testing
Table 3 presents the results of the econometric model test. All indices are significant at the 1% level, showing a high spatial connection in the study subject. The findings of the LR test show that the spatial lag model (SLM) or the spatial error model (SEM) cannot be used to simplify the spatial Durbin model (SDM). Furthermore, the estimation results demonstrate that the two-way fixed effects model fits data better than the individual fixed and temporal fixed effects models. Therefore, this paper uses a two-way fixed SDM model.
Analysis of Empirical Results for the Full Sample
Carbon Emission Reduction Effects of ER
The SDM estimation results for the full sample are shown in Table 4. To facilitate comparison, estimations were conducted for SDM models with only a time lag, a spatiotemporal lag, and both time and spatiotemporal lags. The model incorporating both time and spatiotemporal lags, which demonstrated the highest goodness of fit, was primarily analyzed. The regression results indicate that CI exhibits significant spatial spillover, spatial lag, and time lag effects. Specifically, the CI of the previous year positively influences the current year’s CI within the province (0.7096), and the CI of neighboring provinces positively impacts the current year’s CI of the province (1.4073). This suggests that carbon emissions are continuous over time and have spillover effects across regions. However, the province’s CI in the current year can be negatively impacted by the CI of nearby provinces in the prior year (-4.0948). This may be due to stronger environmental enforcement in neighboring provinces in the previous year, reducing their CI and displacing HHE to the province in question, thereby increasing its CI in the current year. Additionally, positive environmental spillovers may occur when neighboring provinces reduce their CI in the previous year, potentially leading to a “free-riding” behavior. This could result in relaxed pollution control measures and increased CI in the current year. Most researchers’ study findings support CI’s observed time and spatial lag characteristics [50-52], and the effects of time and spatial interaction are consistent with [53].
Since the spatial lag term of the independent variable in this model does not consider the interaction information between multiple neighboring provinces. Therefore, its regression coefficients do not reflect the independent variables’ spatial spillover characteristics. Nonetheless, the direct, indirect, and total effects can effectively reveal the spatial interaction linkages between ER and related control variables on CI. Given that the DSDM model, which includes both time lag and spatiotemporal lag variables, has the highest goodness of fit, this analysis focuses on the various effects in its regression results. Table 5 presents the regression coefficients.
Table 4.
Results of the full sample dynamic spatial econometric model.
The short-term effects of ER on CI are significantly negative (-1.9291), (-7.2552), and (-9.1843) for direct, indirect, and total effects, respectively. This indicates that the ER within a province not only reduces its own CI but also that of neighboring provinces, as well as the overall CI across the entire sample region. This indicates that ER has a significant spatial spillover effect on decreasing carbon emissions. The main reasons are the following: First, in response to the national dual-carbon goals, provinces have intensified ER, leading to a decline in coal consumption and continuous optimization of ES. Second, both government and enterprises have increased investments in environmental pollution control and reduced provincial CI by enhancing the level of green Pat. Third, strategic interactions in ER among local governments are starting to shift towards a “race-to-the-top” scenario, where neighboring provinces emulate the environmental protection measures of other provinces and adjust economic structures. The IS effect exhibits spatial spillover, further optimizing the province’s economic structure and encouraging a decrease in CI within and throughout the sample region. Furthermore, the long-term total effect of the ER on CI is still strongly negative (-3.7809), reflecting the sustainability of the emission reduction effect through green technology innovation. These findings are consistent with previous research conclusions, highlighting the large impact of ER on carbon emissions reduction in China [4, 11, 29].
In the short term, the increase in PGDP has a favorable impact on the province’s CI (4.0563). Similarly, growth in PGDP in neighboring provinces will also increase the CI of the province (27.0010), thus having a positive total effect on the CI across the entire sample region (31.0573). This is likely because rising per capita wealth levels within a province increase resource consumption. Neighboring provinces also primarily grow their wealth through resource consumption, including resources purchased from the province, thereby elevating the CI for both the province and the sample region. Furthermore, as living standards improve with increased per capita wealth, demand for various products rises, increasing the CI of both the province and the sample region. Higher per capita wealth levels will lead to a broader range of demands in the long term, further increasing the CI across the whole sample area (12.7867).
Table 5.
Results of spatial interaction estimation for the full sample.
In the short term, reducing a province’s EI dramatically lowers its CI (1.8318). Additionally, energy intensity reductions in neighboring provinces also significantly decrease the province’s CI (72.6358). Consequently, the reduction in energy intensity in the province has a substantial carbon reduction effect on the whole sample area (74.4676). This demonstrates that improvements in the province’s green technology enhance energy utilization efficiency. Furthermore, there are spatial spillovers from green technology advances in neighboring provinces, further boosting the province’s technological levels and thereby reducing its CI. Therefore, the development of green technology within the province stimulates Pat across the entire sample region, leading to a reduction in CI. In the long term, decreasing the province’s energy intensity promotes a reduction in CI for the entire sample region (30.6598), indicating that the carbon emission reduction effects driven by technological advancements are enduring.
In the short term, a population decline within the province will reduce its CI (3.3939). Similarly, a population decrease in neighboring provinces will further reduce the province’s CI (27.7662). Consequently, the province’s population drop has a considerable impact on carbon emission reduction across the entire sample region (31.1601). This implies that a fall in the province’s population will reduce consumption of local products, while a population decline in surrounding provinces reduces demand for products, including those sourced from the province. This reduction in demand leads to decreased resource consumption for production within the province, thereby lowering its CI. Furthermore, population loss has a long-term carbon-reducing effect (12.8288).
Analysis of Mechanism Test Results
Table 4 presents the consequences of ER’s dynamic spatial interaction on CI, as Equation (6) has been previously tested. This section focuses on estimating Equations (7) and (8). Suppose ER significantly affects the mediator variable, and the mediator variable significantly affects the CI. In that case, the transmission mechanism of the mediator variable is valid, and the mediation effect is effective. Otherwise, the transmission mechanism is hindered, and the mediating effect is not valid. Table 6 shows the mediation effect estimates. Other estimates are available on request.
(1) ES effect
In Equation (7), with ES as the dependent variable, the short-term optimization of ER in neighboring provinces improves the ES of the focal province by lowering the proportion of coal use in total energy consumption (-0.1689). Similarly, the ER within the focal province optimizes the ES across the entire sample area (-0.1714). This is likely because, in the short term, ER measures in neighboring provinces encourage HHE to reduce coal usage by enhancing energy efficiency through technological upgrades. The technological spillover effect further reduces coal usage both within the focal province and across the entire sample area.
In Equation (8), with ES as the independent variable, the short-term optimization of the ES within a province reduces the CI of the entire sample area (20.5372), and this emission reduction effect is sustainable (9.6603). Reducing coal consumption in the province decreases carbon dioxide emissions and has a positive spillover effect on carbon emissions; it further reduces the CI across the whole sample area.
In the short term, the analysis above indicates that ER can reduce the CI of the entire sample area by optimizing the ES. The mechanism by which the ER influences the ES is effective, and its impact on emission reduction is significant.
Table 6.
Results of the mediation effect in the full sample.
(2) Pat effect
In Equation (7), with LnPat as the dependent variable, the short-term effects show that ER within the province reduces the Pat (-0.2212), while ER in neighboring provinces increases the Pat in the focal province (2.6255). Additionally, the ER within the province significantly increases the Pat across the entire sample area (2.4042). The primary reason is that, in the short term, firms within the province allocate more funds to pollution control equipment and post-event management rather than RD investment, leading to a temporary decline in Pat. Meanwhile, neighboring provinces invest more in green technology RD investment, and due to the positive spillover effect, this increases the Pat in the focal province and the whole sample area. In the long term, as investments in pollution control grow, the level of Pat within the province significantly improves (0.3256), and this improvement has a lasting effect across the entire sample area (0.3307).
In Equation (8), with LnPat as the independent variable, increasing the amount of technical innovation in nearby provinces reduces the focal province’s CI in the short term (-12.5565). Due to the positive spillover effect of technological advancements, an increase in patent applications within the focal province reduces CI across the entire sample area (-12.5468), with this technological impact providing a lasting carbon reduction effect (-5.4121).
In summary, ER reduces CI by enhancing regional Pat in both the short and long term. The process by which ER fosters Pat is effective and significantly contributes to emission reduction.
(3) IS effect
In Equation (7), with LnIS as the dependent variable, the short-term effects indicate that ER in nearby provinces optimizes the focal province’s IS (-0.1197). Similarly, the ER in the province has optimized the IS of the whole sample area (-0.1203). The reason for this optimization is probably that ER in nearby provinces encourages the upgrading and transformation of HHE, which lowers their need for upstream and downstream production materials, including those from the focal province and other regions. This improves the IS of the whole sample region as well as the focal province.
In Equation (8), with LnIS as the independent variable, the short-term impact shows that reducing the value produced by the secondary industry within a province raises its CI (-8.7503). A decrease in the secondary industry’s value added in neighboring provinces reduces the province’s CI (10.9802). Additionally, a decrease in the secondary industry’s value-added within a province leads to a reduction in CI across the entire sample area (2.2298). The emission reduction effect from this decrease in secondary industry value added shows persistence (0.8677).
Therefore, throughout the entire sample region, ER can optimize the IS and reduce CI in the short run. The process by which the ER affects the IS is effective. In summary, ER optimizes ES and IS and promotes Pat in the short term. Meanwhile, ES has the best emission reduction effect, followed by Pat and IS. Only Pat can contribute to long-term pollution reductions.
Analysis of the Empirical Results for Subsamples
Effect of ER on Reducing Carbon Intensity
Table 7 presents the DSDM model findings for subsamples, and Table 8 presents the results of dynamic interaction effects.
(1) Eastern region
As shown in Table 7, the CI exhibits significant time lag effects, spatial spillover effects, and spatial lag effects in the eastern region. These influences and theoretical analyses align with the entire sample area.
As shown in Table 8, in the short term, ER in the eastern region has a significant negative direct, indirect, and total effect on CI. The long-term total effect is also negative. This may be due to the eastern region’s more advanced IS, which allows stronger ER to drive the transformation of HHE more effectively, thereby reducing regional CI. The direct effect of PGDP on CI in the short term is not significant, indicating that the growth in per capita wealth does not impact CI. A possible reason is that increased PGDP boosts product demand. However, the higher technological level in the eastern region offsets the carbon emissions associated with this increased production. Therefore, the growth of per capita wealth does not significantly affect the province’s CI.
Table 7.
The results of subsamples of DSDM estimation.
Table 8.
The estimation results of dynamic spatial interaction effects of subsamples.
(2) Middle region
Table 7 indicates a notable difference for the middle region compared to the entire sample. In this region, the coefficient for the lagged CI is significantly negative (-2.6816), suggesting that within these provinces, a rise in CI in the prior year causes a decrease in CI in the current year. A possible reason is the enhanced environmental awareness in provinces of the middle region. To achieve certain emission reduction targets, efforts will be made to reduce the CI of the current year if there is an increase in the previous year.
Table 8 illustrates that the total effect is significantly negative (-1.4568); ER’s short-term direct and indirect effects are not significant in the middle region. This indicates that the ER in both the province and neighboring provinces does not impact the province’s CI in the short run, yet the ER in the province can reduce the CI across the entire sample region. The primary reason is that technological advancements within the province are slow, making it difficult to achieve significant emission reductions from industrial pollution control investments in the short term. However, due to the abundance of clean energy in the central region, substituting a portion of coal consumption with clean energy in the short term reduces the province’s coal consumption. This reduction has a favorable spillover impact on carbon emissions, thereby lowering the CI across China. In the long term, the province’s ER significantly reduces the province’s CI (-0.4235), and the province’s ER reduces the CI of the entire sample region (-0.3102). In contrast, the ER in neighboring provinces significantly increases the CI of this province (0.1133). This might be due to neighboring provinces tightening ER, prompting HHE to relocate to this nearby province, leading to an increase in the CI of this province. As the environmental awareness in this province increases, its ER effectively reduces the province’s CI and, due to the imitation effect in other provinces, effectively reduces the CI of the entire sample region.
(3) Western region
Unlike the results from the entire sample, Table 7 reveals a significant negative coefficient for the lagged CI in the western region (-0.2065). This suggests that a rise in CI in the previous year results in a decrease in CI in the current year within the western provinces. This trend suggests heightened environmental consciousness in these provinces, where efforts to meet emission reduction targets intensify after a year of increased CI, thereby driving efforts to reduce the current year’s CI.
Table 8 reveals that the direct, indirect, and total effects of ER in the short term are significantly positive, being (2.3091), (6.7940), and (11.7899), respectively. This suggests that local ER increases CI within the province, ER in neighboring provinces similarly escalates the local province’s CI, and local ER also raises the CI throughout the entire sample region. There are three possible reasons for this. First, compared to the Middle and Eastern regions, the Western region’s intensified ER prompts firms to boost their RD investments to enhance energy efficiency. The enhancement in energy efficiency paradoxically stimulates an increase in energy demand. The western region’s rich energy resources create a pull factor for industrial enterprises moving westward from coastal areas. This migration heightens resource and energy demands, subsequently elevating the CI both locally and across the entire sample region. Second, enterprises may accelerate their production activities by anticipating further stringent ER measures and rising future energy costs. This preemptive increase in production boosts fossil energy consumption in the short term, thereby amplifying the CI across both local and broader regions. Moreover, in the long term, provinces in the western region continue to introduce industrial enterprises from coastal areas for sustained economic growth. The “Green Paradox” and the “Jevons Paradox” will long-term affect the western region, thereby increasing its CI (6.6737).
In summary, ER in the eastern and middle regions of China has a significant abatement effect; on the contrary, the abatement effect of ER in the western region is not obvious.
Analysis of Mechanism Test Results
This study investigates the mediating roles of these three mechanisms in the eastern, middle, and western regions to delve deeper into how ER’s ES, technological, and IS effects manifest across various regions. Due to space constraints, Table 9 only presents the findings related to the dynamic spatial interaction effects of the mediator variables and the independent variables in the mediation model. Additional results are available upon request.
(1) Eastern region
In Equation (7), with LnIS as the dependent variable, short-term ER within the province significantly optimizes the local IS (-0.0159). Similarly, ER in neighboring provinces improves the province’s IS (-0.0668), and the province’s ER optimizes the entire eastern region’s IS (-0.0827). This improvement is likely due to the eastern region’s more sophisticated industrial base than the middle and western areas. Investments in pollution control significantly drive the transformation and upgrading of secondary industries. Equation (8) indicates that where LnIS is the independent variable, optimizing IS has a significant short-term impact on lowering carbon intensity. The optimization within the province not only significantly lowers its CI, but improvements in neighboring provinces’ IS also substantially reduce the province’s CI. Moreover, the provincial enhancements substantially decrease the CI across the eastern region. These findings indicate that the mechanisms relating ER to IS optimization in the eastern region are operating effectively in the short term.
Table 9.
The results of the dynamic spatial interaction effects of the three mechanisms of subsamples.
(2) Middle region
In Equation (7), ES is the dependent variable. In the short term, ER within the province positively influenced the local ES (-0.0447), neighboring provinces’ ER optimized the province’s ES (-0.0184), and the province’s ER optimized the entire middle region’s ES (-0.2321). These short-term improvements might stem from HHE reducing coal consumption under stringent ER policies. To prevent the ER of the province from causing an “extrusion effect”, neighboring provinces might exhibit an “imitation effect” in their environmental policies. Moreover, such ER efforts also decrease the CI locally and regionally due to significant positive spillover effects. However, over the long term, strict ER promotes the advancement of green technologies, enhancing energy efficiency but increasing energy demand and thus the CI of the middle region (0.1779). In Equation (8), with ES as the independent variable, short-term optimization of the province’s ES significantly reduces the CI across the entire middle region (27.9414). Therefore, the ES effect of ER in the middle region operates smoothly in the short term.
(3) Western region
The impact of ES is demonstrated in Equation (7), where ES is the dependent variable. In the short term, ER in neighboring provinces hinders the adjustment of the province’s ES (0.2791), while the province’s own ER hampers the ES adjustment across the entire western region (0.1518). This may be due to neighboring provinces implementing strict environmental measures to meet specific emission reduction targets, resulting in HHE relocating to this province and surrounding areas. Consequently, coal consumption in both this province and the entire western region increases, leading to a rise in the province’s CI (1.3173). Over a longer period, the province’s ER continues to restrict energy structural adjustments within the province (0.0128) and across the western region (0.0114). This could be due to the province’s severe ER, which drives enterprises to increase their technology levels in order to improve energy efficiency. However, increasing energy efficiency stimulates greater energy demand, thereby increasing coal consumption in both the province and the western region.
Equation (7) demonstrates the impact of IS, with LnIS as the dependent variable. ER has hindered short-term adjustments to the IS in the province (0.0192). This limitation is because the IS in the western region is more unbalanced than in the middle and eastern regions. The province’s investment in pollution control funding was more directed towards developing the secondary industry sector, such as introducing manufacturing from coastal areas and expanding the local scale of secondary industry production. In Equation (8), with LnIS as the independent variable, the imbalance in IS within the province causes a short-term increase in CI across the entire western area (216.2943). The rising proportion of industrial output in the province elevates the demand for coal and other energy sources, resulting in positive spillover effects on carbon emissions and subsequently increasing CI throughout the western region.
In conclusion, the emission reduction mechanism of ER varies in the eastern, middle, and western regions of China. In the short term, the eastern part benefits significantly from improvements in IS, while the middle region sees notable emission reductions due to changes in ES. Conversely, ER leads to an increase in CI in the western region, driven by both energy and IS. The results align with earlier research conducted by [10, 44], which emphasizes notable decreases in emissions in the eastern and middle regions. Additionally, Zhang et al. (2021) reported a rise in CI in the western region due to ER [25].
Table 10.
Results of robustness tests.
Robustness Test
This study employs alternative weighting matrices, replaces explanatory variables for robustness tests, and utilizes the DSDM to address endogeneity issues within the model. First, adjacency matrices are used to estimate alternative weighting matrices. Second, for robustness in explanatory variables, informal ER is substituted for the amount of pollution treatment completed. Following the methodology of Pargal and Wheeler (1996), indicators such as income level (average wage of on-post employees in urban units), population density (number of people per km2), and education level (proportion of people with a college education and above) are selected [54], and the entropy approach is used to compute the informal ER for each province. As demonstrated in Table 10, the estimation results for the main variables remain constant, and ER continues to reduce carbon emissions. Therefore, the study’s empirical findings are reliable and robust.
Additionally, since the DSDM can mitigate the endogeneity problem caused by bidirectional causality [55], such endogenous problems are weaker in this paper. Furthermore, this paper estimates DSDM models that include only time-lagged or spatiotemporal-lagged terms. The results in Columns (2) and (3) of Table 4 are consistent with the original results. Therefore, the endogeneity problem is successfully addressed by the empirical model employed in this study.
Conclusions
This study investigates the carbon reduction effects of ER and their mechanisms from a dynamic spatial perspective. An empirical model is developed using a combination of the STIRPAT and the DSDM models to examine the spatial interactions in carbon reduction impacts and regional differences of ER in China. The primary findings are as follows:
(1) CI exhibits significant spatiotemporal lag characteristics and spatiotemporal interaction effects. In the time dimension, the previous year’s CI positively affects the current year’s CI, suggesting that CI reduction has a temporal continuity where ongoing carbon reduction policies yield better results. In the spatial dimension, CI shows a notable spillover effect; reducing CI in a region’s middle provinces leads to a decrease in the CI of surrounding provinces. In terms of spatiotemporal interaction effects, decreasing CI in the previous year in neighboring provinces will increase CI in the province, indicating that strict ER in neighboring provinces has an “extrusion effect”, and there may be “free-riding” behavior in pollution prevention and control within the province.
(2) China’s ER significantly reduces carbon emissions and exhibits dynamic spatial interaction effects. In the short term, ER demonstrates a substantial spatial spillover effect, effectively lowering the overall CI across China, with this impact being sustainable over time. In the short term, ER optimizes ES and IS and promotes Pat. Meanwhile, ES has the best emission reduction effect (-20.54%), followed by Pat (-12.55%) and IS (-2.23%). Only Pat can contribute to long-term pollution reductions. Reasonable ER can enhance governments’ and enterprises’ environmental awareness, increasing renewable energy supply, reducing fossil fuel consumption, and optimizing the ES. Furthermore, an increase in pollution prevention and control inputs encourages the flow of capital to clean industries, encouraging polluting businesses to embrace green transformation. This will increase the level of green Pat and optimize the IS, promoting the reduction of CI in the province and across the sample region.
(3) The impact of the ER on reducing carbon emissions differs across China’s eastern, middle, and western regions. The carbon emission reduction effect of the eastern and middle regions is obvious in the short and long term. Compared with the middle and western regions, the eastern region is superior in terms of economic structure. Thus, the eastern region mainly relies on the IS to play a role in reducing CI. The middle region mainly reduces CI by adjusting its ES due to its abundance of clean energy. ER in the western region has raised CI in both the short and long term. On the one hand, ER has promoted the improvement of energy efficiency, which paradoxically stimulates an increase in energy demand. The western region’s abundance of energy resources has attracted a large number of industrial enterprises to relocate there, thus increasing energy demand and resulting in an increase in CI. On the other hand, enterprises anticipate that the government will further strengthen ER in the future, leading to increased energy costs. Therefore, enterprises accelerate their production activities at the current stage, leading to a rapid expansion of fossil energy demand in the short term, thereby increasing CI. Therefore, it is important to adopt different measures tailored to local conditions to fully leverage the carbon reduction effect of ER.
In summary, this article proposes the following policies:
(1) The government should implement all ERs nationwide and regard ERs as important tools for carbon emission reduction. Currently, China’s “dual carbon goals” task is arduous. Not only should there be a top-level design of ER at the national level, but local governments and enterprises should also enhance environmental awareness. Implement various environmental measures throughout the local administration and the entire product lifecycle, actively adjust the economic structure, maintain continuous and stable investment in green projects, encourage enterprises to improve green technology levels for green transformation, and effectively implement ER as an important policy tool for carbon emission reduction.
(2) Policymakers should leverage the dynamic spatial interaction of ER’s carbon abatement effects. Governments should strengthen ER measures in middle regional provinces and spread them to surrounding provinces. Improving the coordination mechanism of regional environmental regulatory policies is crucial. At the same time, measures should be taken to prevent some provinces from “free-riding” on neighboring provinces’ positive environmental spillover effects and relax environmental regulatory supervision.
(3) Given the varying impacts of ER on carbon emission reduction across different regions, tailored ER measures should be implemented accordingly. Provinces in the eastern region should continue investing in major pollution prevention projects, enhance green innovation, and optimize their economic structures to sustain the mitigation effects of ER. Provinces in the middle region should direct pollution control funds towards green technology innovation and enforce strict access standards to prevent HHE from relocating from other provinces. In the western region, strict controls should be placed on the migration of HHE from coastal areas, and local HHE should be closely monitored to reduce their CI.

