

Introduction
China, a populous and agricultural powerhouse, supports 22% of the global population on merely 7% of the world’s arable land. The country underscores the critical role of agriculture as the foundation of its economy, prioritizing the advancement of agricultural and rural development. China is the leading agricultural producer and a significant carbon emitter, with its agricultural carbon emissions exceeding the global average [1]. However, it is important to note that China’s extensive agricultural development paradigm has yet to fully transition regionally, and challenges related to agricultural resource scarcity and pollution persist. The swift expansion of the agricultural economy has led to a significant increase in the use of chemicals such as fertilizers, pesticides, agricultural films, and other chemical substances [2]. The excessive consumption of agricultural resources and damage to the ecological environment have become increasingly prominent issues, severely limiting the development level of agriculture in China [3].
According to the 2020 Bulletin of the Second National Pollution Source Census, in 2017, emissions from agricultural pollution sources accounted for 49.77% of chemical oxygen demand, 46.52% of total nitrogen, 22.42% of ammonia nitrogen, and 67.21% of total phosphorus emissions. The ongoing dual pressures of resources and environment, along with those of quantity and quality, have not been entirely overcome by agricultural production. With the “carbon peak” and “carbon neutrality” objectives officially elevated to national strategy in 2020, agriculture, as a significant carbon sink system, is on the brink of comprehensive systemic transformations. These transformations will undoubtedly expedite the shift towards agro-ecological and low-carbon practices, fostering the integrated and harmonious progress of agricultural economic and ecological systems. In consideration of the “dual carbon” objective, enhancing agricultural ecological efficiency emerges as a pivotal strategy for both green transformation and the elevation of agriculture. It serves as a vital mechanism for mitigating agricultural carbon emissions and managing agricultural non-point source pollution effectively [4]. Sichuan Province, a key grain-producing region in China generating the third-highest grain output nationwide, faces increasingly prominent agricultural ecological challenges. It still grapples with issues such as insufficient accumulation of rural human capital, mounting constraints on agricultural resources and ecosystems, and a diminishing per capita cultivated land area.
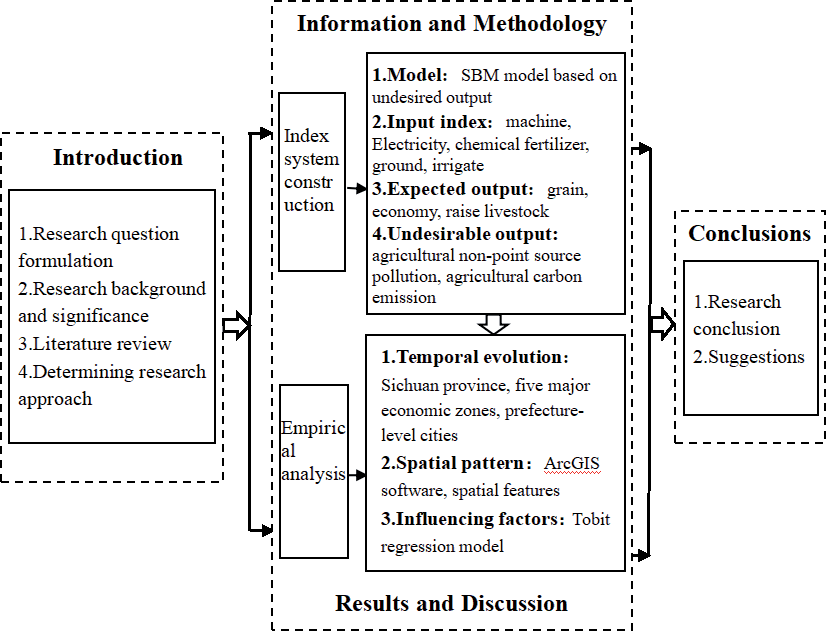
Agricultural Eco-Efficiency (AEE) stems from the concept of ecological efficiency, advocating for a reduction in resource consumption and environmental pollution while ensuring agricultural product quality. This involves enhancing agricultural production efficiency and considering ecological benefits [5]. Methods to assess agricultural eco-efficiency include life cycle assessment [6], grey water footprint perspective evaluation [7], DEA model analysis [8, 9], and SBM model analysis [10, 11], among others. Scholars have employed nuclear density analysis, geographical detectors, and spatial correlation methods to analyze the spatial characteristics of the nation and key agricultural regions [12, 13]. In terms of efficiency influencers, factors such as agricultural science and technology input, farmers’ disposable income, population size, urbanization rate, and GDP impact agricultural ecological efficiency to varying degrees [14, 15]. Following the “dual carbon” strategy proposal, agricultural carbon emissions and pollution have been considered non-expected output indicators, primarily analyzing their effects on agricultural ecological efficiency [16]. Under this strategy, studies on agricultural ecological efficiency should emphasize reducing carbon emissions and improving agricultural production’s energy utilization efficiency, harnessing the carbon sink’s potential. Building on existing research, this paper focuses on Sichuan Province and its 21 prefecture-level cities as the subjects of inquiry. It empirically measures the levels of agricultural ecological efficiency, its spatiotemporal differentiation, and influencing factors from 2013 to 2022. Enhancing Sichuan’s agricultural ecological efficiency, elevating the quality of agricultural development, and facilitating the achievement of the “dual carbon” objectives are all of significant practical importance. Therefore, the technical route studied in this paper is shown in Fig. 1.
Materials and Methods
Overview of the Study Region
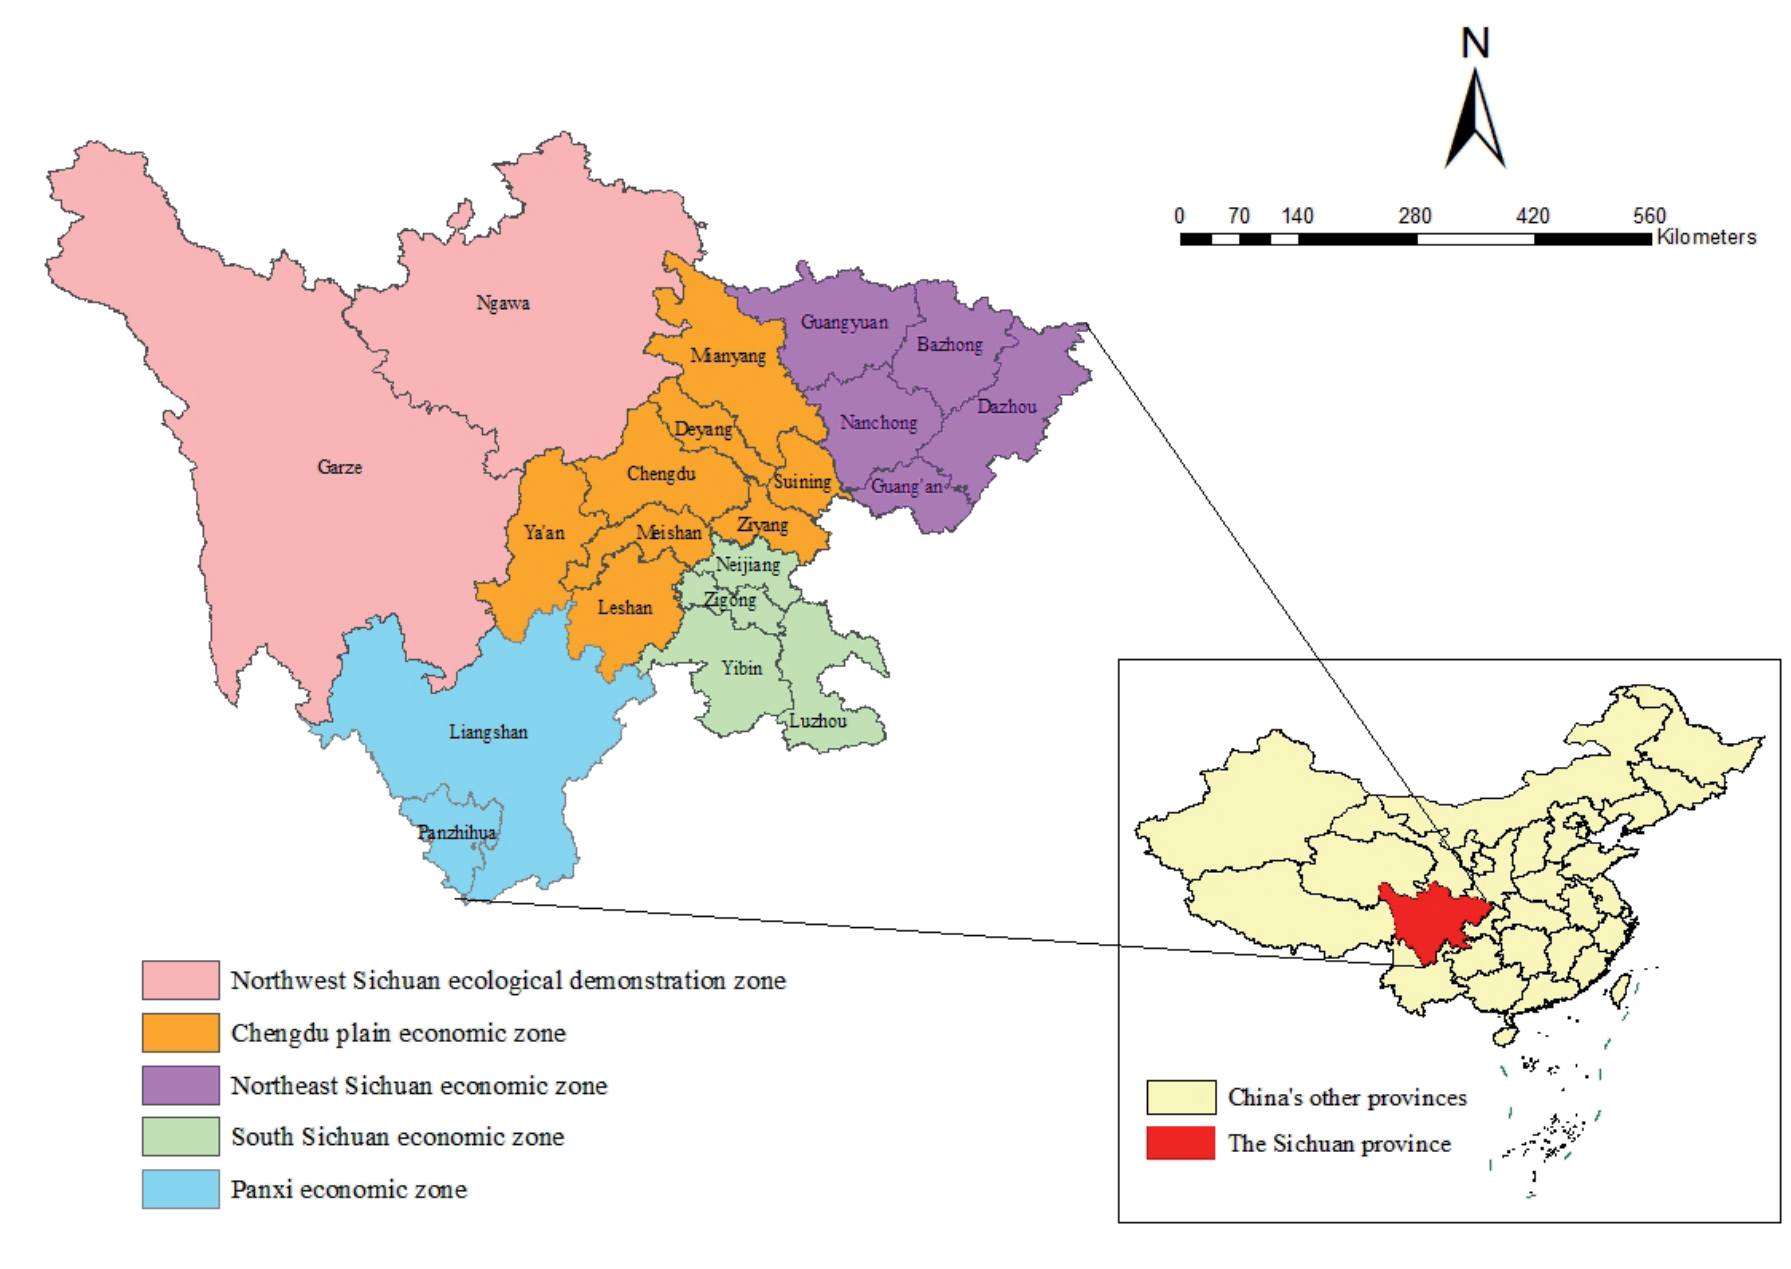
Sichuan Province, located in southwest China’s interior, is positioned at the upper reaches of the Yangtze and Yellow Rivers. As of the end of 2023, the province’s registered population stood at 90.714 million. Known as a significant traditional agricultural region, Sichuan is one of China’s 13 principal grain-producing provinces and the sole major grain producer in the west. In 2023, the total agricultural output value reached 605.66 billion yuan, contributing 10.07% of the overall GDP. According to the Bulletin of the Second National Survey of Pollution Sources in Sichuan, agricultural water pollutant discharges accounted for 37% of chemical oxygen demand, 14.37% of ammonia nitrogen, 40.19% of total nitrogen, and 58.4% of total phosphorus. This highlights the pressing challenge of controlling non-point source agricultural pollution in the province. Sichuan Province, covering an expanse of 486,000 square kilometers, administers 21 prefecture-level entities comprising 18 cities and 3 autonomous prefectures. Geographically, the province is segmented into five distinct economic zones: the Chengdu Plain Economic Zone, the Southern Sichuan Economic Zone, the Northeastern Sichuan Economic Zone, the Panxi Economic Zone, and the Northwest Sichuan Ecological Demonstration Zone (refer to Fig. 2).
As a national clean energy demonstration hub, Sichuan boasts relatively low total carbon emissions, GDP per unit of carbon emissions, and per capita carbon emissions among China’s nine major economic regions. In 2022, the province achieved 1.9717 million tons of nationally certified voluntary emission reduction (CCER) transactions in the carbon market, making up 22.91% of the national volume and ranking third nationwide. Against the dual carbon objectives, Sichuan strives to transform its ecological assets into developmental advantages. The many challenges faced encapsulate characteristics typical of broader trends, offering insights valuable for guiding other Chinese provinces and cities’ agricultural, ecological, and low-carbon strategies.
In pursuit of a precise and efficacious analysis concerning the temporal and spatial evolution characteristics, as well as the influencing factors of agricultural eco-efficiency in Sichuan Province under the “two-carbon” target framework, this study primarily utilizes data sourced from the Sichuan Statistical Yearbook (2014-2023), statistical yearbooks and bulletins of 21 cities (prefectures) within Sichuan Province, the EPS database, data from the third National Agricultural Census in 2016, and application service platforms for land survey results sharing, among other pertinent statistical websites. To address any data gaps, an interpolation method was employed to estimate values in line with the time series data trend.
SBM Model Based on Undesired Output
The SBM model, an enhancement of the traditional DEA model, incorporates non-expected output and relaxation variables into its efficiency measurement. This addresses the shortcomings of the traditional DEA model in accurately measuring non-expected output factors. The SBM model can simultaneously consider multiple output and input factors, demonstrating strong applicability. For this study, the SBM model based on non-expected output proposed by Tone [17] is selected. Tone incorporated the slack variable into the objective function to enhance the efficiency differentiation among decision-making units (DMUs) and assess their efficiency values in the presence of undesirable outputs [18]. Its calculation formula is as follows:
(1)
In formula (1), θ represents the evaluation value of agricultural ecological efficiency, with its value ranging from 0 to 2. A higher θ value indicates better agricultural ecological efficiency. m, S1, and S2 represent the number of types of inputs, expected outputs, and undesirable outputs, respectively. xi0, yko, and zιo, represents data elements in the input, expected output, and unexpected output matrices, respectively; Six, Sky, and Sιz, are the relaxation variables of input, expected output, and unexpected output, respectively, λ is the intensity variable.
Tobit Regression Model
To address the limitations of Ordinary Least Squares (OLS) regression, such as its inability to distinguish between non-limit and limit values, we employ a Tobit regression model to analyze the determinants of agricultural ecological efficiency in Sichuan Province. Variables are transformed using natural logarithms to mitigate heteroscedasticity. The specific formulation of the original Tobit model is presented below:
The Tobit simplified model’s specific formula is as follows, with agricultural ecological efficiency serving as the dependent variable and the influencing factors as the independent variables:
In formula (3), Y denotes agricultural ecological efficiency, α0 is a constant term, i represents the year, βj is an undetermined coefficient, and εi is a random disturbance term.
Index System Construction
This article aims to minimize resource consumption while ensuring agricultural productivity and achieving key crop production targets in the context of dual carbon goals. It underscores the use of advanced agricultural technologies and information technology to mitigate non-point source pollution and reduce agricultural carbon emissions. The input indicators include machinery, electricity, fertilizers, land, and irrigation; output indicators comprise both desired (grain, economic, livestock) and undesired outputs (pollution, emissions). Due to the absence of a standardized approach to carbon emission accounting in China, this study references the statistical method proposed by Cehn et al. [19]. Considering data availability and consistency, 10 secondary indicators were selected to construct the agricultural ecological efficiency measurement system, as shown in Table 1.
Table 1.
The index system for measuring agricultural ecological efficiency.
Table 2.
Index system for assessing influencing factors of agricultural ecological efficiency.
A multitude of intricate factors influence agricultural ecological efficiency. In light of Sichuan Province's agricultural progress, environmental attributes, and accessible data, alongside insights from pertinent studies, this paper identifies five key indicators shaping agricultural ecological efficiency: fiscal support for agriculture, irrigation rate, mechanization level, industrialization level, and farmers' income level, summarized in Table 2.
Results and Discussion
Temporal Evolution Analysis
In this study, the Max DEA 8.0 software was employed to measure the agricultural ecological efficiency of Sichuan Province and its 21 cities (prefectures) over the period from 2013 to 2022. The specific results are presented in Table 3. Agro-ecological efficiency was classified into five stages based on relevant literature: low efficiency [0, 0.60], medium efficiency [0.60, 0.75], medium-high efficiency [0.75, 0.90], high efficiency [0.90, 1.0], and relatively complete efficiency [1.0, 1.2] [20]. During the study period, the average agricultural eco-efficiency in Sichuan Province was 0.98, indicating a high efficiency level.
Analysis of Temporal Evolution in the Whole Province
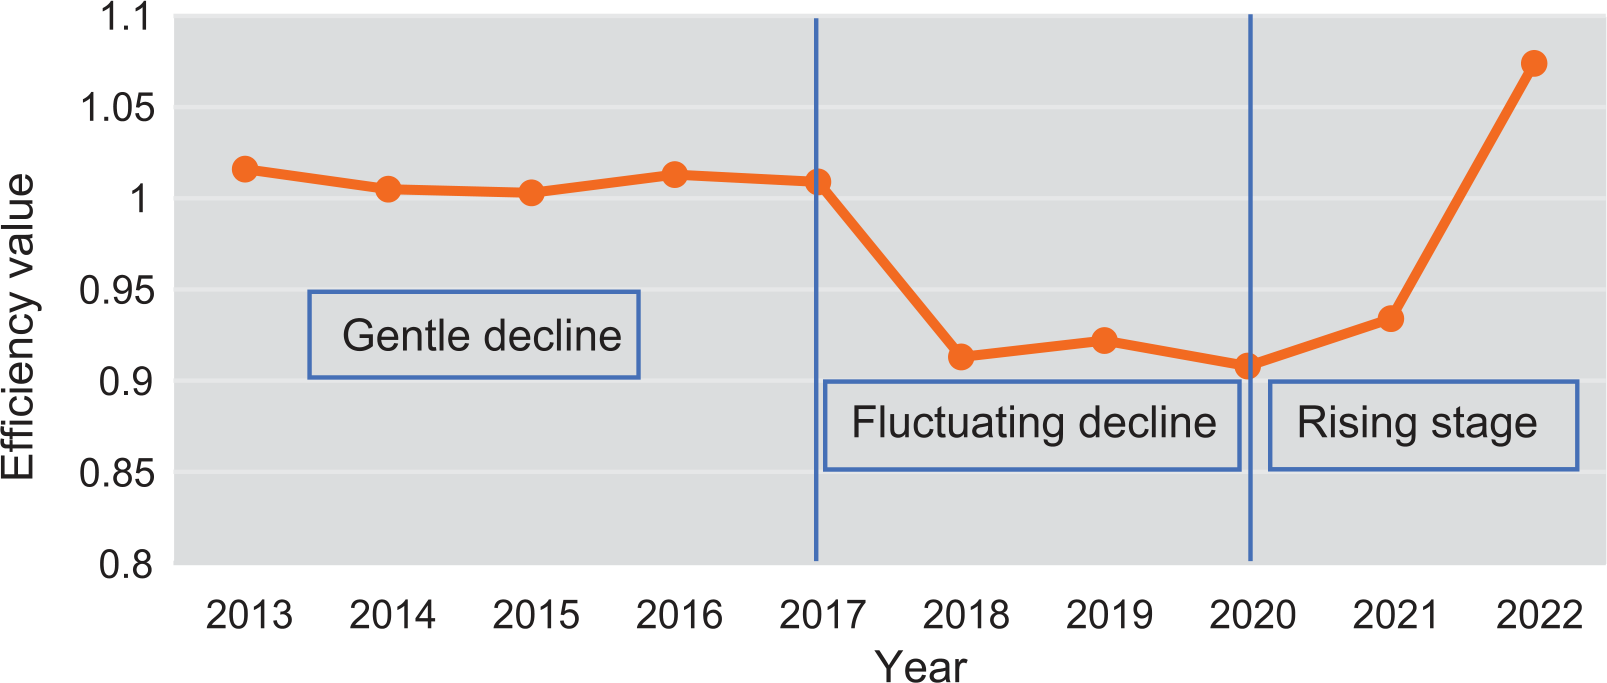
From 2013 to 2022, the agricultural ecological efficiency of Sichuan Province exhibited a trend of fluctuating growth. The efficiency value ranged from 1.016 to 1.074, with an average annual growth rate of 0.62%. This period can be divided into three stages: In the first stage (2013-2017), the agricultural ecological efficiency of Sichuan Province experienced a gentle decline, with the efficiency value fluctuating slightly within the range of 1.003 to 1.016. This stage is characterized by a relatively complete efficiency level, indicating that the input and output of agricultural production activities and their impact on the environment were reasonable. The second stage (2017- 2020) saw a fluctuating decline in the agricultural eco-efficiency of Sichuan Province, with the efficiency value decreasing from 1.009 to 0.908. During this period, the relative complete efficiency level transitioned to a high efficiency level. Finally, in the third stage (2020- 2022), the agricultural ecological efficiency of Sichuan Province was in a rising stage, with the efficiency value increasing from 0.908 to 1.074 and an average annual growth rate of 8.75%, as shown in Fig. 3.
Table 3.
Displays the estimated values of agricultural ecological efficiency from 2013 to 2022.
In alignment with China’s intensifying emphasis on green and sustainable development, the Sichuan provincial government has increasingly prioritized agriculture’s green and ecological progression. In May 2022, the “14th Five-Year Plan for the Protection of Agricultural and Rural Ecological Environment in Sichuan Province” was released. This plan centers on enhancing the agricultural and rural ecological environment and aims to elevate the supervision level of the agricultural and rural ecological environment, thereby fostering a “green and prosperous” ecological countryside.
Temporal Evolution Analysis of Five Major Economic Zones
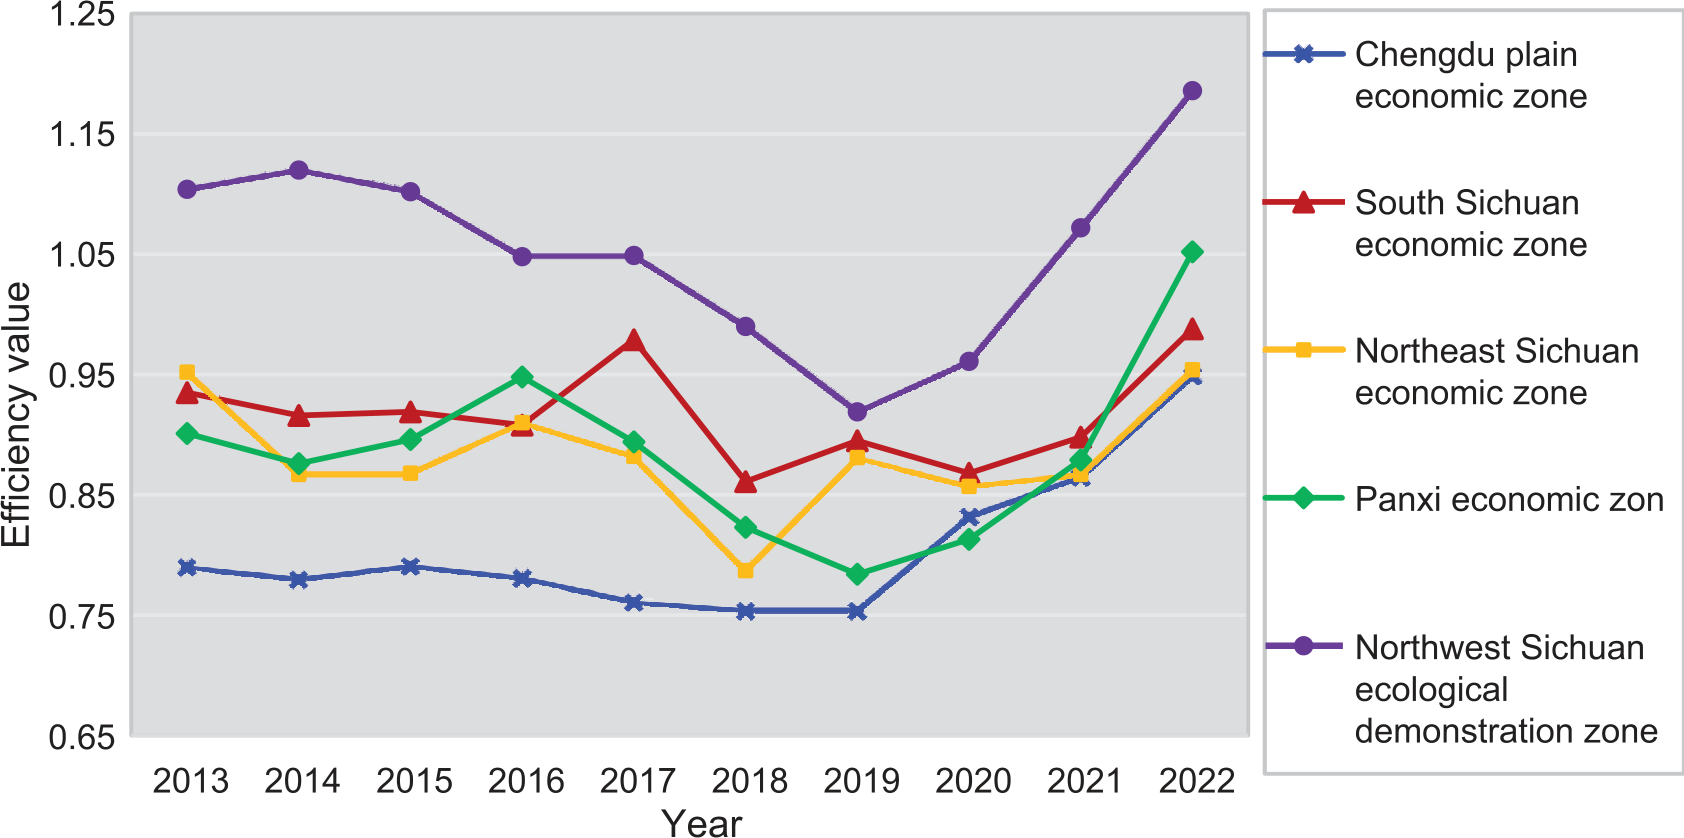
The agricultural ecological efficiency of Sichuan province’s five major economic zones exhibits fluctuating growth patterns, characterized by a distinct hierarchical order. This ranking is as follows: ranked from highest to lowest as follows: Northwest Sichuan Ecological Demonstration Zone > Southern Sichuan Economic Zone > Panxi Economic Zone > Northeastern Sichuan Economic Zone > Chengdu Plain Economic Zone, as shown in Fig. 4.
(1) As a key ecological functional area in Sichuan Province, the Northwest Ecological Demonstration Zone has an average annual agricultural ecological efficiency of 1.055, indicating relatively full efficiency. This efficiency level consistently surpasses other economic zones and the provincial average, achieving relative effectiveness in agricultural DEA. The region benefits from superior natural resources and ecological conditions, focusing on ecological protection and green development, contributing to its high agricultural ecological efficiency.
(2) The South Sichuan Economic Zone, Sichuan Province’s second growth pole, has an average annual agricultural ecological efficiency of 0.917, falling within the high-efficiency range. Positioned as a green development demonstration zone in the upper reaches of the Yangtze River, it emphasizes green and low-carbon agricultural production, effectively reducing agricultural carbon emissions and laying the ecological foundation for high-quality agricultural development.
(3) The Panxi Economic Zone, Northeast Sichuan Economic Zone, and Chengdu Plain Economic Zone have average annual agricultural ecological efficiencies of 0.886, 0.882, and 0.806, respectively, categorizing them within the medium-to-high efficiency range. The Panxi Economic Zone, as a significant industrial base in Sichuan, leverages its unique water energy, mineral, and biological resources. The Northeast Sichuan Economic Zone, integrating old revolutionary base areas, impoverished regions, and remote mountainous areas into an underdeveloped region, requires enhanced agricultural ecological protection awareness. The Chengdu Plain Economic Zone is planned as the core growth pole of the Chengdu-Chongqing economic circle and a pioneering area for high-quality development in Sichuan Province. However, rapid industrialization has led to land non-agriculturalization and a decline in arable land quality, resulting in its lower ranking in agricultural ecological efficiency among the five economic zones, indicating significant room for improvement.
Analysis of Temporal Evolution of Prefecture-level Cities
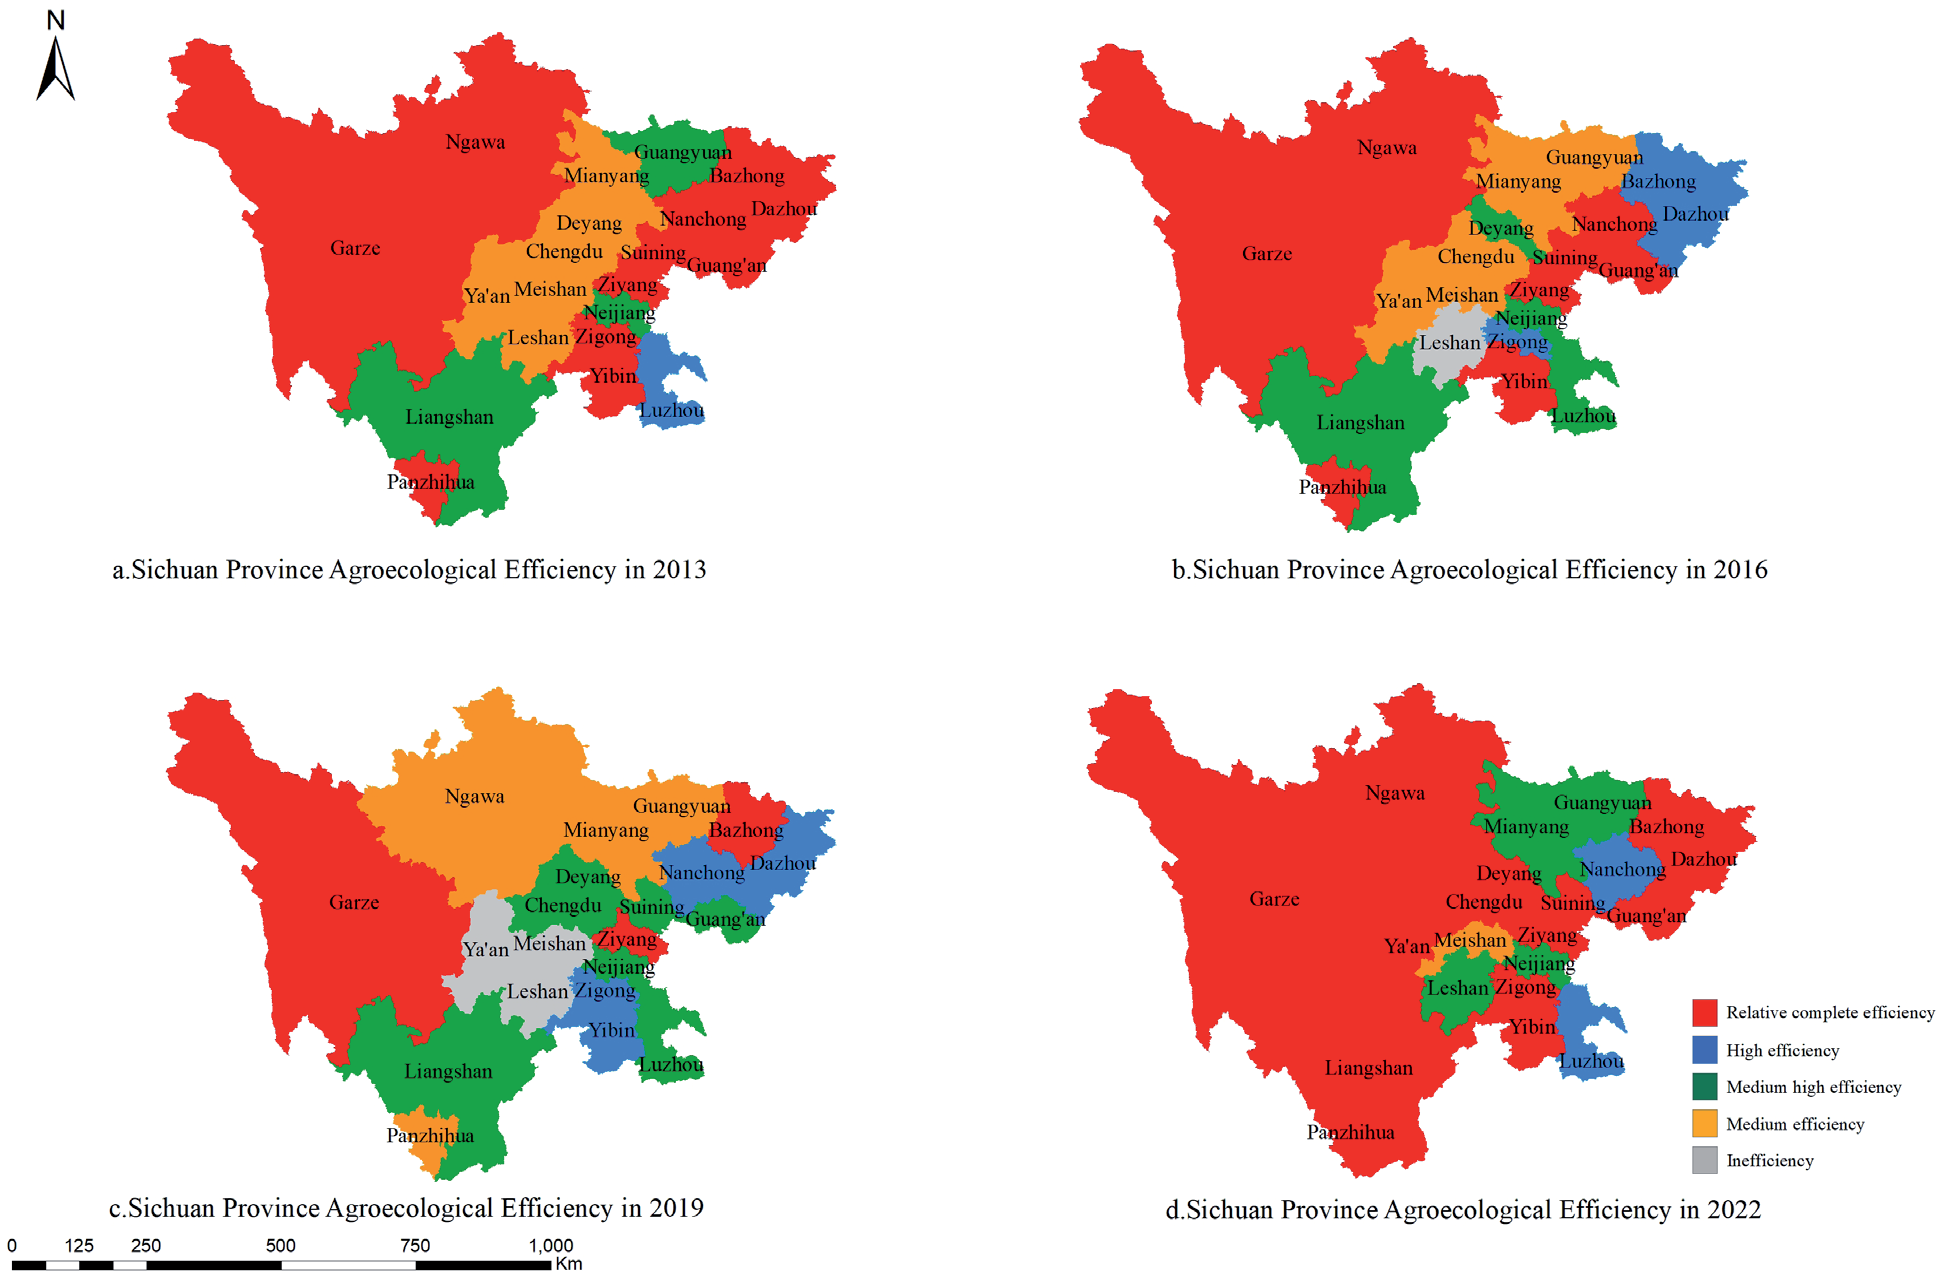
During the study period, the agricultural eco-efficiency of 20 prefecture-level cities in Sichuan Province (excluding Nanchong City) exhibited fluctuating increases, albeit with differing evolutionary trends. In 2013, six cities were classified at the medium efficiency level, three at the higher medium efficiency level, one at the high efficiency level, and eleven at the relatively full efficiency level. As low-carbon, green, and sustainable development principles gained prominence, the Sichuan provincial government increasingly prioritized agro-ecological advancement, bolstering policy support. By 2022, the number of cities at the medium efficiency level had diminished to one, while those at the higher medium, high, and relatively full efficiency levels had escalated to four, two, and fourteen, respectively.
The top three cities in terms of average annual agricultural eco-efficiency were Ganzi Prefecture, Aba Prefecture, and Yibin, with efficiencies of 1.120, 0.990, and 0.985, respectively. These cities consistently achieved high efficiency levels. Fourteen cities (prefectures), including Zigong, Yibin, Guang’an, Panzhihua, and Chengdu, had efficiencies between 0.75 and 1.0, placing them at a middle level. The average annual agricultural eco-efficiency in Mianyang, Leshan, Meishan, and Guangyuan was below 0.75. Ganzi and Aba Prefectures, located in the northwestern and western parts of Sichuan Province, are endowed with abundant natural resources. Their agriculture is characterized by specialty crops such as fruits, vegetables, yaks, and highland barley, which provide a natural advantage for developing green, ecological, and low-carbon agriculture. This approach involves minimal input of chemicals such as fertilizers and pesticides, resulting in reduced environmental pollution, lower agricultural carbon emissions, and higher agricultural ecological efficiency. In contrast, Meishan and Guangyuan Cities, in the southeastern and northern parts of Sichuan Province, have relatively weaker economic foundations and lack leading enterprises to drive their industries. Consequently, the added value of their agricultural products is low, leading to relatively low agricultural ecological efficiency. However, leveraging their existing ecological base and green endowments, there is significant potential for agricultural ecological development.
Spatial Pattern Differentiation Analysis
In this study, we selected four representative years: 2013, 2016, 2019, and 2022. Using ArcGIS software, we created a spatial distribution map based on the five agricultural eco-efficiency levels mentioned above. This map illustrates the regional differences and characterizes the spatial distribution patterns of agricultural eco-efficiency across various cities (prefectures) in Sichuan Province. The results are presented in Fig. 5.
As illustrated in Fig. 5, the spatial distribution of agricultural eco-efficiency across Sichuan Province is characterized by high efficiency in the east and west, with lower efficiency observed in the central region. High-efficiency prefecture-level cities are primarily located within the ecological demonstration zone of northwest Sichuan and the economic zone of South Sichuan. Notably, Ganzi Prefecture, Aba Prefecture, Yibin City, and Zigong City serve as the epicenters of high-efficiency growth, with adjacent cities exhibiting a diminishing “core-edge” pattern in their development levels. The relatively subpar agro-ecological efficiency observed between the northeast Sichuan Economic Zone and the Chengdu Plain Economic Zone can be attributed to the pronounced disparities in agro-ecological efficiency among prefecture-level cities. These disparities stem from Sichuan Province’s complex terrain, variable climate, ecological environment, natural conditions, and resource endowment.
A significant polarization phenomenon was evident during the initial phase of green and low-carbon agricultural development in Sichuan Province. Areas with high efficiency and above maintained an effective state of Data Envelopment Analysis (DEA) for agricultural ecological efficiency, while regions with medium to high efficiency and below exhibited slow improvement. As the province increased its publicity and support for agro-ecological policies, a trickle-down effect superseded the polarization effect in the latter stages of agro-ecological development. Consequently, areas with high efficiency and above began to function as growth poles, positively influencing surrounding regions. This trend suggests that agricultural ecological efficiency will likely see substantial improvements across most areas of Sichuan Province by 2022.
Analysis of Influencing Factors
Agricultural ecological efficiency values are considered left-censored data, with a censoring point at zero. Using the agricultural ecological efficiency values of Sichuan Province as the dependent variable and the five aforementioned factors as independent variables, a Tobit regression analysis was conducted. Initially, the model underwent a likelihood ratio test, yielding a P-value of 0.000 (less than 0.05), indicating that the model is valid. The results of the Tobit regression are presented in Table 4. The Variance Inflation Factor (VIF) measures the severity of multicollinearity among the independent variables. A VIF greater than 10 typically indicates a problem with multicollinearity. According to the Tobit regression results shown in Table 4, all five independent variables have VIF values less than 10, suggesting no significant multicollinearity issue among the variables. An R2 value of 0.792 indicates a good fit for the model. An F-test with a P-value less than 0.05 confirms that the model is statistically significant and meaningful.
(1) Fiscal Support for Agriculture. The coefficient is -0.138, and the P-value is 0.140, indicating a negative but insignificant impact. This may be because fiscal funds for agriculture are primarily allocated to improving agricultural production infrastructure, which does not directly enhance ecological efficiency. Additionally, subsidies for fertilizers, agricultural machinery, and diesel fuel encourage farmers to use more chemical fertilizers, increasing environmental damage and pollution and reducing ecological efficiency.
Table 4.
Tobit regression results.
(2) Irrigation Rate. The regression coefficient is 0.622, and the P-value is 0.017, indicating a significant positive impact. Appropriate irrigation rates can prevent crop water shortages, leading to better growth and higher yields. Well-developed water facilities promote the recycling of water resources, thus enhancing agricultural ecological efficiency.
(3) Mechanization Level. The regression coefficient is -0.218, and the P-value is 0.002, indicating a significant negative impact. Although mechanization increases production efficiency, the pollution it causes, such as exhaust emissions and oil leaks, outweighs its benefits. This pollution affects the normal growth of crops, leading to reduced agricultural output and lower quality of agricultural products, which is detrimental to improving agricultural ecological efficiency.
(4) Industrialization Level. The regression coefficient is -0.156, and the P-value is 0.051, indicating a significant negative impact. The rapid development of industrialization leads to the transfer of rural labor from agriculture to industry, resulting in labor shortages in rural areas. This labor shortfall is often compensated with chemical products and machinery, leading to large agricultural carbon emissions and non-point source pollution, causing ecological and environmental problems.
(5) Farmers’ Income Level. The regression coefficient is 0.214, and the P-value is 0.013, indicating a significant positive impact. Higher income levels make farmers more willing to invest in agricultural production, promoting the development of green products. Combining these with hotspots boosts rural wellness tourism, enhancing agricultural ecological efficiency. The increase in residents’ income also reflects the continuous development of the regional agricultural economy, which is beneficial for coordinating the joint development of the rural economy and ecological environment.
Conclusions
This study employs an SBM model with undesirable outputs to measure the agricultural ecological efficiency of Sichuan Province and its 21 prefecture-level cities. We conducted a quantitative analysis of the temporal evolution, spatial distribution trends, and factors influencing agricultural ecological efficiency in Sichuan Province. The following conclusions are drawn:
(1) From 2013 to 2022, the annual average agro-ecological efficiency in Sichuan Province was 0.98 during the high efficiency stage. The efficiency value increased from 1.016 to 1.074, with an average annual growth rate of 0.62%. The overall trend exhibited fluctuating growth, primarily consisting of three stages: decline, decline, and rise of volatility. The five economic zones in Sichuan Province exhibit distinct hierarchical characteristics, ranked as follows: Northwest Sichuan Ecological Demonstration Zone > South Sichuan Economic Zone > Panxi Economic Zone > Northeast Sichuan Economic Zone > Chengdu Plain Economic Zone. Ganzi, Aba, and Yibin have made significant progress in green and low-carbon agriculture, while Mianyang, Meishan, and Guangyuan cities require improved agro-ecological efficiency.
(2) The agro-ecological efficiency in prefecture-level cities within Sichuan Province exhibits an uneven spatial distribution, characterized by a “high in the west, low in the east” pattern. High-efficiency cities are predominantly located in the ecological demonstration zone of northwest Sichuan and the economic zone of South Sichuan. Notably, Ganzi Prefecture, Aba Prefecture, Yibin City, and Zigong City serve as the epicenters of high-efficiency growth. Surrounding cities exhibit diminished development levels by the “core-edge” model. In contrast, the northeast Sichuan and Chengdu Plain economic zones demonstrate relatively lower agro-ecological efficiency.
(3) The impacts of various factors on agricultural ecological efficiency in Sichuan province differ in both direction and magnitude. Irrigation rates and farmers’ income levels significantly enhance agricultural ecological efficiency, while mechanization and industrialization levels exert a significant negative influence. The effect of fiscal support for agriculture is negative but not statistically significant.
In pursuing the “dual carbon” objective, advancing rural revitalization, and fostering an ecological civilization in China, enhancing agricultural ecological efficiency is crucial for achieving agricultural ecological transformation [21]. Considering these conclusions, this research offers the following suggestions:
(1) To enhance agricultural efficiency and foster low-carbon ecological development across regions, Sichuan Province must capitalize on its regional resource endowments to tailor agricultural planting and industrial structures. This strategy will cultivate a diverse array of distinctive agricultural industries. Additionally, optimizing the allocation of agricultural resources and facilitating inter-regional exchanges in technology, talent, and projects are crucial. Exploring the valuation of agricultural ecological resources and piloting carbon sink economies can further this goal, culminating in establishing an effective agricultural ecological protection compensation mechanism.
(2) Optimizing the structure of financial support for agriculture can enhance the ecological orientation of funds. Currently, the intensity of fiscal support for agriculture has a negative impact on the agricultural ecological efficiency in Sichuan Province. The government could implement agricultural environmental protection subsidy policies and increase subsidies for pollution prevention in agriculture. Producers who prevent or mitigate non-point source pollution should receive corresponding production subsidies. Additionally, enterprises exceeding pollution emission standards must make necessary improvements to achieve harmonious development between the environment and economy, thereby strengthening the protective effect of fiscal agricultural support funds on agricultural ecological efficiency.
(3) To enhance regional collaboration and harness the growth pole effect in agricultural ecology, addressing the notable disparities in agricultural ecological efficiency across Sichuan Province and its 21 prefecture-level cities is imperative. These differences exhibit a distinct hierarchical characteristic that necessitates strengthened inter-regional cooperation and the establishment of effective mechanisms for ecological partnerships and regional synergy. The spillover effects from growth pole cities can be amplified by facilitating the exchange and collaboration of agricultural resources among neighboring areas and constructing ecological collaboration and linkage mechanisms. This, in turn, will radiate outwards, stimulating improvements in agricultural ecological efficiency throughout the surrounding regions.

