

Introduction
Achieving a win-win situation of mitigating climate change and ensuring food security is a serious challenge facing global agricultural development [1]. Studies have shown that agricultural production is the second largest source of greenhouse gas emissions, accounting for about 21% to 25% of total anthropogenic greenhouse gas emissions.
China’s agricultural GHG emissions already account for 17% of the country’s total emissions [2], which has become an obstacle to the transition to green agriculture under the “double carbon” target. To this end, the Chinese government has successively introduced policies such as the “14th Five-Year Plan for National Agricultural Green Development” and the “Implementation Plan for Agricultural and Rural Emission Reduction and Carbon Sequestration”.
In 2024, it issued the “Interim Regulations on the Administration of Carbon Emission Trading”, which further standardized carbon emission trading and helped achieve the goals of “carbon peaking” and “carbon neutrality”. At the same time, the carbon sequestration effect of agricultural production should not be overlooked. Previous studies have often underestimated or even ignored the important carbon-sink and sequestration capacity of agricultural ecosystems. More and more research has focused on the carbon sequestration effect of agricultural production, the influencing factors, and synergistic measures for carbon sequestration and emission reduction.
Currently, many scholars are focusing on issues such as carbon sources, sinks, and surpluses in agricultural production. Their research is concentrated on accounting for the temporal and spatial characteristics of carbon emissions, carbon absorption, and carbon footprints, as well as the influencing factors. The research concludes that there are significant inter-provincial differences in carbon emissions from agricultural production in China, showing a trend of high in the west and low in the east, and the differences between major grain-producing areas, production-sales balance areas, and major sales areas are also different [3].
Climate, soil, management measures, policies and regulations, economic development, and different agricultural management practices all have an important impact on carbon emissions [4]. Research methods can be broadly divided into two directions. One is “bottom-up” research, which involves research through model simulations of natural ecosystems, sample plot surveys, and remote sensing estimates. This method is suitable for large-scale investigations, but data processing is cumbersome. The other is “bottom-up” research on socio-economic systems using emission factor methods (IPCC), factor decomposition methods, and measured methods, which are more applicable and flexible. In terms of research scale, it covers multiple scales such as macro and micro, and multiple systems such as crop-planting systems, such as national, regional, provincial, rice, wheat, corn, etc.
Existing research has laid a solid foundation for subsequent research, but there is no uniformity in the definition of the boundaries of research objects and the application of methods. There is a lack of systematic analysis for different regions and crop types, and research on agricultural technology progress and policy mechanisms is also very insufficient. Although some scholars abroad have conducted related research, for example, Visser et al. calculated the carbon footprint of the entire life cycle of Australian cotton, and the boundaries included direct emissions (such as fertilizer application and diesel consumption), indirect emissions (such as the production and use of electricity resources) and emissions from the production process of agricultural materials [5]. Peter, when calculating the carbon footprint of German winter wheat, the boundary is from the production of agricultural materials to the harvest of winter wheat and does not include emissions from waste disposal [6]. Bhavna et al. believe that the carbon footprint of agriculture is divided into three levels: energy combustion, crop cultivation, and animal fermentation, among which energy input, fertilizers, and pesticides play a major role [7]. However, localized carbon emission cases of agricultural production adapted to China’s national conditions still need to be added. Jiangsu is an important grain-producing area in China with favorable conditions for agricultural production, but it also faces the challenges of “high input, high emissions, and high pollution,” which have led to increasingly prominent problems of marginalization, reverse intensification, and reverse ecologization of cultivated land. Current research on agricultural carbon emissions in Jiangsu has used the IPCC carbon emission coefficient method and inventory method to comprehensively calculate the temporal evolution characteristics of carbon emissions from the province as a whole and from the planting industry. However, there has been a lack of attention to the spatial differences in agricultural carbon emissions and their influencing factors [8].
This study takes Jiangsu as a case study and uses research methods such as the carbon emission factor method and geographic detector to quantitatively measure the temporal and spatial development characteristics of agricultural carbon emissions, carbon absorption, and carbon footprint at the municipal level in Jiangsu from 2000 to 2020. It analyzes the dominant factors influencing the temporal and spatial differences in agricultural carbon footprint in Jiangsu and the interactions between these factors in order to provide a research basis for carbon sequestration and emission reduction and synergistic policies.
Materials and Methods
Overview of the Research Area
Jiangsu is located in the eastern coastal region of China, extending from 30°45′ to 35°08′ north latitude and 116°21′ to 121°56′ east longitude. It has a land area of 107,200 km2, accounting for about 1.12% of the country’s total area, and governs 13 cities and 95 counties (towns, districts). The province has a flat terrain, moderate climate, and favorable conditions for agricultural production, with plains accounting for about 70% of the total area. The Jiangsu Provincial Government has divided the province into three major economic regions (Fig. 1) based on regional characteristics: Southern Jiangsu, Central Jiangsu, and Northern Jiangsu.
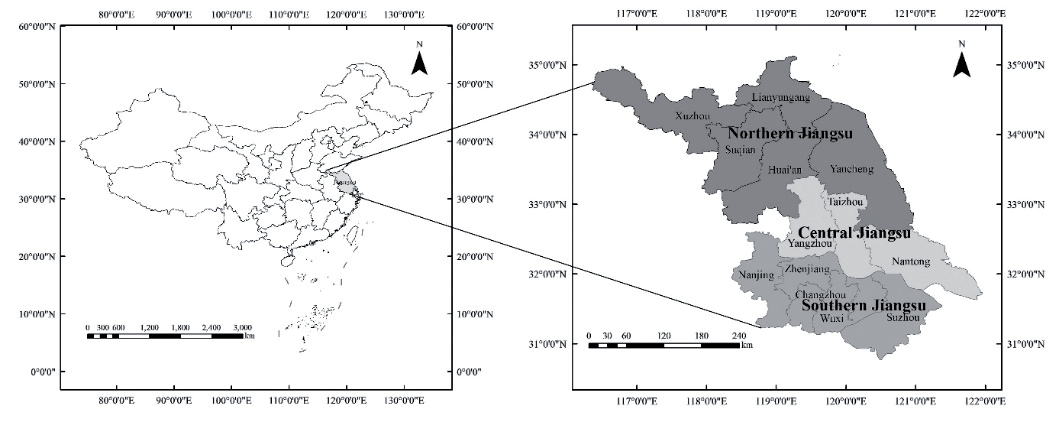
The carbon emissions from agricultural production activities in Jiangsu should not be ignored. In 2020, the fertilizer application intensity in Jiangsu was 375.41 kg/hm2, which is 1.67 times the internationally recognized safe upper limit for fertilizer application. Although lower than in previous years, it is still far higher than the appropriate application rate.
Jiangsu was selected as a research site for the following reasons: One of the representative major grain producing areas. As a typical high-yield and high-efficiency agricultural area, the green development of agriculture in Jiangsu is related to the success or failure of China’s green agricultural transformation. It is a typical region with significant regional differences. Within the region, there are significant differences in resource and environmental endowments, and socio-economic development characteristics differ significantly, with large spatial differences in the carbon footprint of agricultural production. It is suitable for analyzing and exploring the implementation of policies adapted to local conditions. As one of the typical economically developed regions, Jiangsu is socially and economically developed, with a high level of modern agricultural production technology within the province. The government supports green development policies, and as a pilot area for China’s reform, it can serve as a reference for the green development of agriculture in other regions.
Data Sources
There are two main types of data sources used in this article: (1) Agrochemical input data: The statistical data for 2001-2020 on the amounts of chemical fertilizers, pesticides, plastic sheeting, agricultural diesel fuel, sown area, cultivated area, and effective irrigated area used in various cities and counties in Jiangsu come from the Jiangsu Rural Statistical Yearbook for the same period. Among them, the data on cultivated land area in 2019 and 2020 are from the “Land Survey Results Sharing Application Service Platform” (https://gtdc.mnr.gov.cn/ Share#/), which is the data from the “Third National Land Survey”; (2) administrative division vector data: from the “National Earth System Science Data Sharing Platform - Yangtze River Delta Science Data Center” (http://nnu.geodata.cn/), with a total of 13 urban units based on 2020 as the benchmark.
Research Methods
Broadly defined, agriculture includes crop production, forestry, livestock production, fisheries, and services for agriculture, forestry, livestock, and fisheries. This study, however, focuses on narrowly defined agriculture (crop production) and primarily calculates the carbon emissions, carbon uptake, and carbon footprint of crop production. In the process of agricultural production, the main sources of carbon emissions include those generated during the production and use of chemical fertilizers, pesticides, agricultural films, and diesel, as well as those caused by energy consumption during agricultural irrigation and plowing [9]. This method is particularly applicable to crop-based agricultural systems, where inputs such as fertilizers, pesticides, and diesel fuel contribute significantly to carbon emissions, and is commonly used to assess the carbon impacts of agricultural practices at a regional scale.
Subsection Heading
Accounting of Carbon Emissions in Agricultural Production
The most common method in the study of carbon emission measurement in agricultural production is the emission coefficient method. In the process of agricultural production, the activity level data of carbon emission sources is multiplied by the carbon emission coefficient to obtain the carbon emission [10]. This method is well suited for analyzing large-scale agricultural data where individual measurements may not be feasible. In this study, it is used to calculate emissions from different agricultural activities, providing a consistent and comparable method for assessing the carbon footprint of different crop production practices over time. The formula to calculate carbon emission is
Where E is the total carbon emissions (kg); Qi is the ith type of carbon emission source; and EFi is the emission factor of the ith type of carbon emission source. The carbon emission factors of agricultural production are shown in Table 1.
The carbon emission intensity of agricultural production is the ratio of carbon emissions to cultivated area, which reflects the carbon emission capacity per unit of cultivated area [11]. The calculation formula is:
Where EI is carbon emission intensity; E is total carbon emissions (kg); and S is cultivated land area (hm2).
Accounting for Carbon Sequestration in Agricultural Production
Crops play a significant role in carbon sequestration by absorbing carbon dioxide from the atmosphere through photosynthesis during the growing season. The amount of carbon absorbed is calculated using the economic yield of the crop and the corresponding economic coefficient [14, 15]. The formula is:
Where i is the ith crop; C is the total carbon uptake of the crop (kg); Ci is the carbon uptake of the ith crop (kg); Cf is the carbon required to be absorbed by the ith crop to synthesize a unit mass of dry matter, i.e., the carbon uptake rate; Dw is the biological yield of the ith crop (t); Yi is the economic yield of the ith crop (t); Wi is the moisture content of the ith crop; and Hi is the economic coefficient of the ith crop. The economic coefficients (Hi), carbon uptake rates (Cf), and moisture contents (Wi) of the main crops are shown in Table 2.
Calculating the Carbon Footprint of Agricultural Production
The concept of ecological footprint is used, and the ratio of total carbon emissions to carbon sequestration per unit area is used to determine the area of productive land required to sequester carbon emissions from agricultural production, i.e., the carbon footprint [16]. The formula is:
Table 1.
Sources of greenhouse gas emissions and emission factors.
Table 2.
Economic coefficients, carbon uptake rates, and moisture contents of major crops.
Where, CEF is the carbon footprint of agricultural production (hm2); E is the total carbon emissions from agricultural production (kg); NEP is the carbon sequestration ability of agricultural production per unit of cultivated area (kg/hm2), i.e., the carbon sequestration ability of crops; C is the total carbon absorption of crops (kg); and S is the cultivated area (hm2).
If the difference between the carbon footprint of agricultural production (CEF) and the cultivated area (S) in a region is greater than 0, it indicates a carbon ecological deficit in that region; if the difference between the carbon footprint and the cultivated area is less than 0, it indicates a carbon ecological surplus in that region. The ecological carbon surplus is the difference between the cultivated area and the carbon footprint of the region.
Influence Factor Analysis
Geographic detectors are important analytical tools for exploring spatial heterogeneity and its causes and are widely used in research fields such as resource environment and regional economy. Among them, the factor detection module is mainly used to determine whether each factor is an important cause of the difference in the spatial distribution of the dependent variable and to reveal the influence of each factor on the dependent variable. The interaction detection module in the geographic detector model can analyze the influence of the interaction between each factor on the dependent variable [17]. The main purpose of the interaction effect analysis is to identify the interaction between factors, especially how multiple factors, such as the level of agricultural technology, agricultural population, and economic development, work together to affect the spatial distribution of the carbon footprint when they work simultaneously. Through this analysis, it is possible to clarify which combinations of factors lead to the enhancement or weakening of the spatial distribution pattern of the carbon footprint, thus providing a scientific basis for the precise formulation of regional low-carbon agricultural policies. The specific calculation formula is as follows:
Where q represents the explanatory power of each factor for net carbon emissions in agriculture, and its value range is [0, 1]. A value of q that is closer to 1 indicates that the factor has a greater impact on net carbon emissions in agriculture. n represents the sample size of the study area and represents the sample variance.
Results
Temporal and Spatial Characteristics of Carbon Emissions from Agricultural Production in Jiangsu
Temporal Characteristics of Carbon Emissions
From 2001 to 2020, the total carbon emissions from agricultural production in Jiangsu showed a trend of first increasing and then decreasing (Fig. 2). According to the periodic characteristics of the changing trend, it can be divided into three periods: a rapid growth period (2001-2010), a slowing period (2010-2014), and a rapid reduction period (2015-2020). During the rapid growth period, total agricultural carbon emissions fluctuated and increased due to increased inputs of chemical fertilizers, agricultural films, and diesel, rapidly increasing from 437.08×10⁴ t in 2001 to 469.85×10⁴ t in 2010, an increase of 32.77×10⁴ t, with an average annual growth rate of 0.81%. During the slow-down period, total carbon emissions slowly decreased, from 469.85×10⁴ t in 2010 to 465.20×10⁴ t in 2014, with an average annual decline rate of 0.25%; in the rapid reduction period, the total agricultural carbon emissions decreased rapidly, from 458.66×10⁴ t in 2015 to 417.09×10⁴ t in 2020, with an average annual decline rate of 1.88%.
Fig. 2.
Changes in total and intensity of carbon emissions from agricultural production: Jiangsu, 2001-2020.
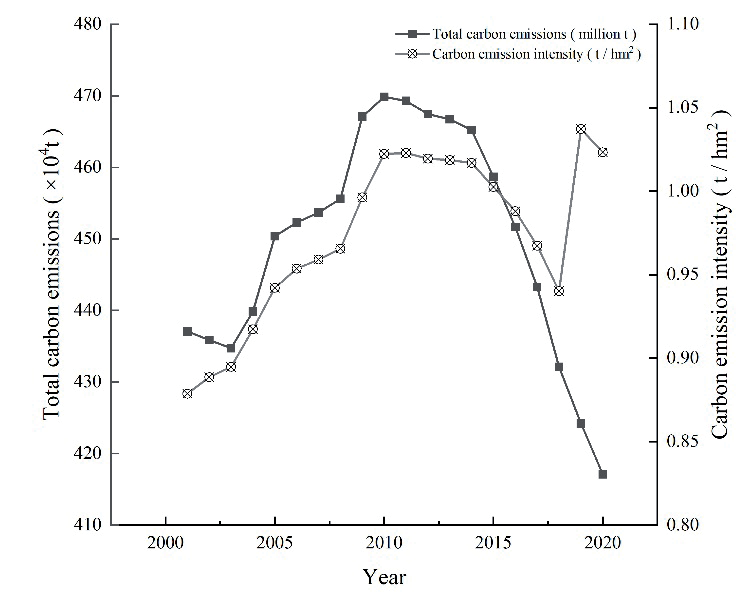
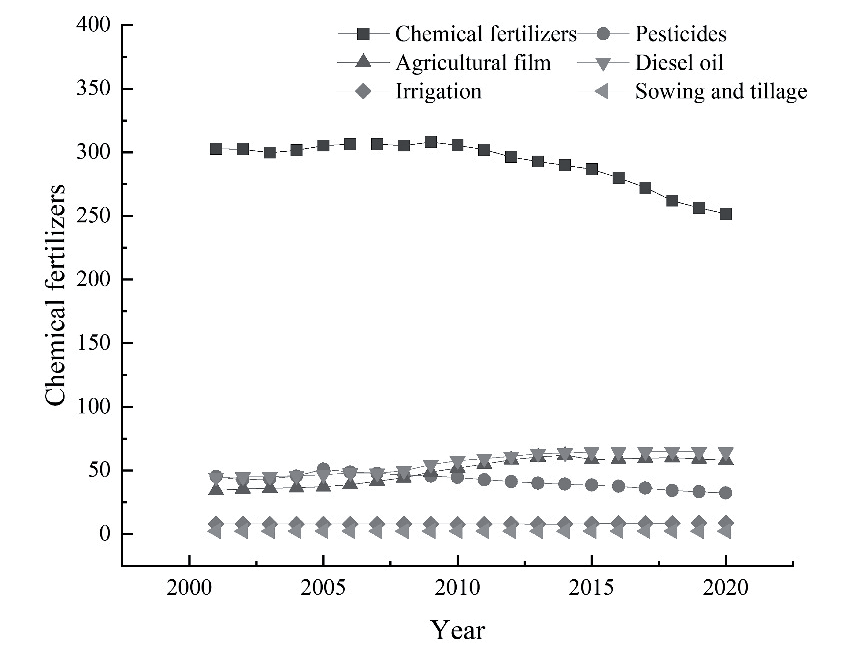
Further analysis of the sources of carbon emissions from various types of agricultural production in Jiangsu found that chemical fertilizers are the largest source of carbon emissions, accounting for 60-70%, but this is declining year by year (Fig. 2). 2010 was a turning point. Prior to this, the carbon emissions from chemical fertilizers increased year by year, but have since decreased year by year, which shows that the promotion of organic fertilizers in recent years has achieved remarkable results. Diesel and agricultural films are also important sources of carbon, accounting for 13% and 11%, respectively. With the promotion of agricultural mechanization, the proportion of diesel and agricultural films has increased year by year. Pesticides account for about 10% of carbon emissions, and their proportion is decreasing with the promotion of green development in agriculture. Agricultural irrigation and plowing account for a relatively small proportion of carbon emissions, about 1.8% and 0.5%, respectively. The study also found that the cultivated area in Jiangsu decreased rapidly between 2001 and 2020, from 497.4×10⁴ hm2 to 407.59×10⁴ hm2, which did not fully match the downward trend in total agricultural carbon emissions. Therefore, it is necessary to study carbon emissions per unit area, i.e., carbon emission intensity. During the study period, carbon emission intensity generally fluctuated and increased, basically in line with the trend of total carbon emissions (Fig. 3). From 2001 to 2010, carbon emission intensity steadily increased from 0.88 t/hm2 in 2001 to 1.02 t/hm2 in 2010. In comparison, the carbon emission intensity of China’s farmland ecosystem was 0.54 t/hm2 and 0.71 t/hm2 in 2001 and 2009, respectively, indicating that the carbon emission intensity of Jiangsu is higher than the national average. From 2010 to 2014, the carbon emission intensity remained stable at 1.02 t/hm2, with a small change of only 0.53%. From 2015 to 2020, the carbon emission intensity continued to decline, from 1.00 t/hm2 in 2015 to 0.94 t/hm2 in 2020, and the policy of reducing pollution from agricultural sources has begun to bear fruit. However, due to the reduction in cultivated land area in 2019 and 2020, carbon emissions per unit of cultivated land area have risen abnormally, resulting in a sharp increase in carbon emission intensity.
Spatial Variation Characteristics of Carbon Emissions
The spatial distribution of carbon emissions from agricultural production in Jiangsu generally shows a pattern of higher emissions in the north and lower emissions in the south (Fig. 4). The province is divided into five levels based on its carbon emissions: <20×104 t, 20~40×104 t, 40~60×104 t, 60~80×104 t, and >80×104 t.
(1) Yancheng, with an average carbon emission of 83.18×10⁴ t, accounts for 18.50% of the province’s carbon emissions; (2) Xuzhou, with carbon emissions between 600,000 and 800,000×104 t, has an average carbon emission of 75.1×10⁴ t, accounting for 16.71% of the province’s total; (3) Suqian, Lianyungang, Huai’an, and Nantong, with carbon emissions between 400,000 and 600,000 ×104 t, including Suqian, Lianyungang, Huai’an, and Nantong, with average carbon emissions of 45.28×10⁴ t, 44.11×10⁴ t, 43.61×10⁴ t and 41.68×10⁴ t, respectively; (4) carbon emissions between 20 and 40×104 t include Taizhou (26. 03×104 t) and Yangzhou (25.21×10⁴ t); (5) cities with carbon emissions less than 20×104 t include Nanjing, Suzhou, Wuxi, Changzhou and Zhenjiang, all of which are located in the southern Jiangsu region. Among them, Zhenjiang has the smallest average carbon emissions, at 10.86×10⁴ t, accounting for only 2.42% of the province’s total.
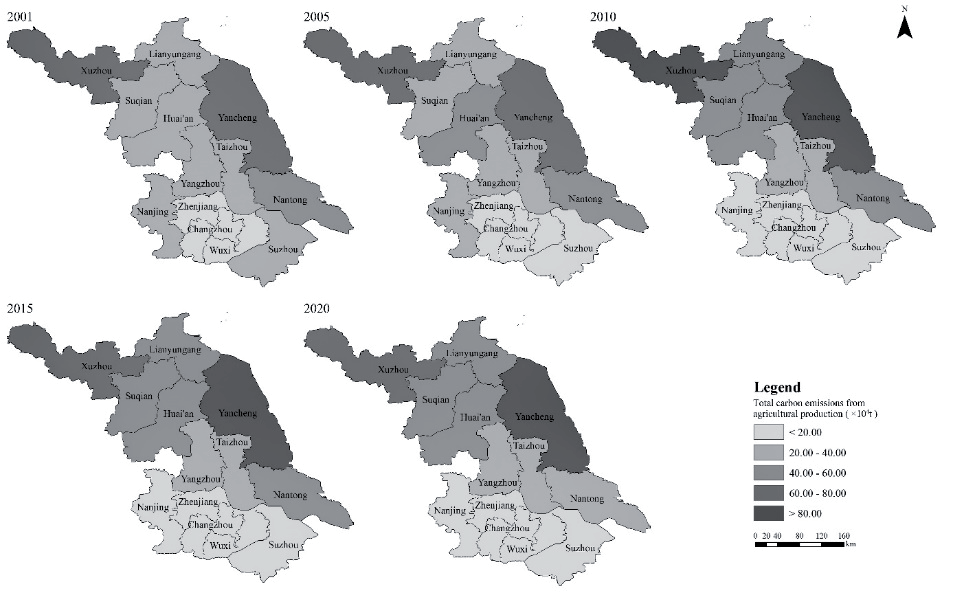
In terms of the dynamically changing urban area units, the city with the largest decrease in carbon emissions was Nanjing (-62.31%), with a reduction of 15.79×10⁴ t. The city with the largest increase in carbon emissions was Yancheng (25.16%), with an increase of 17.09×10⁴ t and an average annual growth rate of 1.19%. In terms of regional characteristics of the dynamics of change, between 2001 and 2020, the high value of carbon emissions from agricultural production in Jiangsu gradually concentrated in northern Jiangsu.
Temporal and Spatial Characteristics of Carbon Absorption in Agricultural Production in Jiangsu
Temporal Characteristics of Carbon Absorption
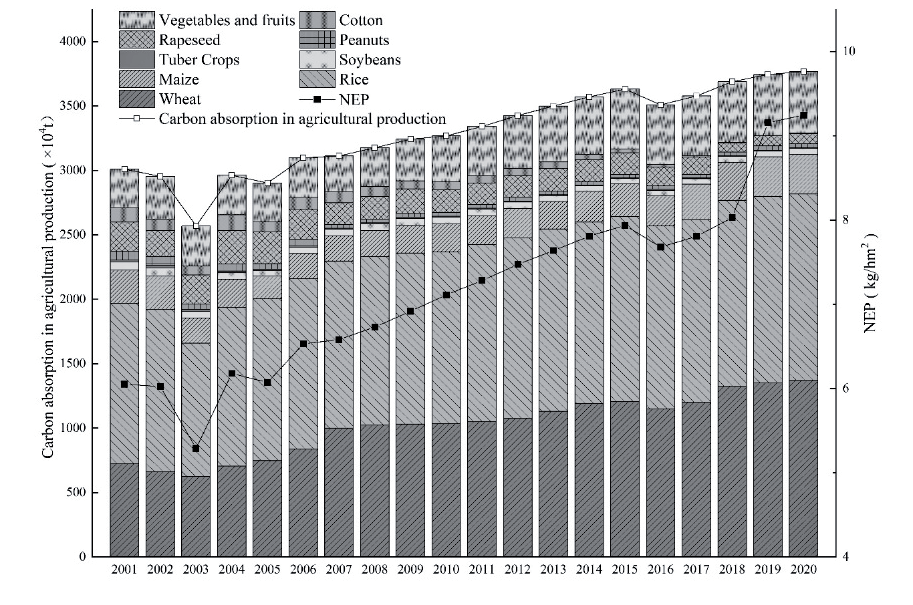
From 2001 to 2020, the carbon absorption of major crops in Jiangsu generally showed an upward trend (Fig. 5). During the study period, the total carbon absorption increased by 758.28×10⁴ t, with an average annual growth rate of 1.19%. According to the periodic characteristics of its development trend, it can be divided into the following two stages: (1) From 2001 to 2005, carbon absorption fluctuated and increased, but the amount of carbon absorbed in 2003 (2569.75×104 t) reached a low. After 2003, crop yields and production increased, so the amount of carbon absorbed showed a recovery. (2) From 2006 to 2020, the amount of carbon absorbed increased year by year. As crop yields continued to rise, the amount of carbon absorbed by crops also continued to increase. However, there were some minor fluctuations in 2016 and 2017, with a slow decrease in carbon absorption. In 2016, it decreased by 121.32×10⁴ t compared with 2015.
During the study period, the area of crops sown and cultivated land decreased, but carbon uptake did not weaken, which shows that carbon uptake per unit area has increased from 6.05 t/hm2 to 9.24 t/hm2, with an average annual growth rate of 2.25%. This shows that in recent years, despite a decrease in the area of crops sown in Jiangsu, carbon uptake per unit area of cultivated land has also been able to steadily increase. Over the past 20 years, carbon absorption has fluctuated and increased, with a peak of 9.24 t/hm2 in 2020 and a trough of 5.29 t/hm2 in 2003, and a range of 3.95 t/hm2, indicating that the overall carbon sequestration ability of Jiangsu’s farmland is constantly increasing and that there is huge potential for a green transformation of agriculture.
Different crops have different carbon sequestration abilities for agricultural production. Rice and wheat are the main sources of carbon absorption in agricultural production in Jiangsu, with an average annual carbon absorption of 1340.66×104 t and 1022.26×104 t, respectively, accounting for about 40% and 30% of the province’s total carbon absorption by crops. Vegetables and melons, corn and rapeseed accounted for 11%, 7% and 5% of the total carbon absorption, respectively; cotton, soybeans and peanuts accounted for about 1% of the total carbon absorption; and tubers only accounted for 0.29% of the total carbon absorption, indicating that crops such as cotton, soybeans, peanuts and tubers have little impact on the province’s total carbon absorption. The carbon absorption of crops other than rice, wheat and vegetables has been decreasing, mainly due to the restructuring of Jiangsu’s crop planting, with an increase in the sowing area and yield of rice, wheat and vegetables, and a decrease in the sowing area and yield of other crops due to a significant decrease in the sowing area.
Characteristics of Carbon Absorption Space Changes
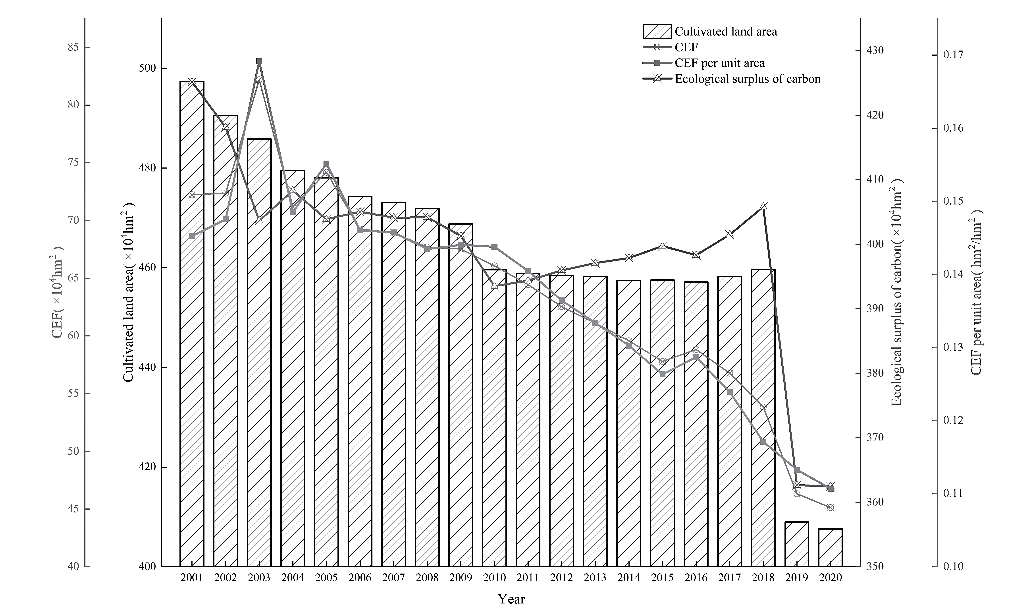
The total carbon absorption of agricultural production in Jiangsu shows an overall spatial feature of being higher in the north and lower in the south (Fig. 6). It is divided into five levels according to its carbon absorption: <100×104 t, 100~200×104 t, 200~400×104 t, 400~600×104 t, and >600×104 t. (1) Yancheng has the largest carbon sequestration ability, with an annual average carbon absorption of 628.20×10⁴ t, accounting for 17.81% of the total carbon absorption. It has the largest carbon sequestration ability due to its large sown area and high crop yields. (2) Xuzhou is second, with an average carbon absorption of 474.47×10⁴ t, accounting for 13.45%; (3) Wuxi has the smallest carbon absorption, with an average carbon absorption of 72.68×10⁴ t, accounting for 2.06%, only 1/10 of Yancheng’s carbon absorption. This area has a developed social economy and high ecological protection pressure, and the sown area of crops is relatively small, which may have led to a relatively small carbon absorption. It can be seen that the total carbon absorption of agricultural production is closely related to the level of crop production.
There are also significant regional differences in the trend of carbon absorption. The carbon absorption in the southern Jiangsu region has shown a decreasing trend year by year, which is consistent with the trend of carbon emissions. The reduction in the cultivated land area and crop sowing area in the southern Jiangsu region has led to a decrease in the amount of carbon fixed in farmland. The carbon absorption in the northern and central Jiangsu regions has increased year by year. For example, Yancheng has the largest increase in carbon absorption. In 2001, Yancheng’s carbon absorption was 495.40×10⁴ t, and in 2020, it was 730.55×10⁴ t, an increase of 47.47%, with an average annual growth rate of 2.06%.
Given the large differences in cultivated land area among cities, it is worth continuing to discuss whether the carbon sequestration ability of a city is related to cultivated land area. Therefore, we continue to compare the carbon sequestration ability (NEP) of each city per unit area of each city. The city with the highest carbon absorption per unit area is Taizhou, with 9023.16 kg/hm2, followed by Yangzhou with 8165.05 kg/hm2, indicating that the farmland in Taizhou and Yangzhou has a strong carbon sequestration ability. The city with the lowest carbon absorption per unit area is Nanjing, with only 5380.34 kg/hm2, indicating that the farmland in this city has a weak carbon sequestration ability. It can be seen that carbon sequestration ability is related to cultivated land area on the one hand, and the quality of cultivated land and other factors also affect carbon sequestration ability.
Temporal and Spatial Characteristics of the Carbon Footprint of Agricultural Production in Jiangsu
Temporal Characteristics of the Carbon Footprint
Over the past 20 years, the average annual carbon footprint of agricultural production in Jiangsu has been 63.90×10⁴ hm2, showing a fluctuating downward trend (Fig. 7). From 2001 to 2020, the carbon footprint decreased from 72.23×10⁴ hm2 to 45.12×10⁴ hm2, a decrease of 27.11×10⁴ hm2, or 37.53%. The development trend can be divided into the following two stages:
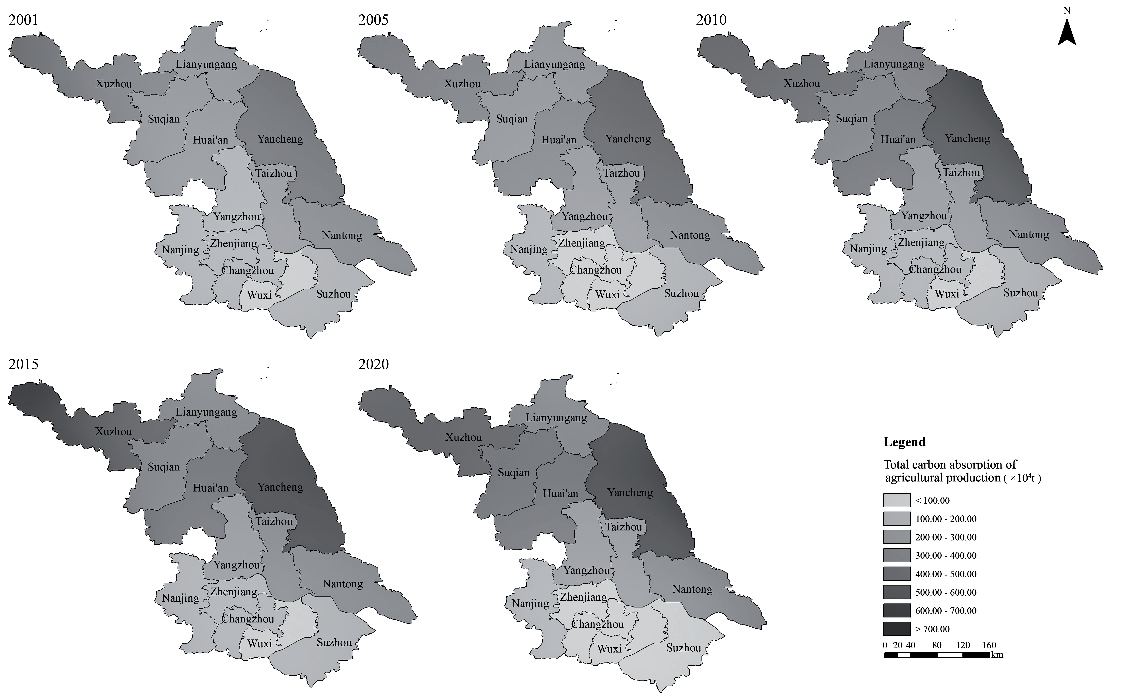
(1) 2001-2005 was a fluctuation stage. (2) 2006-2020 is a continuous reduction stage.
The proportion of the carbon footprint of agricultural production to the cultivated area during the same period showed a downward trend, decreasing from 14.52% in 2001 to 11.07% in 2020. In other words, the carbon emissions from agricultural production require about 1/10 of the cultivated area to absorb. During the study period, the carbon footprint of agricultural production was always less than the cultivated area during the same period, indicating that agricultural production was in a state of carbon ecological surplus and, therefore, still had the capacity to supplement the carbon ecological deficit of industry and life. The carbon footprint per unit area decreased year by year, from 0.14 hm2/hm2 in 2001 to 0.11 hm2/hm2 in 2020, indicating that the carbon-sink capacity of agricultural production has been strengthened.
Spatial Variation Characteristics of Carbon Footprint
The spatial distribution pattern of the carbon footprint of agricultural production in Jiangsu is high in the north and low in the south (Fig. 8). It is divided into five levels according to its carbon emissions: <2×10⁴ hm2, 2~4×10⁴ hm2, 4~6×10⁴ hm2, 6~8×10⁴ hm2, and >8×10⁴ hm2.
(1) There are significant differences in the carbon footprint of each city. The city with the largest carbon footprint is Yancheng, which is 10.78×10⁴ hm2, accounting for 17.81% of the province’s total carbon footprint, followed by Xuzhou, with 9.89×10⁴ hm2, accounting for 16.34%; (2) cities with a carbon footprint between 4 and 6×10⁴ hm2 include Suqian, Nantong, Huai’an, and Lianyungang, accounting for 9.74%, 9.15%, 9.12%, and 9.06% respectively; (3) cities with a carbon footprint between 2–4×10⁴ hm2, including Yangzhou (5.00%), Taizhou (4.83%), Nanjing (4.72%), Suzhou (4.47%) and Wuxi (3.70%); (4) the cities with the smallest carbon footprints are Zhenjiang and Changzhou, with only 1.72 and 1.94×10⁴ hm2, accounting for 2.84% and 3.21% respectively.
There are also significant regional differences in the trend of carbon absorption, and the high carbon footprint is gradually concentrated in the northern Jiangsu. The carbon footprint in the southern part of Jiangsu shows a decreasing trend year by year, and the carbon ecological surplus shows a significant increasing trend. Both carbon emissions and carbon absorption in southern Jiangsu show a downward trend, and it is clear that the rate of decline in carbon emissions is greater than the rate of decline in carbon absorption. The carbon footprint in northern Jiangsu also shows a decreasing trend, but it is still much higher than that in southern Jiangsu.
Analysis of Influencing Factors
Select Influencing Factors
This study selected the following indicators for statistical analysis of the data: the population of Agricultural (X1), the level of agricultural economy (X2), the level of agricultural technology (X3), the structure of the agricultural industry (X4), and the efficiency of agricultural production (X5). The level of agricultural technology is measured by the total power of agricultural machinery; the structure of the agricultural industry is measured by the ratio of agricultural output value to the total output value of agriculture, forestry, animal husbandry, and fishery; the level of agricultural economy is measured by the ratio of total agricultural output value to the population engaged in agriculture; and the efficiency of agricultural production is measured by the ratio of carbon footprint to agricultural output value.
The population engaged in agriculture and the level of agricultural technology have a significant impact on the spatial distribution of the carbon footprint of agricultural production in Jiangsu, and both have passed the significance test (Table 3). Among them, the explanatory power of agricultural technology level is the highest, and it is the dominant factor in the spatial variation of agricultural production carbon footprint in Jiangsu. There is a significant positive correlation between agricultural technology level and agricultural production carbon footprint. With the increase of the total power of agricultural machinery, the increase of energy consumption will inevitably lead to an increase in the level of carbon emissions. The agricultural industrial structure has a suppressive effect on the carbon footprint of agricultural production. The greater the proportion of agricultural output value, the higher the crop yield, and the greater the carbon absorption of crops, thereby reducing the carbon footprint.
Fig. 8.
Spatial variation of the carbon emission footprint of agricultural production: Jiangsu, 2001-2020.
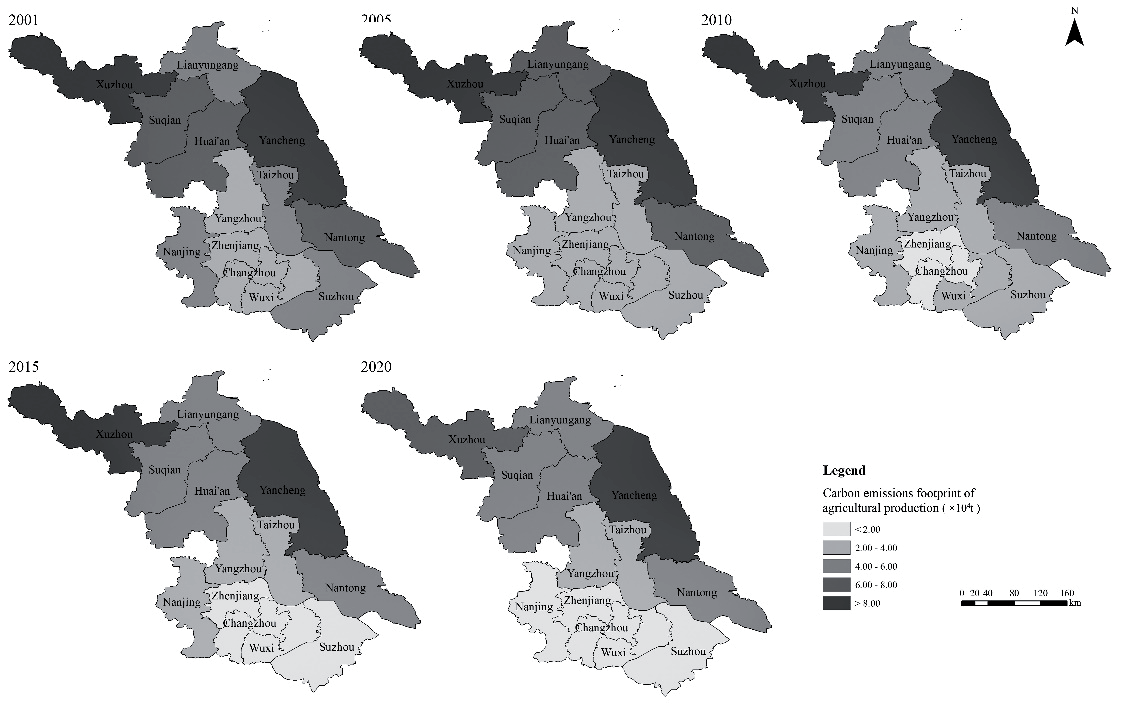
Table 3.
The explanatory power of each factor on the carbon footprint of agricultural production in Jiangsu from 2001 to 2020.
The explanatory power of the level of agricultural technology on spatial distribution differences is gradually decreasing, indicating that the level of agricultural technology in cities in Jiangsu is continuously improving, the impact of agricultural mechanization on the carbon footprint of agricultural production in each city is weakening, and the difference in resource utilization efficiency is gradually decreasing. The explanatory power of the agricultural workforce on spatial distribution differences is gradually increasing, indicating that the impact of the agricultural workforce on the carbon footprint of each city is increasing. The increase in the workforce has brought in professionals, and the modernization of agriculture developed under these conditions has, to some extent, suppressed the growth of the carbon footprint.
Geo-Detector Results
The Geo-Detector was used to identify interactions between factors and evaluate their combined effect to see if the joint effect of any pair of factors increased or decreased the explanatory power of the spatial differentiation pattern of the carbon footprint.
As can be seen from Table 4, the interaction terms between the factors are mostly more explanatory than the individual factors, indicating that the interaction between each pair of factors has a greater impact on the spatial pattern of the carbon footprint of agricultural production in Jiangsu than a single factor. Among them, the interaction term between the level of agricultural technology (X3) and the other four factors is relatively large, indicating that this factor has a strong control over the spatial distribution pattern of the carbon footprint of agricultural production in Jiangsu. Overall, the spatial distribution of the carbon footprint of agricultural production in Jiangsu is the result of the combined effects of various influencing factors.
Discussion
Regional Characteristics and Driving Factors of Agricultural Carbon Footprint in Jiangsu
This study reveals significant differences in the carbon footprint of different regions in Jiangsu through data analysis of the agricultural carbon footprint from 2001 to 2020.
The southern region of Jiangsu has a lower carbon emission profile due to its advanced economy and strong technological innovation capabilities, which have promoted the efficient and low-carbon development of agricultural production. The region has a diversified agricultural production structure with a large proportion of tertiary industry, which reduces the dependence of carbon emissions on a single agricultural production. The widespread adoption of low-carbon agricultural technologies, such as precision fertilization, efficient irrigation systems, and the use of biodegradable films and biological pesticides, has further supported the reduction in carbon emissions. These technologies not only improve resource efficiency but also align with national carbon reduction goals. Studies have shown that psychological and social factors, such as the farmers’ attitudes towards low-carbon production and their perceptions of its effectiveness, have played a key role in the adoption of these technologies [18]. Meanwhile, government support, social capital, and the awareness of local communities also significantly influence technology adoption, with stronger social networks and trust among farmers facilitating higher adoption rates [19]. Furthermore, farmers’ risk perceptions, particularly regarding market volatility and climate-related risks, have driven them to adopt low-carbon technologies that mitigate such risks. This reflects a broader trend where farmers’ aversion to losses motivates them to seek more resilient and low-carbon farming practices [20]. These changes have also affected the planting structure of regional crops and promoted the transformation and upgrading of agriculture. Therefore, the southern Jiangsu region should continue to promote green agricultural technology, further accelerate the adoption of low-carbon agricultural practices by enhancing farmer education and training, and optimize the planting structure. By developing emerging industries such as agro-cultural tourism and agro-processing, the value-added of agriculture can be increased, and the dependence on traditional agriculture can be reduced.
Table 4.
Results of the interaction effects of the influencing factors of the carbon footprint of agricultural production in Jiangsu from 2001 to 2020.
The relatively single-crop structure in northern Jiangsu increases the demand for chemical fertilizers and pesticides, resulting in high carbon emissions. In addition, the region lacks advanced agricultural technology and effective environmental management measures, resulting in the persistence of a high-input, high-emission production model [21]. The relative scarcity of irrigation water resources also increases the pressure of agricultural production on the environment, exacerbating the problem of carbon emissions [22]. To this end, northern Jiangsu should vigorously introduce advanced agricultural technologies, promote low-carbon agricultural technologies and equipment, strengthen environmental management measures, and promote the use of new organic fertilizers and biological pesticides. At the same time, the government should strengthen its policy support for the northern Jiangsu, improve the technical level of farmers through training and technical guidance, and improve the efficiency of resource use [23].
At the provincial level, the carbon sequestration ability of the ecosystem can be enhanced by further reducing carbon emissions from agriculture, improving the sustainability of agriculture, and promoting the construction of agricultural carbon-sink projects, such as afforestation and wetland restoration [20, 24]. Developing regional agricultural development plans that take into account local conditions can promote differentiated development by combining the natural conditions and resource endowments of each region. At the same time, promoting agricultural insurance can provide economic security for farmers and enhance their ability to withstand climate change and market fluctuations [25]. Finally, policy guidance should be strengthened, more detailed policy measures should be introduced, agricultural enterprises and farmers should be encouraged to adopt green technologies, and a reward and punishment mechanism should be implemented to increase enthusiasm for green agriculture [26]. Through these measures, Jiangsu can reduce agricultural carbon emissions while further promoting the sustainable development of agriculture, thus achieving a win-win situation for the economy and the environment.
The Relationship between Carbon Emissions and the Development of Agricultural Technology
The development of agricultural technology plays a dual role in the changes of carbon emissions in Jiangsu. On the one hand, agricultural mechanization and technological innovation have inevitably increased energy consumption and carbon emissions while improving production efficiency. With the popularization of agricultural machinery and the application of efficient production tools, the use of fossil energy in agricultural production processes has increased significantly, leading to an increase in greenhouse gas emissions [8]. On the other hand, advances in agricultural technology can effectively mitigate the negative impact of carbon emissions by introducing energy-saving technologies and renewable energy. For example, promoting low-carbon agricultural machinery, solar irrigation systems, and wind power generation can reduce carbon emissions while reducing dependence on traditional energy sources [27]. These innovative technologies not only optimize production efficiency but also provide important support for achieving low-carbon agriculture. In addition, in terms of green agricultural production technology, precision fertilization technology can rationally allocate the use of chemical fertilizers according to the nutrient needs of the soil, significantly reducing the overuse of chemical fertilizers and the resulting nitrogen oxide emissions. Drip irrigation technology, on the other hand, reduces the pressure on water resources for agricultural production and related carbon emissions by conserving water resources and improving water use efficiency. In the future, further promotion of these technologies can promote efficient and environmentally friendly production.
Emission Reduction Measures and Management Measures
In the context of development, where it is necessary to maintain economic growth while also focusing on the coordinated development of ecological economies such as carbon emissions and carbon absorption, agricultural production should break through the traditional production model, break away from the development model that comes at the cost of high resource consumption and environmental burden, and shift towards green agricultural development and a circular economy model.
The production, transportation, and use of chemical fertilizers generate significant carbon emissions and are the primary source of carbon emissions in agricultural production. Therefore, it is critical to adopt more rational and sustainable fertilizer use practices. Promoting soil testing and fertilizer formulation technology can accurately meet the nutrient needs of crops, thereby reducing the overuse of chemical fertilizers and improving their use efficiency [28]. In addition, increasing the use of organic fertilizers not only helps to reduce the amount of chemical fertilizers used but also improves the soil structure and enhances the carbon sink capacity of the soil. For the use of agricultural films, reasonable control of the amount used and improved recycling can reduce their impact on carbon emissions and environmental pollution [29]. The government should help farmers master scientific fertilization and agricultural film use techniques through technical training and promotion activities to further promote the green development of agriculture [30].
Optimizing crop structure is a key strategy for increasing the carbon sequestration capacity of agriculture. By promoting high-yielding and resilient crops and adapting crop structure to natural conditions, it is possible to reduce the area planted to energy-intensive crops and increase the area planted to crops with high carbon sequestration potential. Studies have shown that optimizing fertilizer use and crop distribution can significantly reduce the demand for arable land, reduce greenhouse gas emissions, and provide more space for carbon sequestration in restored natural vegetation [24, 31, 32]. This adjustment will not only improve the carbon-sink capacity of agricultural production but also increase the ecological carbon surplus, thus providing stronger support for combating climate change.
The Chinese Government’s Central Document No. 1 (February 23, 2025) First Proposed developing “new agricultural productivity” with a focus on green and low-carbon transformation through technological innovation and smart agriculture. In addition, Jiangsu’s Implementation Opinions on Comprehensively Promoting the Construction of Beautiful Jiangsu and Rural Revitalization Plan (2024-2027) both mention supporting digital agriculture, optimizing production structure, and low-carbon practices. At the same time, Jiangsu has made some progress in reducing agricultural carbon emissions through government-led green development strategies and policy incentives, including fiscal subsidies and tax incentives for low-carbon technologies. Our findings are consistent with these policy directions, and such interventions should be expanded in the future to accelerate the transition to low-carbon agriculture in Jiangsu and other regions.
Conclusions
This study is based on Jiangsu agricultural data from 2001 to 2020. It calculates the carbon footprint of agricultural production, analyzes its spatiotemporal evolution, and identifies key influencing factors. The main results are as follows:
(1) From 2001 to 2020, Jiangsu’s agricultural carbon emissions show a “first increase, then decrease” trend, with a spatial pattern of “higher in the north, lower in the south”. Fertilizer use is the largest source of carbon emissions, while the carbon uptake of crops, especially rice and wheat, has generally increased, contributing to a growing carbon sink capacity.
(2) Agricultural population and technological development are the main factors influencing the spatial distribution of carbon footprints. Technological progress, especially in agriculture, has the greatest impact on carbon footprint variations.
(3) To promote low-carbon agricultural development in Jiangsu, efforts should focus on both reducing carbon emissions from agricultural inputs and improving carbon sequestration by adjusting crop structure. The adoption of low-carbon technologies, such as precision fertilization and efficient irrigation, is crucial. Government policies should prioritize financial support, farmer education, and the promotion of networks to accelerate technology adoption.
In this study, some parameters of the relevant domestic emission factors were missing, so some foreign parameters were used to calculate carbon emissions. This may have the problem of regional adaptability, which needs to further improve the reliability of measurement results through field surveys in future studies. Future studies should also pay attention to the regional differences in carbon footprints at the county level to improve the accuracy of the data sources studied in this article, as well as explore the socio-economic factors affecting the adoption of technology in various aspects to provide more targeted, localized policy recommendations.

