

Introduction
Since the reform and opening up of China, its cities have undergone massive expansion [1, 2] and its urban population has been estimated to account for >70% of the national population by 2035 [3]. The most typical feature of urbanization is the change in the urban surface [4]. Natural land covers are converted into artificial impermeable surface areas (ISA) using components such as reinforced concrete [5], causing an increase in land surface temperature (LST) and imbalance in urban thermal environments [6]. This imbalance negatively impacts air quality, regional climate, human settlements, and urban ecology [7-9]. Therefore, studying the spatiotemporal evolution patterns of urban ISA and their effects on the thermal environment is crucial to improve the quality of the urban ecological environment and promote sustainable city development [10].
The rapid growth of ISA is a leading cause of the increase in LST [11]. Research on effective information extraction on ISAs has been important for understanding and monitoring changes caused by urbanization in the thermal environment [12]. At present, many domestic and international scholars have focused on the efficient extraction of ISA [6, 13-15]. Ridd [16] proposed the classic vegetation-impervious surface-soil model which regards the urban land surface area as a composition of these three land covers. Wu et al. [17] introduced a fixed endmember model to Ridd’s model in the study of Landsat Enhanced Thematic Mapper+ remote sensing images. Xu [18] proposed the Normalized Difference Impervious Surface Index, which can quickly extract ISAs in a large area and improve their efficiency and accuracy. Deng et al. [19] proposed the biophysical composition index (BCI), which can effectively suppress vegetation information and increase the extraction accuracy of ISA. In addition, the application of thermal infrared remote sensing in LST helps elucidate the spatio-temporal distribution characteristics of the thermal environment under urban expansion [20]. At present, a variety of LST retrieval algorithms have been proposed, including the radiation transfer equation, and single-channel, multi-channel, window, and multi-angle algorithms [21]. In particular, the radiative transfer equation is widely used in different algorithms owing to its ease of application to any type of infrared band.
In the study of the urban thermal environment, studies have elaborated on the relationship between LST and urban sprawl, particularly changes in land use type [22]. These studies have found that urban thermal effects are strongly influenced by changes in land use type. ISA is often cited as the most significant factor affecting LST [11], making it even more important to quantify its relationship with LST. However, previous studies have mostly used regression analysis to elaborate the relationship between ISA and LST, and relatively few studies have been conducted to quantify the warming effects of different ISA values. For example, Morabito et al. [23] performed a method of regression analysis based on the building land maps with a resolution of 5 m and MODIS data from four cities in Italy, and the results showed that the proportion of building land and LST had a positively linear relationship. Xu et al. [24] analyzed the ISA and LST of Xiamen City using remote sensing images, revealing that ISA and LST showed an exponential function relationship.
Hefei, the capital city of Anhui Province, is located in the center of Anhui Province [25]. In recent years, accelerated urbanization has led to an increase in its number of ISAs. This high-intensity urban development has led to a series of ecological and environmental problems [26], the most significant of which is a dramatic change in the urban surface thermal environment. Limited studies have been conducted on the evolution of the spatial and temporal patterns of impermeable surfaces in Hefei and their thermal environmental effects [25]. Therefore, in this study, the built-up areas of Hefei were selected as the research area to study the spatio-temporal changes and correlation in ISA and LST from 2002 to 2017. The specific objectives were to:
(1) investigate the spatio-temporal variation characteristics of ISAs and LST, (2) discuss the correlation between LST and ISA, and (3) determine the specific warming effect of different impermeable values. The research results could guide urban construction planning and sustainable development in Hefei. Further, the case in Heifei City could serve as an example for other cities to quantitatively estimate the temperature rise for different ISA values.
Experimental
Study Area
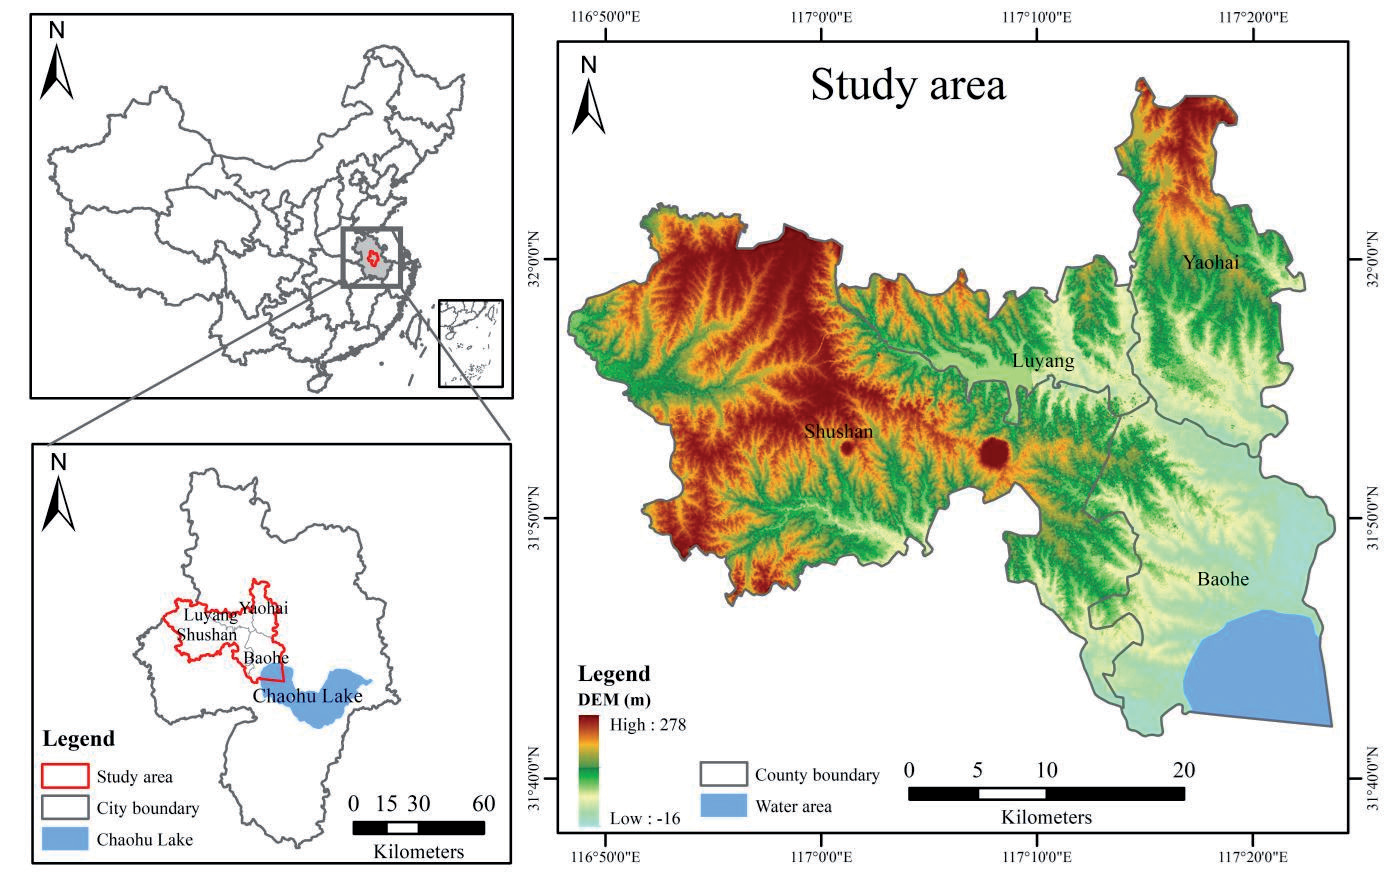
Hefei City is located in the central part of Anhui Province (30° 57′–32° 32′ N, 116° 41′–117° 58′ E) [27]. It has a total area of 11445.1 km2, of which the main urban area is 528.5 km2. Hefei is located in the subtropical humid monsoon region, with an average annual temperature and rainfall of 15.7ºC and 900-1100 mm, respectively [28]. The soil in Hefei has a generally neutral or moderately acidic pH, suitable for the growth of various plants, with the vegetation mainly comprising deciduous broad-leaved trees [29]. In 2021, Hefei’s GDP reached 1141.28 billion CNY, increasing by 9.2% from the previous year, and the GDP per capita reached 46009 CNY. In 2021, the resident population reached 937 million [30]. To accurately study the change in LST, we selected the built-up areas of Hefei, namely Shushan, Luyang, Baohe, and Yaohai (Fig. 1).
Data Source
The data used in this study were obtained from the United States Geological Survey (https://earthexplorer. usgs.gov/). Based on the urban development stage and data availability in Hefei, data from August 4, 2002 to August 12, 2005 (Landsat-5 TM) and September 19, 2013 to September 14, 2017 (Landsat-8 OLI) were selected. Remote sensing images were the basis of this study; high-quality images with cloudiness <2% and spatial resolution of 30 m were used. To avoid seasonal changes, the time was relatively uniform (Table 1). Using ENVI5.3, the data were pre-processed with radiometric calibration, flash atmospheric correction, image cropping [31].
ISA Extraction
ISA Extraction and Validation
The ISA was extracted using the BCI. First, the water bodies were masked with other land cover types using the modified normalized water index (MNDWI). Second, the BCI was calculated according to Equations (2)–(5) to extract the ISA [32]; the trough in the histogram was selected as the threshold for image segmentation. The water-land separation thresholds were set at 0.0079, 0.0236, 0.0088, and 0.0536 for the four years, with extraction ISA thresholds of 0.4000, 0.5360, 0.4987, and 0.3686, respectively. The calculation equations are as follows [33]:
where Green and MIR represent the reflectance of the green and mid-infrared wavelengths, respectively, H represents high albedo, L represents low albedo, and V represents vegetation, as obtained using the following formulae:
where TCi (i = 1,2,3) is the first three TC components obtained after the tasseled cap transformation. TCi min and TCi max represent the minimum and maximum values of the TC component, respectively.
The accuracy of the extracted ISA was verified using a confusion matrix for Google images [17]. The accuracy of ISA extraction for each period was verified to be >90%, and the kappa coefficient exceeded 0.8, indicating that the results were of acceptable quality.
ISA Change Index
Based on the BCI index used to extract ISA data, two indicators of urban expansion speed and intensity were selected to analyze the dynamic ISA changes in the study area [34]. The urban ISA expansion speed and intensity indices were calculated as follows [35]:
Table 1.
Details of Landsat images used for the study.
| Sensor | Spatial resolution (m) | Path/Raw | Acquisition time | Cloud coverage (%) |
|---|---|---|---|---|
| Landsant5 (TM) | 30 | 121/038 | 2002-08-04 | 0.31 |
| Landsant5 (TM) | 30 | 121/038 | 2005-08-12 | 0.18 |
| Landsant8 (OLI) | 30 | 121/038 | 2013-09-19 | 1.06 |
where v is the rate of ISA expansion, R is the ISA intensity, T is the interval time, and Ua and Ub represent the ISA at the beginning and end of the study area, respectively.
To more intuitively understand the difference in ISA expansion, this study divided the annual average expansion speed into four types [35]: slow expansion (0-5 km2/year), medium expansion (5-8 km2/year), rapid expansion (8-17 km2/year), and high expansion (>17 km2/year).
LST Retrieval
LST Inversion and Accuracy Verification
The LST was retrieved using the radioactive transfer equation. The mathematical expression of the radiative transfer equation method is as follows [36]:
where Lλ represents the thermal infrared radiation, B(TS) represents the blackbody radiation, TS represents the real surface temperature (K), ε represents the land surface emissivity, τ represents the atmospheric transmittance, and Lu and Ld refer to the upward and downward radiance of the atmosphere, respectively.
TS was calculated by the following formula:
where K1 and K2 are the calibration coefficients of the satellite before the launch. For Landsat-5 TM, K1 and K2 were 607.76 W/(m2∙sr∙μm) and 1260.56 K, respectively. For Landsat-8 OLI, K1 and K2 were 774.89 W/(m2∙sr∙μm) and 1321.08 K, respectively.
In this study, a cross-comparison method was used to verify the accuracy of inverse LST. MOD11A1 data (http://ladsweb.modas.eosdis.nasa.gov/) were used as the reference source [20]. After removing the outliers from the inverse LST results, 200 sample points were randomly selected within the study area, outside the null area, to establish a correlation analysis with the obtained MOD11A1 data statistics (P<0.05). The goodness-of-fit R2 for each year was >0.8, thereby meeting the accuracy requirement.
LST Classification
Considering that the four remote sensing images differ in terms of imaging date, weather conditions, and atmospheric parameters, we normalized the LST inversion results [37] using the following calculation formula:
where NTS is the normalized LST, and the value range is [0, 1], TS is the actual LST (ºC), and Tmax and Tmin are the highest and lowest values in the study area, respectively.
Furthermore, to study the distribution characteristics of LST in Hefei from 2002 to 2017, the normalized LST was classified using the mean-standard deviation method (Table 2). The calculation formula is as follows:
where T1 is the grading threshold of the normalized LST,
Correlation between ISA and LST
Based on SPSS software, the Pearson correlation coefficient of statistics characterized the close degree of the relationship between the variables. A total of 250 sample points were randomly and uniformly obtained in the corresponding area of the two images in the same year, and the BCI and LST values of each sample were counted. The BCI values of the ISA and LST were quantitatively analyzed using multiple model regression. The BCI values (0-1) of the ISA in each period were graded at intervals of 0.1. Additionally, the BCI values of the ISA corresponding to LST were calculated to explore the correlation between ISA and LST [24].
Table 2.
Standard for grade classification of normalized LST.
Results
Dynamic Analysis of ISA Change
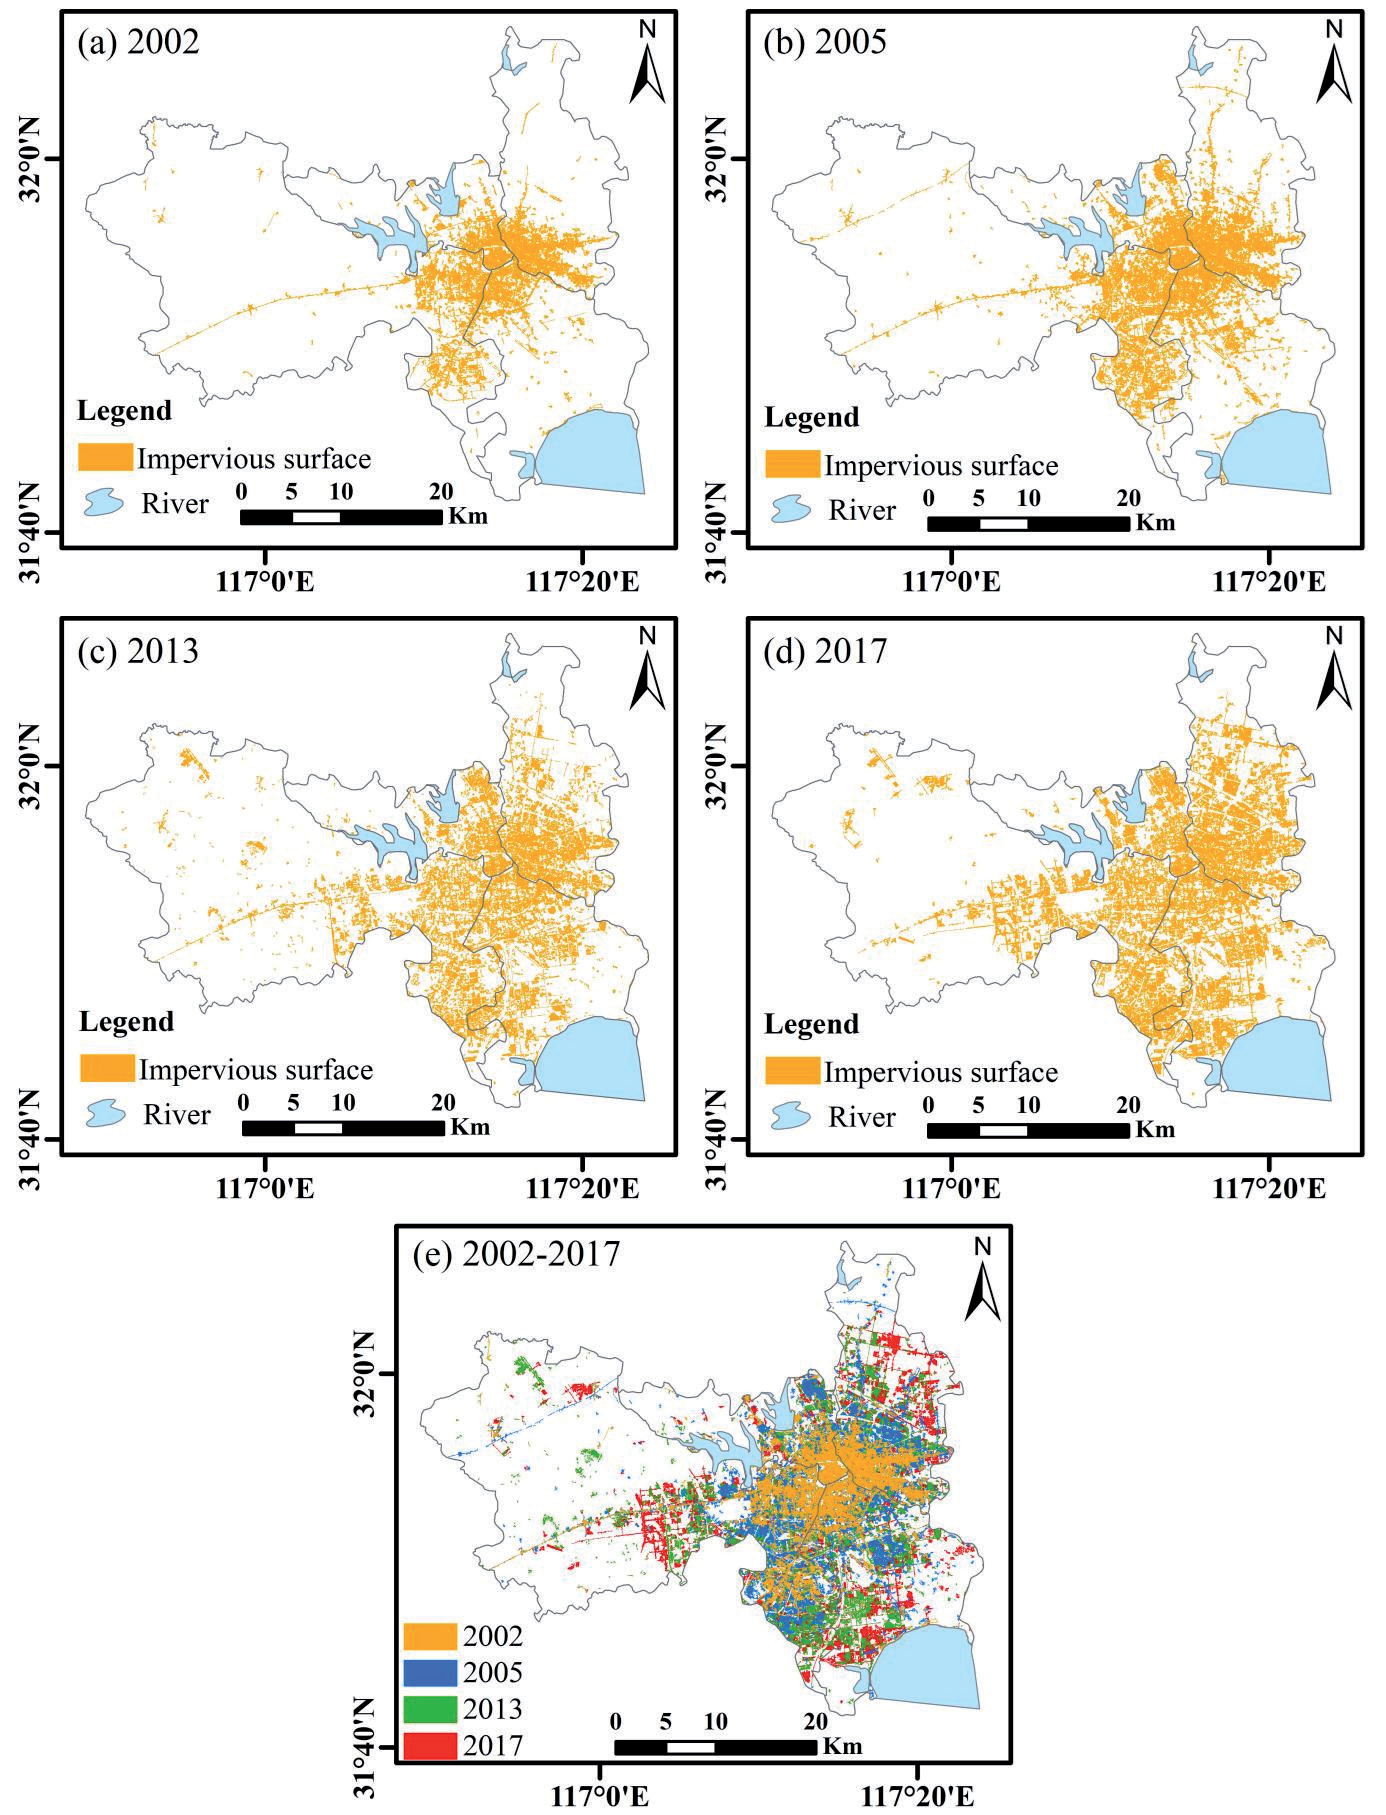
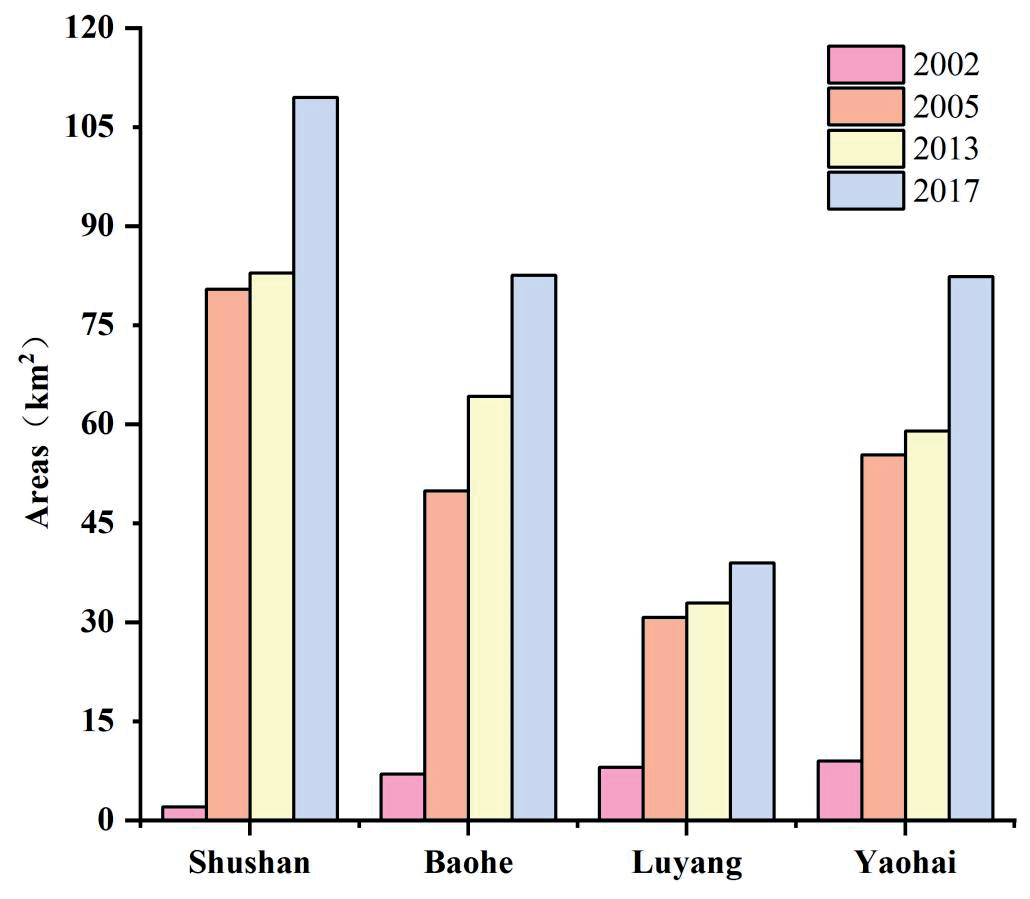
As evident from Fig. 2, ISAs in the built-up area of Hefei increased and expanded from 132.05 km2 in 2002 to 313.37 km2 in 2017. This shows an expansion trend from the center to the periphery. From 2002 to 2005, the ISA in all districts except Luyang, which is located in the old city, increased by >20 km2, with Shushan District having the largest ISA expansion (33.21 km2). From 2005 to 2013, Baohe District had the largest ISA expansion (14.34 km2), and that of the rest of the area was relatively stable (<4 km2). From 2013 to 2017, the ISA expansion of Yaohai District was the largest (23.27 km2). In general, from 2002 to 2017, Shushan District had the largest ISA expansion (62.28 km2), whereas Luyang District had the smallest ISA expansion (17.1 km2; Fig. 3).
From 2002 to 2005, the expansion speed of Shushan District was the fastest, with an average of 11.07 km2/year, and the expansion intensity was 23.45%, indicating rapid expansion. From 2005 to 2013, the ISA in Baohe District expanded the fastest, averaging to 1.79 km2/year, with an expansion intensity of 3.59%, indicating slow expansion. From 2013 to 2017, Yaohai District had the highest expansion intensity (9.91%) with an average annual expansion rate of 5.84 km2, which indicated a medium expansion. Overall, from 2002 to 2017, Baohe District had the greatest expansion intensity, followed by Yaohai, Shushan, and Luyang. Thus, Hefei’s built-up areas expanded rapidly. Owing to the development of municipal districts in recent years, the base of the ISA was relatively stable, the level of urban expansion was in a relatively saturated state, and the speed and intensity of urban expansion were relatively slow (Table 3).
Dynamic Analysis of LST Change
Analysis of Spatio-Temporal Variation in LST
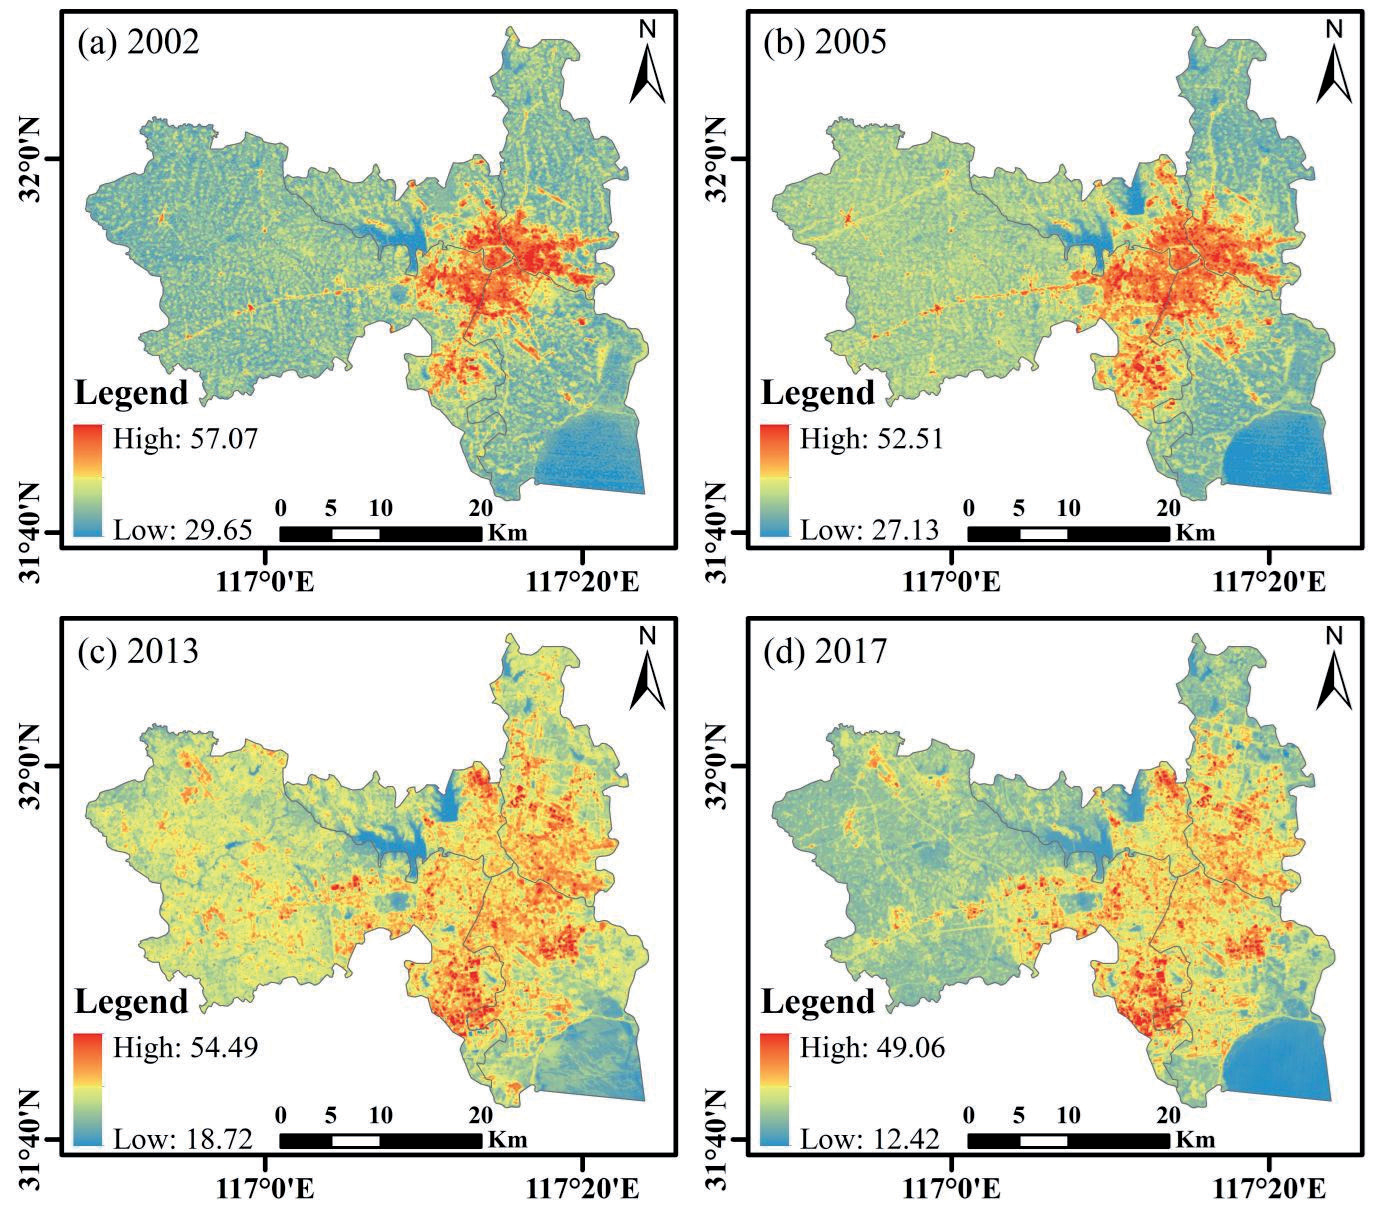
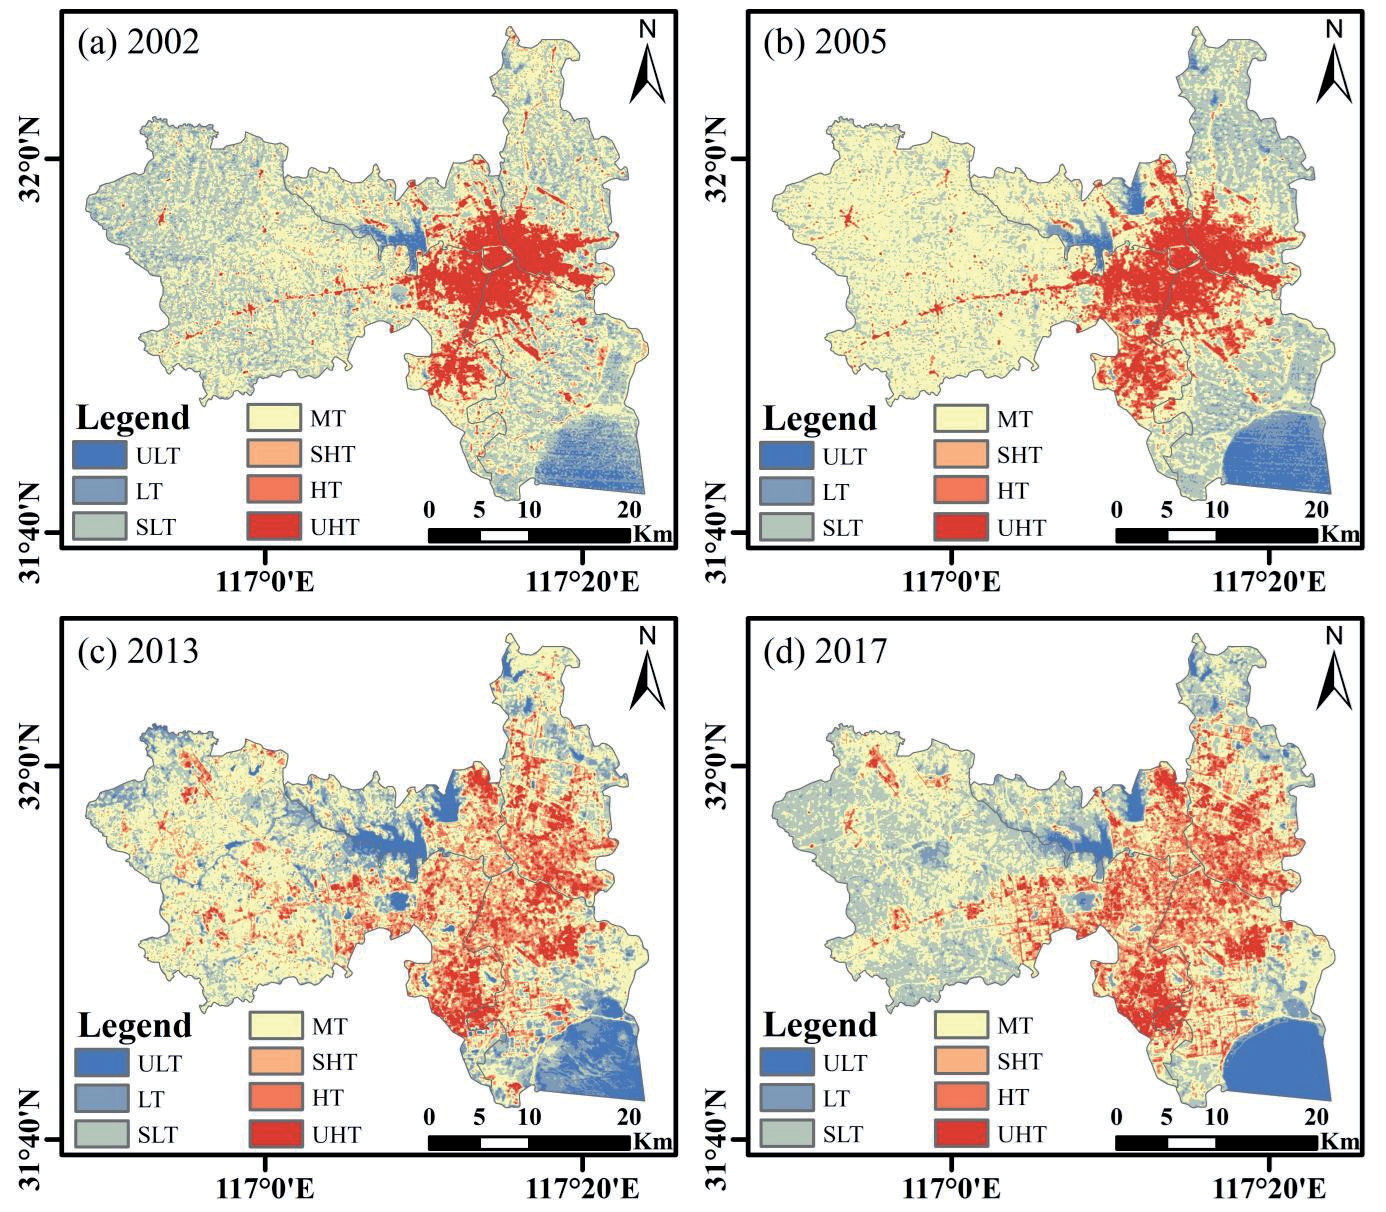
According to Fig. 4 and Table 4, the LST distribution in the built-up area of Hefei has expanded considerably from 2002 to 2017, with the spatial expansion mainly extending along the central area of the city to the surrounding areas. Water bodies and vegetation are mostly distributed in low-temperature (LT) zones, whereas ISA is concentrated in high-temperature (HT) zones. The minimum and maximum LST in the study area decreased from 29.65 to 12.42ºC and 57.07 to 49.06ºC, respectively; the temperature difference (∆T) between them showed an overall increasing trend. In general, from 2002 to 2017, the minimum, maximum, standard deviation, and average values of LST showed a downward trend, indicating that the high-value areas of LST showed a downward trend as a whole. Notably, Hefei’s built-up area experienced a gradual increase in the maximum and average LST from 2005 to 2013, primarily from the enhancement of urban construction activities at this stage, which is consistent with the actual development of the built-up area of Hefei.
Analysis of Dynamic Change in LST Grade
Fig. 5 shows the significant change in LST in Hefei’s built-up area from 2002 to 2017, with varying surface distributions of different temperature levels in each period. LT zones were mainly located in areas with high water and vegetation coverage. The medium-temperature area (MT) was mainly concentrated in suburban areas. In agreement with the ISA spatial distribution, HT zones are mainly concentrated in urbanized areas with a high density of buildings and populations. Its spatial distribution showed a trend of diffusion from the center to the periphery.
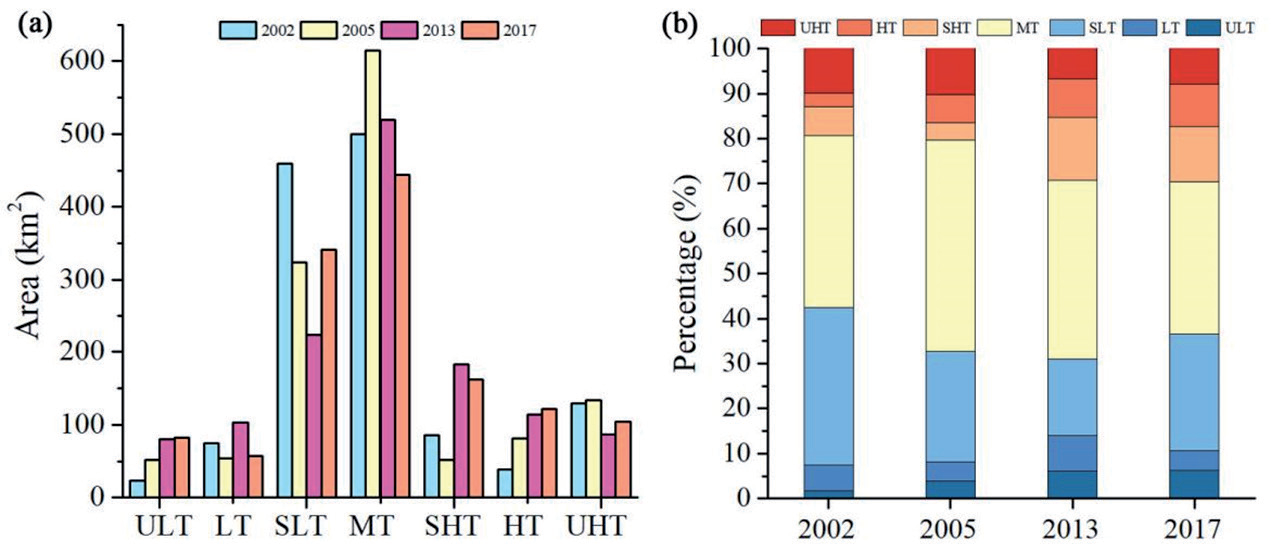
Fig. 6 shows that the largest area in each temperature class in the built-up area of Hefei between 2002 and 2017 was MT, whose area share changed from 38.13% in 2002 to 33.82% in 2017. In 2013, its area was 615.07 km2, accounting for 46.90% of the total. From 2002 to 2017, the proportion of sub-high temperature (SHT) and HT areas increased significantly, from 6.49% and 2.97% to 12.35% and 9.27%, respectively. The areas of the SHT and HT increased from 85.15 km2 to 161.97 km2 and 38.89 km2 to 121.61 km2, respectively, showing significant growth. The proportions of sub-low temperature (SLT) and LT areas decreased from 35.05% to 25.98% and 5.71% to 4.39%, respectively. The proportion of the LT increased from 1.78% to 6.24%, showing an increasing trend. From 2002 to 2017, the LT and MT areas in the built-up area of Hefei shifted to HT areas, which grew significantly.
Because the urban heat island effect generally occurs in HT zones (including lowest-temperature area, HT, and SHT zones), the area change in LST classes for each administrative region focused on the change in HT zones. From 2002 to 2017, the HT area in Shushan District increased the most (Table 6), from 104.61 km2 to 155.58 km2, with an increase of 50.97 km2, followed by the Baohe and Yaohai districts, where the HT areas increased by 45.66 km2 and 36.43 km2, respectively. The change in HT area in Luyang District was the smallest, increasing by only 1.14 km2. The changing trend of the HT zones in each administrative region from 2002 to 2017 was consistent with the changing trend of the ISA (Table 5).
Table 3.
Change in the ISA expansion index in the built-up area of Hefei from 2002 to 2017.
Correlation Analysis of ISA and LST
Multiple model regression was used to quantitatively analyze the BCI values of the ISA and LST. All fitting equations met a significance level of 0.01 in this study. From the multiple model regression analysis, the BCI value of the ISA in the obtained relationship was positively correlated with LST. The quadratic function model had the strongest relationship and could best describe the relationship between the BCI values of ISA and LST (Table 6).
The R2 for 2002, 2005, 2013, and 2017 were 0.79, 0.78, 0.69, and 0.73, respectively. Thus, the larger the BCI value in the built-up area of Hefei, the higher the corresponding LST. In 2002, the added value of LST (1.85ºC) showed positive growth, which increased with an increase in the BCI value of the ISA. In 2005 and 2013, the increase in LST was positive, with average increases of 1.73ºC and 2.22ºC, respectively. In 2017, when the BCI value of the ISA was <0.7, the increase in the LST was positive. When the BCI value of the ISA was >0.7, the increase in LST was negative; the average increase in LST was 1.17ºC. In general, from 2002 to 2017, the LST of the built-up area in Hefei increased with an increase in the BCI value of the ISA. However, the increase in the LST corresponding to different BCI values was different. For every 0.1 increase in the BCI value of the ISA, the average increase in LST was >1ºC, showing a fluctuating upward trend (Table 7).
Discussion
Spatio-Temporal Variation of ISA
From 2002 to 2017, ISAs in the built-up area of Hefei increased considerably. These results are consistent with the ISA changes in Tianjin reported by Cao et al. [38]. The continuous urban expansion caused changes in the urban subsurface, which is the main reason for the changes. The Hefei City planning policy has greatly contributed to ISA growth. In 2002, the administrative division of Hefei was adjusted and four administrative regions were established. Simultaneously, with the beginning of the construction of the Shushan District, its ISA expanded rapidly. In 2005, the ‘141’ urban space development strategy was proposed in the Hefei City Master Plan, and the Baohe District developed rapidly, with a rapid increase in the area of ISA. These performances are consistent with the results of our study.
Table 5.
Change of HT zones in the built-up area of Hefei from 2002 to 2017.
| Year | 2002 (km2) | 2005 (km2) | 2013 (km2) | 2017 (km2) |
|---|---|---|---|---|
| Shushan | 57.61 | 69.55 | 135.69 | 113.27 |
| Baohe | 27.58 | 25.54 | 67.93 | 74.50 |
| Luyang | 17.14 | 16.96 | 28.18 | 55.25 |
| Yaohai | 21.71 | 21.07 | 65.15 | 66.62 |
Table 6.
Multi-model regression analysis of LST and ISA.
According to the spatial expansion trend of the ISA, this increase reflects the trend of extension from the central city to the surrounding area. Impervious surfaces were mainly concentrated in the northwest of Baohe District, west of Shushan District, southeast of Luyang District, and south of Yaohai District. This location is consistent with the distribution of the major industrial parks and core industrial areas in Hefei. Future planning should therefore rationalize the spatial pattern of impervious surfaces to avoid over-intensification of the Hefei city center.
Thermal Environmental Effects of LST
The results show that the LST extremes, standard deviations, and mean temperatures in Hefei’s built-up area have been on a downward trend compared with 2002. This is different from the increase in the average LST in Taiyuan reported by Luo and Wu [39]. Because the old city of Hefei was built in 2002, dense buildings and other areas of land were relatively rough, and the original LST was relatively high. However, in recent years, owing to the stable development trend of the central urban area, garden construction activities have been strengthened to pursue high-quality development and a good ecological environment. As the first national garden city in Anhui Province, Hefei has always paid attention to the construction of environmental greening, and the vegetation coverage rate has been increasing [40]. A large area of the water system, such as Chaohu Lake, the Nanfang River and the Pai River in the city, still plays a governing role in the high temperatures of the city.
In the change in LST grade, the proportion of MT areas was the largest, accounting for >30%, and the HT ratio was <10%. These results are different from those of other megacities studied by Jiang and Lin [21]. This is because in comparison with Beijing, Shanghai, Guangzhou, and other megacities that were established late [41], Hefei has yet to form a strong urban heat island. LT showed an increasing trend, which was closely related to the increase in water area in Hefei and the strengthening of Chaohu Lake management in recent years. From 2002 to 2017, the proportions of LT, SLT, and MT decreased significantly, whereas the proportions of SHT and HT increased significantly. The results of this study are consistent with those of other cities. This shows that with the rapid development of the city, the ISA expands and the land use intensity increases, which is not conducive to heat emissions, and enhances the urban surface thermal environment effects, consistent with the results of Li et al. [27]. In the future, urban planners in Hefei should reasonably optimize the distribution pattern of impervious surfaces in the city, and the expansion of HT areas in the city should be better controlled through ecological projects such as “greening” and “blue protection.”
Relationship between ISA and LST
From the perspective of spatial distribution, the distribution of HT zones is consistent with that of the ISA, mainly concentrated in high-tech parks, industrial clusters and residential communities. This is consistent with the findings of Li et al. [27]. The expansion of the ISA is significantly restricted in areas with abundant vegetation or water systems. Areas such as the Dashushan Forest Park in the western part of the Shushan District, Chaohu Lake in the southern part of the Baohe District, and the Dongpu and Dafang Ying reservoirs in the central and western parts of Luyang District have a limiting effect on the expansion of ISA. Therefore, by protecting water bodies and increasing landscaping construction, future planning can limit the expansion of ISAs and slow the thermal environment effect.
Regression results from multiple models and BCI values of the ISA and LST showed a strong quadratic function relationship, with R2 ≥ 0.68. The LST increased with increasing BCI values of the ISA, consistent with the results of Hao et al. [41]; however, the increase in LST corresponding to different BCI values of ISA varies. In the future, urban thermal environmental benefits can be mitigated using new building materials with high reflectivity, high infrared reflectivity, and increased green roof areas.
Limitations and Prospects
The research has certain practical implications as well as some shortcomings, as follows:
The inversion of LST used to study the urban thermal environment. The inversion results were instantaneous, had low resolution, and varied among different dates and years. This is unfavorable for data acquisition. In the future, more accurate LST inversion data should be studied.
The urban thermal environment is influenced by many factors. This study focused on the spatio-temporal variation characteristics and influencing factors of LST from the perspective of ISA change, and other surface parameters were only briefly involved. In the future, other factors, such as surface cover type, population, and other natural, social, and economic factors, should also be considered.
Conclusion
This study analyzed the built-up area of Hefei. Based on Landsat series multi-temporal remote sensing data, the BCI was selected to extract the ISA, and the radiation equation transmission method was used to invert the LST. Multiple model regression was combined with quantitative analysis to explore the spatio-temporal distribution characteristics of ISA, its effect on thermal environments, and correlation between ISA and LST. The main conclusions are as follows.
Based on spatio-temporal variation, the total area of the ISA in the study area increased from 132.05 to 313.37 km2, for a total increase of 181.32 km2. Shushan District had the largest expansion area (62.28 km2), Baohe District had the largest expansion intensity (12.04%), and Luyang District was the most stable.
The spatio-temporal patterns of LST revealed that its temporal and spatial distribution was consistent with the change in ISA; its spatial distribution mainly extended along the central area of the city. Its extreme value, standard deviation, and average value showed a downward trend, indicating that recent ecological construction activities have considerably slowed down urban thermal environmental effects. The overall area of the HT zones markedly increased, and the effect of the urban thermal environment was enhanced. The area of the HT zones in the Shushan and Luyang districts increased the most and least, respectively.
Multiple model regression results revealed that the BCI value of the ISA in the obtained relationship was positively correlated with the LST. The quadratic function model had the strongest relationship and the coefficient of determination R2 was above 0.68. The LST increased with an increase in the ISA BCI value, with the increases corresponding to different BCI values. For every 0.1 increase in the BCI value of the ISA, the average LST increased by >1ºC.
Therefore, future urban planning should avoid over-intensive development in the Hefei city center. Urban thermal environment effects can be effectively limited by measures such as the reasonable allocation of blue-green spaces, use of new building materials with high reflectivity, and development of green roofs.

