

Introduction
With the frequent occurrence of extreme weather events, which pose a threat to the human economy and society, reducing emissions of greenhouse gases has become a focus of attention for countries around the world. The IPCC claims that land-use activities like forestry and agriculture are important contributors to greenhouse gas emissions, making up roughly a quarter of all net anthropogenic emissions. In 2015, China enacted the "One Control, Two Reductions, Three Fundamentals" policy, proposing measures to reduce emissions and sequester carbon, such as water conservation in agriculture, no increase in the use of fertilizers or pesticides, and comprehensive utilization of agricultural waste [1]. In June 2022, the relevant government departments implemented 10 major actions to reduce emissions and sequester carbon, including methane emission reduction in rice paddies, low-carbon emission reduction in livestock and poultry, emission reduction and remittance enhancement in the fisheries industry, comprehensive utilization of straw and the construction of a monitoring system, etc. After a series of actions, what is the state of China’s agricultural green development at the moment, and how has it changed from before emission reduction and carbon sequestration? Changes in green total factor productivity (TFP), which incorporates carbon emissions from undesirable outputs, are used to study the current status of China’s agricultural green development and its evolution and to review the effectiveness of China’s current agricultural emission reduction and carbon sequestration.
Traditional measures of productivity are not a true reflection of agricultural development achievements because they ignore resource and environmental factors [2]. For this reason, some scholars have examined the effectiveness of greening agriculture in terms of agricultural productivity, taking into account resource and environmental factors [3, 4], which is called agricultural green TFP. As a quantitative indicator, green TFP in agriculture can be a good reflection of the current state of regional development of high-quality agriculture, and its changes can well reflect the development of regional agricultural green production technology [5]. So, the choice of agricultural green TFP and its changes to assess the regional agricultural high-quality development has a strong rationality. Choosing how to measure TFP, Tone et al. [6] added slack variables and constructed a non-radial, non-angle DEA-SBM (Slack-Based Measure) model that takes into account non-expected outputs, in order to reduce the measurement bias due to radial and angular choices in traditional DEA models. Coupled with the fact that DEA models, unlike parametric analysis, require subjective analysis to determine the form of the production function to be used, the convenience and practicality of the SBM model makes it the most used method for measuring green TFP in agriculture. However, if one wants to analyse green TFP in agriculture from a dynamic change perspective, one cannot only consider the SBM model, which analyses the efficiency of different frontiers, and the introduction of the ML productivity index based on this model can solve the problem of not being able to make dynamic comparisons. Sheng et al. [7] analysed the changes in agricultural TFP in China’s plantation and animal husbandry industries in different periods using the index method and found the following pattern: rapid but uneven growth in the period after reform and opening up. Taking 2009 as the cut-off point, growth was around 2.4 percent per year until then; however, average productivity growth slowed to 0.9 percent after 2009 but has gradually recovered since 2012. Using a super-efficient SBM model, Liu et al. [8] find that China’s agricultural green TFP generally shows a fluctuating growth trend, with increasing interprovincial disparities. The average annual level of green TFP in agriculture is higher in the east than in the other regions. Zhong et al. [9] used the Metafrontier ML index to compare the green TFP of agriculture in China and different regions. First, at the national level, the level of efficiency is low and fluctuating, but there is an increasing trend, and second, at the regional level, the overall characteristics over time are like the trend at the national level, but the efficiency value decreases sequentially. Zhou et al. [10] utilized SBM-ML to estimate the increase of green TFP in agriculture as part of their study on the effects of digital economic development on sustainable agriculture. During the study’s sample period, the AGTFP’s EC was marginally lower than that of the TC, indicating that there is still an opportunity for efficiency improvement.
Based on current research, the selection of measurement methodology for measuring the correlation index relies heavily on the SBM model. However, the use of this model to measure TFP results may introduce bias. Most studies typically begin the selection of input indicators with factors of production, although variations exist in the particular indicators employed. The undesirable output indicators in existing studies are mainly selected from agricultural surface source pollution [11], carbon emissions [12], and indicators that include both of the above [13, 14].
There is a need for improvement in measuring green total factor productivity in agriculture due to the bias present in existing studies. This bias stems from differing research methodology, study sample periods, input indicators, and unexpected output perspectives. This study examines the current state of agricultural green development in the context of policy that places a greater emphasis on emission reduction and carbon sequestration. As a result, carbon emissions are chosen as an undesired output, and agricultural green TFP at the provincial level in China is scientifically measured using the global reference EBM function model and the ML productivity index. The spatial distribution pattern and dynamic evolution trend of China’s agricultural green TFP are described using the standard deviation ellipse and kernel density estimation methods. This provides an intuitive interpretation of the spatial variability of China’s agricultural green TFP, offering a theoretical basis for coordinated development among different regions. Based on the idea of spatial distribution consistency, an empirical study of the factors influencing the spatial differentiation of China’s agricultural green TFP is then carried out using the GeoDetector tool. By identifying the factors that cause spatial differentiation, this research presents a practical foundation for enhancing green TFP in agriculture across varied regions.
Materials and Methods
Research Indicators and Data Sources
Agriculture, namely farming, is the topic of study in this paper. Due to variations in research focus and data accessibility, seven factors were used as inputs, namely land, labor, machinery, irrigation, pesticides, fertilizers, and agricultural films. The details of these indicators are presented in Table 1.
It should be noted that among the input indicators, labor and machinery inputs are not directly available and need to be obtained by multiplying the relevant broad agricultural total by the share of total agricultural output value in total agricultural, forestry, animal husbandry, and fishery output value [15]. Among the output indicators, the gross value of agricultural production is adjusted for the 2001-based producer price index for agricultural products in order to reduce the impact of price changes. Based on Liu et al. [16], the accounting of agricultural carbon variables takes into consideration sources including cropland, tillage, livestock, fertilizers, pesticides, and mechanical power [17]. Reasons for choosing carbon emissions as a non-desired output are: this paper primarily centers on the impact of carbon emission changes on agricultural green total factors, in the context of achieving the dual-carbon target. Secondly, the data employed to measure the carbon emissions are more objective and accurate. Furthermore, currently, there is a disagreement among the academic community regarding pollutant selection, particularly concerning the narrowly defined agricultural production, and it is not in line with reality to measure rural domestic pollution as a non-desired output.
The data aforementioned information is primarily drawn from the database of the National Bureau of Statistics of China, and any gaps are filled in by official, reliable sources like the China Statistical Yearbook, China Agricultural Statistical Yearbook, China Water Resources Statistical Bulletin, and a few provincial and municipal statistical yearbooks.
Methodology
Super-EBM-GML Productivity Index
To measure green TFP in agriculture, this study uses the DEA method. The approach was initially put out by Charnes et al. [18], and it was expanded upon by Banker et al. [19], leading to the development of a number of efficiency evaluation models. This study employs the EBM model to accurately portray the proportionality between the actual value and the desired value. It is based on the aforementioned SBM model [20] and makes use of the EBM function presented [21], which contains both radial and non-radial EBM functions. The specific model is presented in the following way.
where γ* denotes the optimal efficiency value measured by the EBM model; θ denotes the efficiency value under radial conditions; si− denotes the input factor i’s slack under non-radial situations; λ is the relative weight of the input factors; (xio,yro) denotes the input-output vector of the o DMU; wi− represents the weight of input factor i, reflecting the importance of input factor m i, and satisfy ∑ w−i = 1; ɛx indicates that the proportion of radial changes is included, also contains the core i=1 parameters of the nonracial relaxation vectors; bpo represents the o non-expected output of the p province; (sr+, sp−), slack vectors representing the desired output of type r and undesired output of type p. However, the direct use of the EBM model does not allow for the ranking of cases where there may be more than two efficient units in the same period. The problem can be effectively addressed by the super-efficient DEA model developed [22]. Therefore, the provincial green TFP in agriculture was assessed using the super-effective EBM model.
Table 1.
Input-output indicators.
Based on the Malmquist productivity index suggested [23], several researchers have developed the ML index [24] and the GML index [25], which take into consideration non-expected production. When building the production frontier, the GML index based on the ML index, which, in comparison to the ML index, reflects the long-term trend of productivity growth, takes into account all period observations. This effectively resolves the issue that linear programming with mixed directional distance functions tends to produce no workable solution.
Standard Deviation Ellipse Modeling
The standard deviation ellipse method is one of the classic methods for analysing the directional characteristics of spatial distribution [26]. It is based on the mean and standard deviation of a given variable, the ellipse formed by calculation, and the different elements that make up the ellipse can be interpreted and analysed for the spatial distribution of the object of study. The ellipse represents the spatial distribution range of the variable. The center of the circle, or the mean center, is the center of gravity of the spatial distribution of the variable. The long and short axes of the ellipse represent the degree of dispersion of the variable, respectively. A change in the azimuthal angle indicates a change in the primary trend of the distribution. The direction of the long axis is the direction of the spatial distribution. By comparing the differences in the standard deviation ellipses formed by the data from different years, the spatial distribution of the variables over time is analyzed for changes in the range and direction of the trend. Due to its efficacy and intuitiveness, it has been frequently utilized to study the spatial development trends of the economy, geography, and crime [27].
Kernel Density Estimation Model
Kernel density estimation is a nonparametric test. It is used to estimate an unknown density function. Unlike parameter estimation, which requires assumptions about the distribution of the data, kernel density estimation is a method of fitting distributions to the data themselves and studying the characteristics of the data distribution. In this study, the distribution pattern of green TFP in agriculture is described using continuous density curves using the kernel density estimation approach, and its evolutionary traits are then examined. The estimated formula is as follows:
where K is the kernel function and h is the bandwidth.
GeoDetector Model
According to Wolf and Ghosh [28], GeoDetector is a statistical technique that may be used to examine the factors causing regional variability that affect green TFP in agriculture. The rationale behind the method’s ability to show that a factor can influence the spatial heterogeneity of agricultural green TFP is that there is spatial heterogeneity in the factors that influence changes in the productivity of something in the first place, while at the same time, there is significant consistency or similarity between the spatial distributions of these drivers and the spatial distribution of agricultural green TFP. In the application of this study, the GeoDetector allows for the following analyses: (1) factor detection, i.e., analyzing whether the selected variables are drivers of spatial divergence in agricultural green TFP; and (2) interaction detection, i.e., analyzing whether the interactions of the selected variables are stronger in terms of their degree of influence than the individual variables.
Results and Discussion
Spatial and Temporal Patterns of Agricultural Green TFP
Characterizing the Time-Series Distribution of Agricultural Green TFP at the National Level
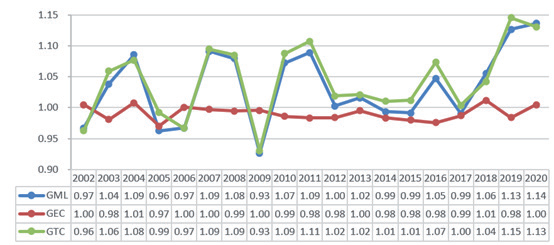
This research has generated the agricultural green TFP growth index as well as the decomposition indices GEC and GTC for the 30 sample provinces from 2002 to 2020, as shown in Fig. 1, based on the data and methodology given in the preceding section. Overall, from 2002 to 2020, agricultural green TFP fluctuated repeatedly. However, the average annual growth rate is 3.21%, which is evidence that China’s agricultural green TFP has been optimized over time. From the view of the trend of the sub-phase, from 2002-2012, the change of agricultural green TFP is not very stable, repeated oscillation within a certain interval, after a period of stable change, after 2015 there is a clear trend of higher, after being in a high level of fluctuation. The average values of GTC and GEC were 1.042 and 0.991, respectively, and GTC was significantly higher than GEC in most years. In terms of averages, the advancements in technical efficiency have hardly changed in our agriculture, but the long-term trend has been one of slow growth in efficiency improvements. The above study’s findings suggest that efficiency improvement must also play a part in the growth of green agriculture in China. However, there is still a great deal of potential to investigate efficiency improvement. It is worth noting that from 2015-2018, there was a definite rising tendency in GEC, while there were relatively large fluctuations in GTC. The opposite was true in 2018-2019, with GTC seeing a large increase and GEC seeing a more significant decrease. If statistical data are excluded, this phenomenon deserves high attention.
Spatial Distribution Patterns of Agricultural Green TFP
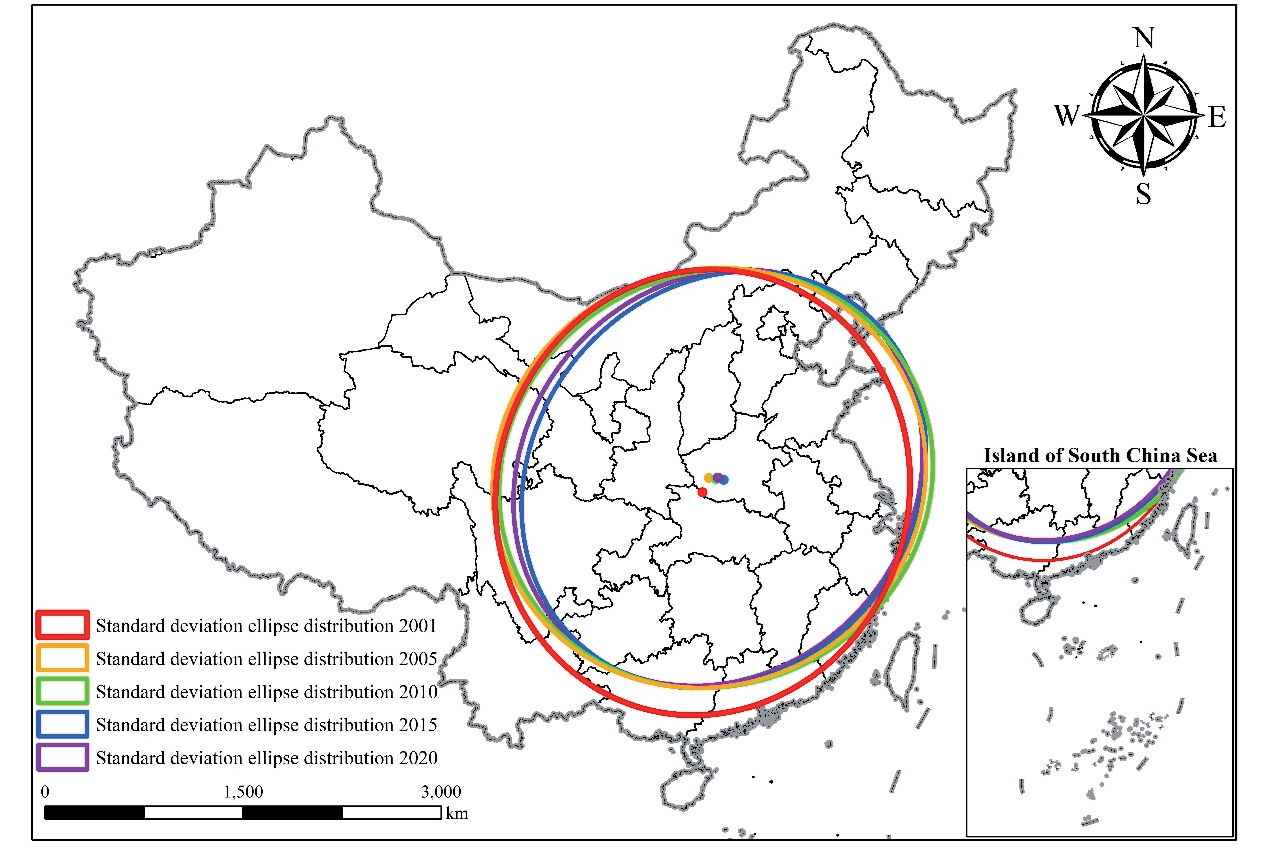
It is possible to characterize variations in the geographical distribution of China’s agricultural green TFP by generating the standard deviation ellipse of various years using the ArcGIS program, and then by comparing and monitoring changes in the ellipse’s various components. In Fig. 2, in general, the spatial evolution of green TFP for interprovincial agriculture in China from 2001 to 2020 is characterized by a clear shift to the east-north direction. The area of the ellipse increased and the distribution of agricultural green TFP eventually showed an expanding trend. The center of gravity of the standard deviation ellipse, the distribution range, and the direction will be used in this research to explicitly evaluate changes in the spatial distribution pattern of green TFP in China’s interprovincial agriculture.
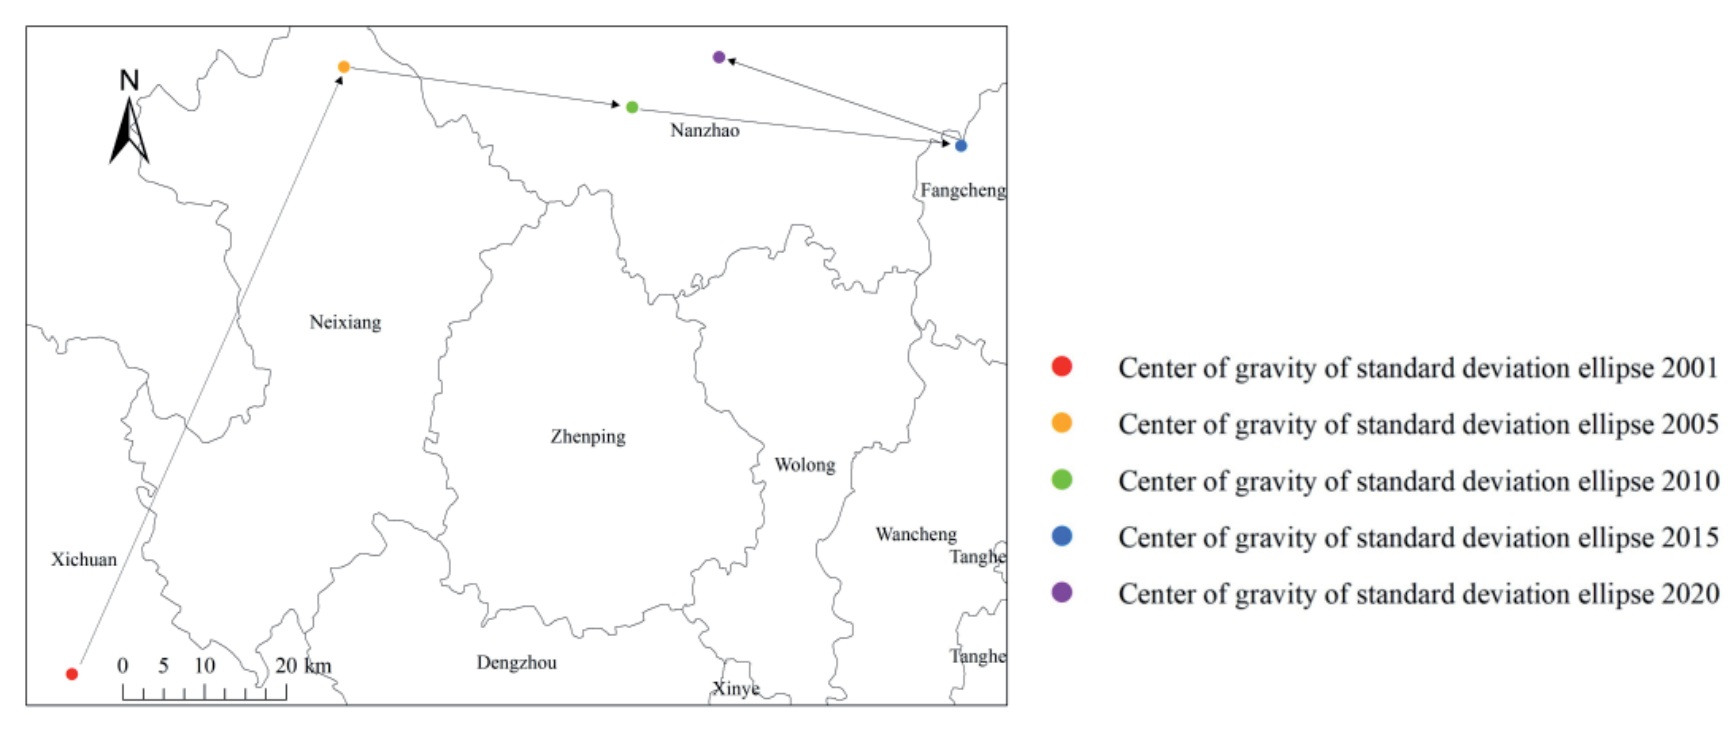
The geographic center of the distribution of agricultural green TFP is shown in Fig. 3 as the center of the standard deviation ellipse. The center of gravity of China’s agricultural green TFP throughout the observation years, according to Fig. 3, can be shown to be mostly found between 111.48°E and 112.71°E and 32.85°N and 33.49°N, all of which are spread inside Henan. It demonstrates that, in an east-west orientation, the country’s green TFP is, on average, higher in the east than it is in the west. Specifically, the agricultural green TFP has experienced “Northeast (2001~2005) - Southeast (2005~2010) - Southeast (2010~2015) - Northwest (2015~2020)”, with a total distance of 189.32km, including a total movement of 79.28km to the east and 75.57km to the north. In other words, as time goes on, the center of gravity of green TFP in Chinese interprovincial agriculture tends to shift toward the northeast. From 2005 to 2015, the center of gravity continued to shift to the southeast. At this time, the eastern coastal region of China, which has experienced rapid economic growth, has switched to an intensive development mode and there has been an increase in public awareness of the need to protect the agro-ecological environment. As a result, the green TFP of agriculture has improved due to the efficient use of resources and the decrease in pollution emissions. Contrary to the western and central regions, which were fueled by the “Western Development” and “Rise of Central China” economic policies, high pollution, and high inputs were used to promote the economy’s rapid development while disregarding the protection of the agro-ecological environment, leading to an increase in pollutant emissions and a decrease in the green TFP in agriculture. From 2015 to 2020, the center of gravity shifted to the northwest. The state started the “Ecological Civilization Construction” and “Green Agricultural Development” plans at this point, especially in the western part of the country, which has been developing in a sloppy manner, to improve the quality of the agro-ecological environment of the northwestern part of the country. This was done in recognition of the significance of environmental issues to the development of human society. The improvement of agricultural green TFP in these areas has also been indirectly facilitated by a number of policies, including increased environmental protection, strengthened resource conservation and management, and ecological preservation and restoration promotion.
The standard deviation ellipse correlation characterisation index very little changed overall over the observation year, as seen in Table 2. The majority of the areas covered by the ellipse are in China’s central and southeastern coastal regions, which have stronger economies and a better basis for agricultural output. This is consistent with how China’s agricultural regions have been developing over time.
The long-axis standard deviation is always greater than the short-axis standard deviation as seen from the standard deviation ellipse-like variations. The northeast-southwest orientation dominates the geographical distribution of agricultural green TFP. The elliptical short-axis standard deviation had the opposite tendency to the long-axis standard deviation between 2001 and 2010. Specifically, the standard deviation of the long axis of the ellipse falls and then grows, whereas the standard deviation of the short axis climbs and then declines. However, both changes are not large, so the ellipse area is slightly less, showing a contraction trend. From 2010 to 2015, the short-axis standard deviation exhibited a noticeably strong downward trend, shown in the value decline from 1056.06 km in 2010 to 983.57 km in 2015, demonstrating a south-to-north contraction of China’s agricultural green TFP. The long-axis standard deviation remains in a more stable state, leading to a reduction in the ellipse’s area. It is still the short-axis standard deviation that shows a large magnitude of change from 2015 to 2020, exhibiting an increasing trend of change. The standard deviation ellipse is spreading once more in an east-west direction, and the area of the ellipse grows, rising from the lowest value in the calendar year to 997.55 km in 2020. In conclusion, China’s agricultural green TFP distribution range mostly exhibits a narrowing-expanding tendency, showing that a balanced development trend dominates its geographical distribution.
The direction of the major trend in the geographical distribution of green TFP in interprovincial agriculture in China is shown by the standard deviation ellipse rotation angle. The agricultural green TFP of the provinces located in the southwestern direction of the ellipse axis grows faster than the provinces located in the northeastern direction of the ellipse, and vice versa, slower than the northeastern direction of the provinces, according to an increase in the angle of rotation and a clockwise rotation of the long axis of the standard deviation ellipse. When Table 2 is taken into consideration, it becomes evident that China’s interprovincial agricultural green TFP rotation angle follows a developmental trend that initially rises, then falls, and eventually stabilizes. This leads to the agricultural green TFP displaying a spatial distribution pattern from northeast to southwest. Regarding the extent of variation in the rotation angle of the ellipse, it increased from 15.62° in 2001 to 60.68° in 2005, which was the maximum value of all years, indicating that the northeast-southwest distribution pattern was strengthened during this period. However, from 2010 onwards, the rotation angle generally showed a decreasing trend of a certain magnitude, eventually stabilized, and reached 40.80° in 2020, indicating that the distribution pattern was again weakened to a certain extent.
Table 2.
Standard deviation ellipse related parameters of green TFP in Chinese agriculture, 2001-2020.
Dynamic Evolution of the Spatial and Temporal Distribution of Green TFP in Chinese Agriculture
The kernel density estimation method was further used to depict the absolute difference distribution of agricultural green TFP, especially to describe its overall shape and dynamic evolution law in terms of distribution location, distribution trend, distribution extension, and polarization trend. Fig. 4 and Table 3 illustrate this information.
Fig. 4.
Estimated three-dimensional kernel density in China and different food-producing regions, 2001-2020.
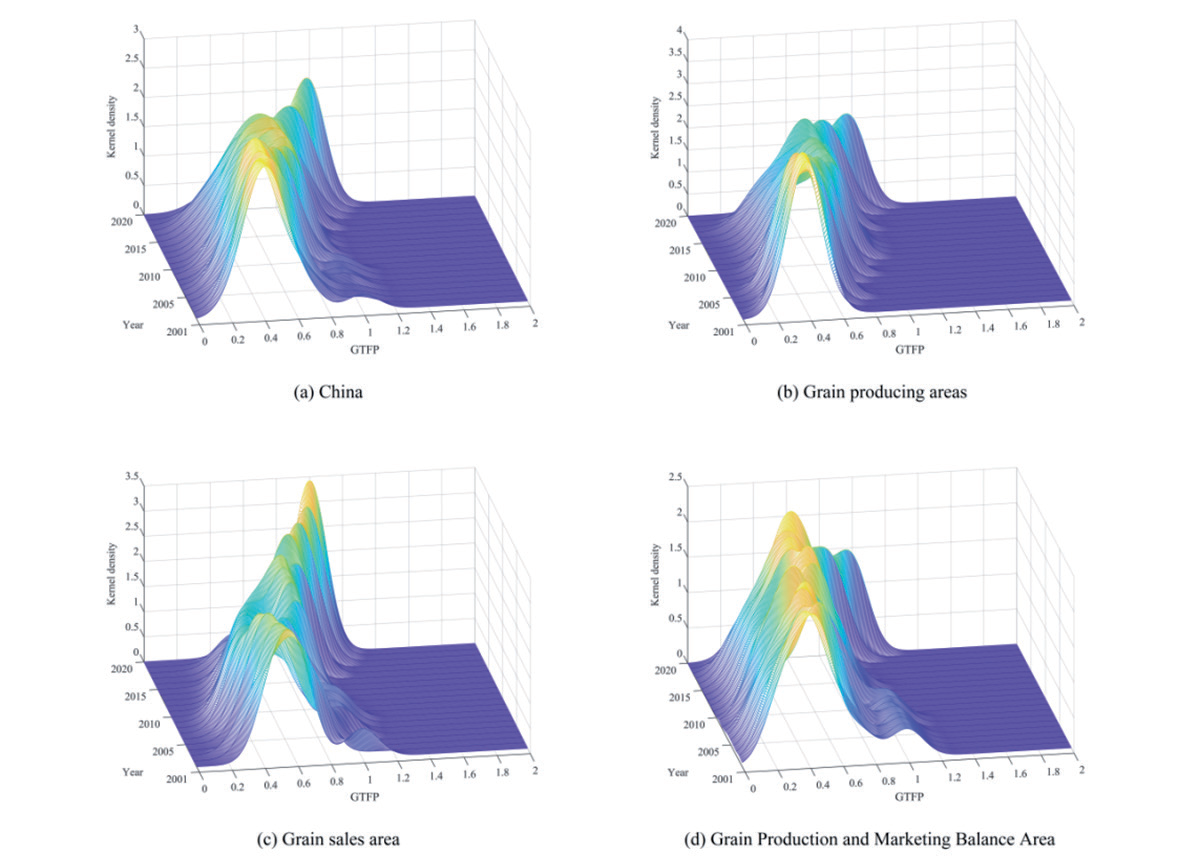
Table 3.
Characterization of the dynamic evolution of the country and different food-producing regions.
In terms of the movement of the wave peak, the position of the main peak of the green TFP of agriculture in the country as a whole and in the three major regions, in general, has a tendency to shift to the right, and the efficiency of all of them has been effectively improved, which is corroborated by the objective facts in the previous section. Specifically, the position of the main peak representing the whole country in Fig. 4a) shows a weak change of "left shift - right shift", indicating that there hasn’t been much of a change in the general degree of green development in agriculture. As can be seen in (a), the kernel density curve shows an overall shift to the right starting in 2006. At this stage of development, in addition to being influenced by the economic policies of different regions as mentioned above, emission and carbon reduction have also become important constraints on economic development. Guided by the concept of green development, local governments have implemented “low-carbon agriculture” policies, which have led to a steady decline in the intensity of agricultural carbon emissions. The distribution curves of different food-producing regions all show rightward shifts of different magnitudes, indicating the effectiveness of these regions in reducing emissions and sequestering carbon in agriculture. It is worth noting that the main grain marketing region experienced a greater leftward shift in the curve than the other two regions during the sample period, implying that the pressure to reduce carbon is greater in the more economically developed regions and that there is still greater difficulty in the implementation of some green policies.
In terms of the distribution pattern of the main peaks, the absolute differences in agricultural green TFP within the country as a whole and within the main grain marketing areas are gradually decreasing, in contrast to the absolute differences in agricultural green TFP within the main grain producing areas and the balance of production and marketing areas, which are expanding. Specifically, the main peak in Fig. 4a) undergoes a recurring process of “falling-rising-falling-rising”, while the width shows a trend of “decreasing-increasing-decreasing”. Compared with 2010, the main peak in 2020 became "sharp and narrow", indicating that with the gradual promotion of China's agricultural emission reduction and carbon reduction policies, the differences in agricultural green TFP across regions of the country have been narrowing over a relatively long period. In particular, the peak in the main grain marketing area showed an upward trend during the sample study period, and the shape of the wave peak gradually narrowed from a broad peak to a sharp peak, indicating that the situation of absolute differences in agricultural green TFP in the region has improved. In contrast, the main food-producing and the balance of production and marketing areas, which are slower to develop, generally show a decline in the height of the main peaks and a widening of their widths, but the changes in the absolute regional differences between the two are slightly different.
In terms of distributional extensibility, the distribution curve of agricultural green TFP for the country as a whole and for different food-producing regions shows the phenomenon of trailing to the right, which is caused by the existence of cities with higher agricultural green TFP within the regions. In addition, each region’s agricultural green TFP eventually shows a converging trend, indicating that differences within the group are gradually narrowing, and the cities with higher agricultural green TFP within the region are getting closer to the average. In terms of polarization trends, the 3D kernel density profiles of (a) (c) (d) in Fig. 4 follow a more consistent trend. This is evidenced by the fact that there are clearly multiple side peaks from 2001-2007 to only one side peak from 2008-2020. It demonstrates that polarization is waning throughout the nation as well as in the key regions for grain marketing and the balance of production and marketing. In contrast, the kernel density curves of the main grain production regions showed a single-peak distribution, indicating that there is no obvious polarization characteristic of the agricultural green TFP level in this region. The side peaks in the main grain marketing area and the balance of production and marketing area are significantly sharper and narrower than those in the Beijing-Tianjin-Hebei area, which also indicates that after the neutralization of the three areas, the polarization of the overall agricultural green TFP level of the whole country has been alleviated to a certain extent.
Table 4.
Drivers of spatial divergence of green TFP in Chinese agriculture.
Analysis of Influencing Factors
On the basis of revealing the evolution pattern of green TFP in Chinese agriculture, a GeoDetector model was used to investigate the impact of each driving element on the evolution of green TFP in agriculture [29]. The spatial differentiation of geographical entities can be influenced by elements of the economy, society, and natural environment [30, 31]. To investigate the elements influencing the changes to green TFP in agriculture, taking into account the accessibility of data, relevant variables from natural conditions, agricultural production conditions, agricultural technology level, agricultural economic development level, and agricultural support policies were selected as driving factors using relevant studies [32]. Table 4 shows the calculation process of each factor, mainly using the quartile classification method to categorize the independent variables. The aforementioned data information was gleaned from the National Bureau of Statistics’ database as well as the China Statistical Yearbook, China Rural Statistical Yearbook, Compendium of Statistical Data for 60 Years of New China, and other sources.
Analysis of Factor Detection Results
From the perspective of horizontal comparison of different driving factors, the three dimensions of the natural environment, agricultural resource endowment, and socio-economic policies have more significant differences in their respective impacts on green TFP in agriculture in different periods. Using 2010 as a cut-off point, agricultural production-related variables including the level of automation, the severity of disasters, and the crop structure were more significant prior to that year. Two factors that represent the level of economic development of agriculture and the fiscal support policy for agriculture, which represent the socio-economic policy dimension, play a more significant role in the changes in green TFP in agriculture after 2010, in addition to the replanting index regarding the drivers of agricultural production. Both q-values reached 0.39 and 0.46 in 2020.
Based on the longitudinal time evolution perspective, each driving factor shows a fluctuating trend over time. In terms of the dominant factors, the explanatory power of the replanting index, agricultural output per capita, and the level of financial support for agriculture has been increasing as a whole. Specifically: the overall increase in explanatory power is very significant, with the q-value of the replanting index rising from 0.13 in 2001 to 0.28 in 2020. The q-value of per capita agricultural output increased from 0.18 in 2001 to 0.39 in 2020. The q-value of the level of financial support for agriculture increased from 0.25 in 2001 to 0.46 in 2020. This shows that the effect of regional agricultural production circumstances, economic growth, and the extent of state assistance (administrative intervention) for agriculture on the geographical divergence of green TFP in agriculture is increasingly growing. The level of agricultural economic development indirectly affects the cultivation of excellent crop varieties, the application of energy-saving and emission-reducing technologies, and the improvement of agricultural production management. All of these measures can effectively promote reducing agricultural CO2 emissions and increase agricultural green TFP. It is also worth noting that the degree of mechanisation did not pass a statistically significant test in the factorial probe. This suggests a relatively limited impact on TFP growth in green agriculture. Possible causes include the fact that, on the one hand, growing mechanization boosts agricultural labor productivity and raises expected agricultural production. On the other hand, mechanised agricultural production relies mainly on oil and other energy sources, and increased mechanization will result in greater usage of petrochemical resources and a rise in carbon emissions, while the obsolescence of machinery and equipment will exacerbate energy consumption, which objectively leads to an increase in agricultural carbon emissions. Together, the two factors have a negligible impact on the regional divergence of green TFP in agriculture.
Analysis of Interaction Detection Results
Interaction detection reflects differences in the effects on agricultural green TFP when factors act together versus when factors act alone. The detection results reveal that the driver interactions all show two-factor strengthening or non-linear strengthening, and there is no independent effect or non-linear weakening. This suggests that the formation of the spatiotemporal pattern of interprovincial agricultural green TFP in China is the result of the cooperative action of the drivers. The explanatory power of the factor interactions on agricultural green TFP were all enhanced to different degrees relative to the single-factor effects, confirming that the changes in agricultural green TFP are complex factor interaction processes.
Fig. 5.
Detection of factors driving spatial divergence in the evolution of green TFP in agriculture.
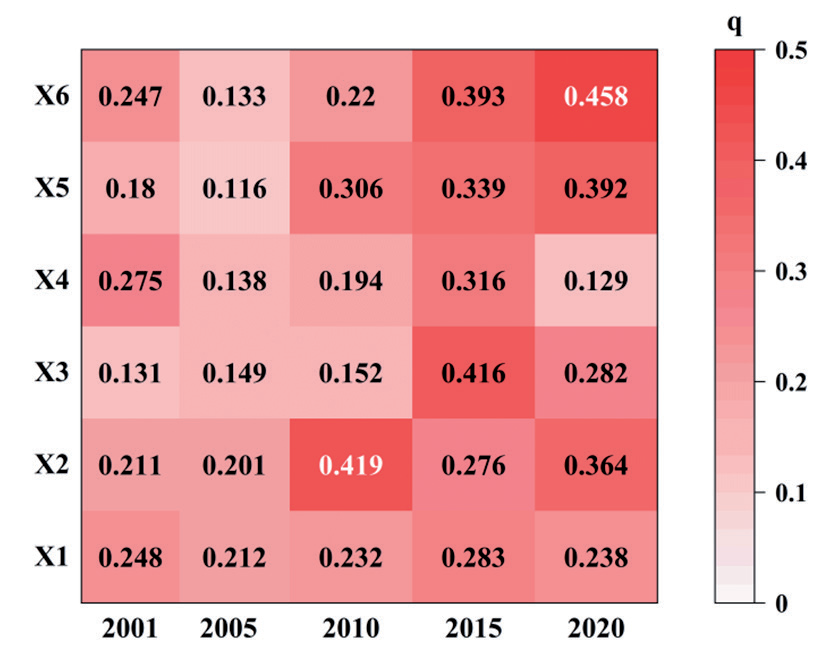
Fig. 6.
Interaction detection results of drivers of spatial differentiation in the evolution of green TFP in agriculture.
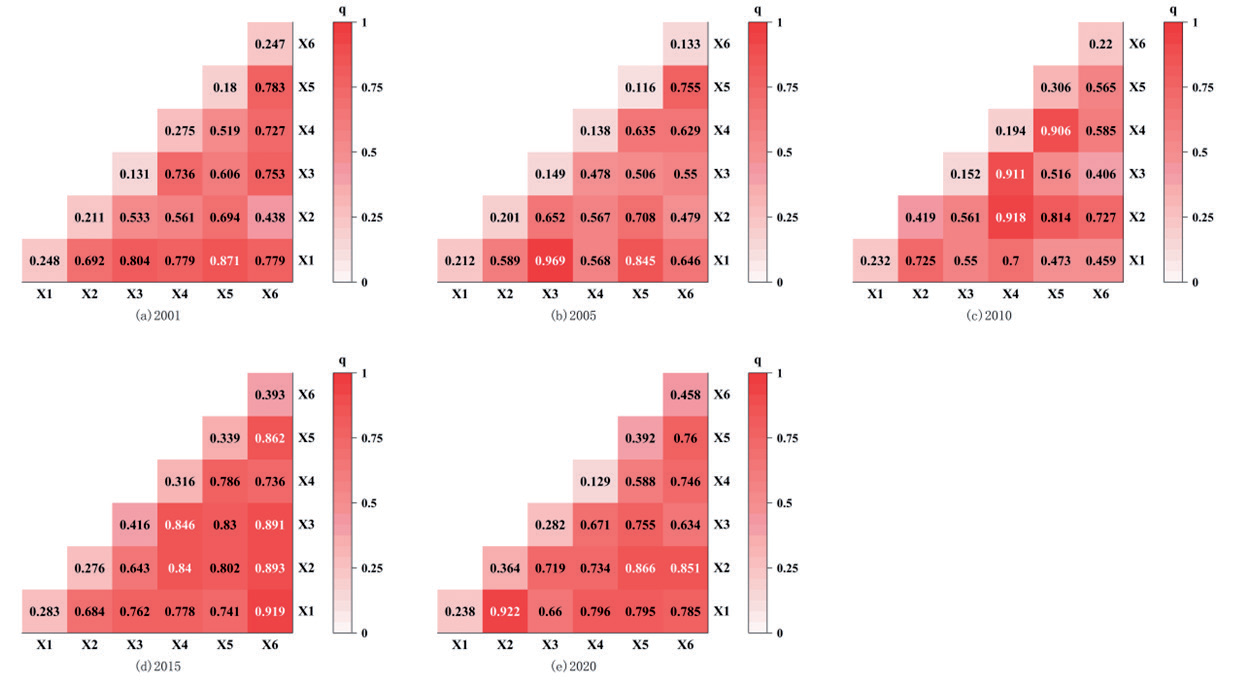
Based on Fig. 6, the comparison shows that the two-factor interaction has significantly greater explanatory power for agricultural green TFP than the single factor, but the driving factors that play a decisive role are changing in different periods due to the constant changes in market factors and government factors. Natural environmental factors were the primary cause of the spatial differentiation of green TFP in agriculture in China during this time, as shown by the significantly higher interaction between the level of disaster damage, which represents natural conditions, and other factors in 2001 and 2005. The area of crop damage increases and, assuming that the input of means of production remains constant, the undesired output remains constant, and the desired output decreases. The annual direct economic losses of the country due to natural disasters in the agricultural sector continue to increase [33, 34], which not only lowers agricultural output and farmer income but also disrupts the environment for agricultural production, making it difficult to improve agricultural green TFP. The amount of mechanization, which is a measure of agricultural technology, interacted strongly with other factors in 2010. Government subsidies for the purchase of agricultural machinery have been increasing since 2006, and this trend has continued over this time period, which has led to a rise in the amount of agricultural machinery. And the increasing number of agricultural machineries makes the input of farm machinery for cultivation continue to increase, which in turn promotes the strengthening of the interaction between it and the other factors. By 2015, the extent to which agriculture is financially supported, which represents the financial support policy, has the strongest interaction with other factors. At this period, as public investment in agriculture and financial support continue to increase, agricultural infrastructure tends to improve, the structure of the agricultural industry becomes more rational, and the management model is constantly innovated. Coupled with the gradual emergence of the positive external effects of industrial agglomeration itself, it encourages the continuous advancement of agricultural science and technology and the efficient use of resources, which reduces undesirable outputs and raises the green TFP of agriculture. In 2020, the planting structure, which represents the conditions of agricultural production, has increased its interaction with other factors. Cultivation structure adjustment affects agricultural carbon emissions, and the growth characteristics of different crops vary, with some differences in the amount of fertilizers and other agricultural chemicals needed. According to studies, food crops typically require less agrochemicals than cash crops, such as fertilizers, pesticides, and agricultural films. So as the proportion of food crop cultivation rises, the total amount of agricultural chemical inputs may decline, and carbon emissions are subsequently reduced. Thus, the interaction of cropping structure with other factors at this stage is responsible for the spatial differentiation of green TFP in agriculture.
Conclusions and Policy Recommendations
Based on panel data of agricultural production of 30 Chinese provinces from 2001 to 2020, this study measured the interprovincial green TFP of agriculture using the super-efficient EBM model and examined the trend of agricultural green TFP over time using the GML productivity index. After examining the features of its spatial differentiation using standard deviation ellipse analysis and kernel density estimation, we next used GeoDetector to investigate the variables influencing the spatial differentiation of green TFP in Chinese agriculture, with the main conclusions obtained as follows:
1) China’s agricultural green TFP, which has a long-term upward trend and an average annual growth rate of 3.21% between 2001 and 2020, is mostly fueled by technological advancements in the field of agriculture.
2) In interprovincial agriculture in China, the geographical evolution of green TFP indicated a change in the direction of the east-north, and the spatial distribution indicated an expanding tendency with a northeast-southwest distribution pattern. 3) The position of the main peak of agricultural green TFP in the country as a whole and the three main food regions generally shows a rightward trend. The absolute difference in agricultural green TFP within the country as a whole is narrowing, and the cities with higher agricultural green TFP within the region are approaching the average level, and the overall polarization of agricultural green TFP level has been alleviated to some extent. 4) The elements impacting the geographical differentiation of agricultural green TFP include fundamental agricultural endowments, socioeconomics, and the natural ecological environment. The effects of various factors on the spatial differentiation of agricultural green TFP vary significantly. The primary variables influencing geographical difference are the replanting index, agricultural production per capita, and the amount of financial assistance provided to agriculture. When interactions between the dominating factors took place, the impacts on the spatial differentiation of agricultural green TFP were amplified; the kind of enhancement was dominated by non-linear enhancement and reinforced by two-factor enhancement.
The synthesis of the above analysis mainly obtains the following insights: First, there is still significant potential for development in the effectiveness of agricultural technology, despite the fact that China’s agricultural green TFP has been continuously growing and agricultural technological progress is currently perceived as playing a leading role. This means that the efficiency of green technologies in agriculture should be improved by increasing the efficiency of the use of chemical inputs and agricultural tools. At the same time, in order to assure the pace of advancement of agricultural green technology, it is also required to promote research and development of agricultural green production technology and to increase the promotion and transformation rate of agricultural green technology accomplishments. Secondly, agricultural green TFP is characterized by significant spatial differentiation, for which regions should formulate corresponding development strategies in the light of their own agro-ecological development status, and at the same time focus on inter-regional synergistic cooperation to achieve improvement in cooperation. Regions with higher levels of agricultural green TFP growth should play a radiation-driven role, while regions with lower levels of growth should combine their own development conditions, learn from the advanced experience of regions with higher levels of growth, and continuously improve their own agricultural green TFP. Continue to strengthen exchanges and cooperation between different regions, and in particular, quicken the complete interchange of technology, energy, and other elements impacting green TFP in agriculture. Third, there are many distinct variables that affect the geographical differentiation of agricultural green TFP, and there are clear disparities in the effects of various driving forces. It is crucial to concentrate on and enhance the effect of dominating variables on the geographical differentiation of green TFP in agriculture. This study systematically analyzes the spatial and temporal variability of agricultural green TFP in China and its affecting factors, but the specific roles of different factors remain to be explored.

