

Introduction
Sichuan Province is a large economic province in western China, facing such problems as high energy consumption and low land use efficiency [1-3]. In accordance with the policy requirements of energy conservation and emission reduction [4, 5], Sichuan provincial government has put forward carbon emission policies and economic development policies at different stages in the new round of planning, which have clear indicators for the annual economic growth rate, the proportion of non-fossil energy consumption and the carbon dioxide emission per unit GDP [6, 7]. In order to achieve the government’s goal of energy conservation and emission reduction, economic development mode must be transformed. Therefore, it is of great significance to study the characteristics of carbon emissions in Sichuan Province over the years and the relationship between carbon emissions and economic development.
At present, many scientists are concerned about the impact of land use/cover change (LUCC) on the carbon balance of terrestrial ecosystems. The degree of LUCC cover change directly affects the production of carbon emissions [8-11]. In recent years, a considerable number of scholars at home and abroad have focused on carbon emission accounting [12]. The current calculation methods generally include IPCC inventory method, input-output method, life cycle method and measured method, etc., and the achievements are as follows [13- 16]. In addition, scholars studied the temporal and spatial changes of carbon emissions, focusing on the change analysis from the perspectives of fossil energy [17, 18] and land use [13, 19]. In addition, scholars have discussed the driving mechanism of carbon emission. Some scholars believe that population size, economic size, land use structure and energy consumption intensity are promoting factors for carbon emission growth [20, 21], and land use area per unit GDP and land use efficiency are inhibiting factors for carbon emission [20, 22]. Some scholars further explore the impact factors of carbon emissions in different industries, such as agriculture [23], industry [24], transportation [25] and construction [26].
A healthy economic development model is of vital importance to a country [27], the decoupling model can well analyze the changing relationship between environment and economic growth under certain conditions, and is often used to judge the health state of economic development. At present, there are mainly five decoupling index calculation methods, including OECD decoupling model, EA method, Tapio decoupling model, VA method and IGTX decoupling model. In addition, Tapio model solves the uncertainty problem in the selection of base period compared with OECD model [28-30]. Zhang et al. [31] combined LMDI model with Tapio model to further analyze the causes of decoupling state. For example, Yasmeen et al. [32] discussed the impact of environmental degradation and energy utilization on economic development in Pakistan based on the Tapio model. Based on the land cover data of 137 counties in Shandong Province from 2000 to 2020, Li et al. [33] analyzed the decoupling relationship between net carbon emissions and construction land. Xiao et al. [34] analyzed the relationship between cultivated land carbon emission and agricultural economic growth in Hubei Province by using Tapio decoupling model based on 20 years of county statistical data.
Despite extensive research on the relationship between economy, carbon emissions, and land type, there are still some deficiencies. These include: (1) The relationship between single land type and economy has received more attention from scholars, but less discussion on the whole research; (2) Most of the research areas are concentrated in the eastern part of China and the economically good areas, and the time scale is short, while the economic development of the less developed areas in the west of China is not paid enough attention to; (3) The internal relationship between economy and carbon emissions has not been studied deeply enough, and the driving force of decoupling elasticity index has not been studied much.
Therefore, the research focus is mainly on:
1. Change characteristics of carbon emissions caused by LUCC in Sichuan Province in recent 30 years?
2. How do LUCC and socio-economic factors affect carbon emission change in Sichuan Province?
3. What characteristics does land use carbon emission reflect in various stages of economic development in Sichuan Province? What policies and measures should Sichuan Province focus on in order to continue to develop a low-carbon economy?
Study Area
Sichuan Province, located in southwestern China, has diverse geographical features with its coordinates ranging from 26°03′ to 34°19′ N latitude and 97°21′ to 108°12′ E longitude. The province encompasses mountains, hills, plains, and plateaus, with mountains being the predominant landform, covering 74.2% of the total area. As of 2022, Sichuan Province had a population of 83.74 million, ranking it as the fifth most populous province in China. Additionally, Sichuan’s GDP in the same year amounted to 5674.98 billion yuan, contributing approximately 5% to China’s overall GDP (Fig. 1).
Data and Method
Data Sources
(1) The land use data in this study are derived from the 1990, 1995, 2000, 2005, 2010, 2015 and 2020 data of the global 30-meter land cover fine classification product provided by Liu et al. [35].
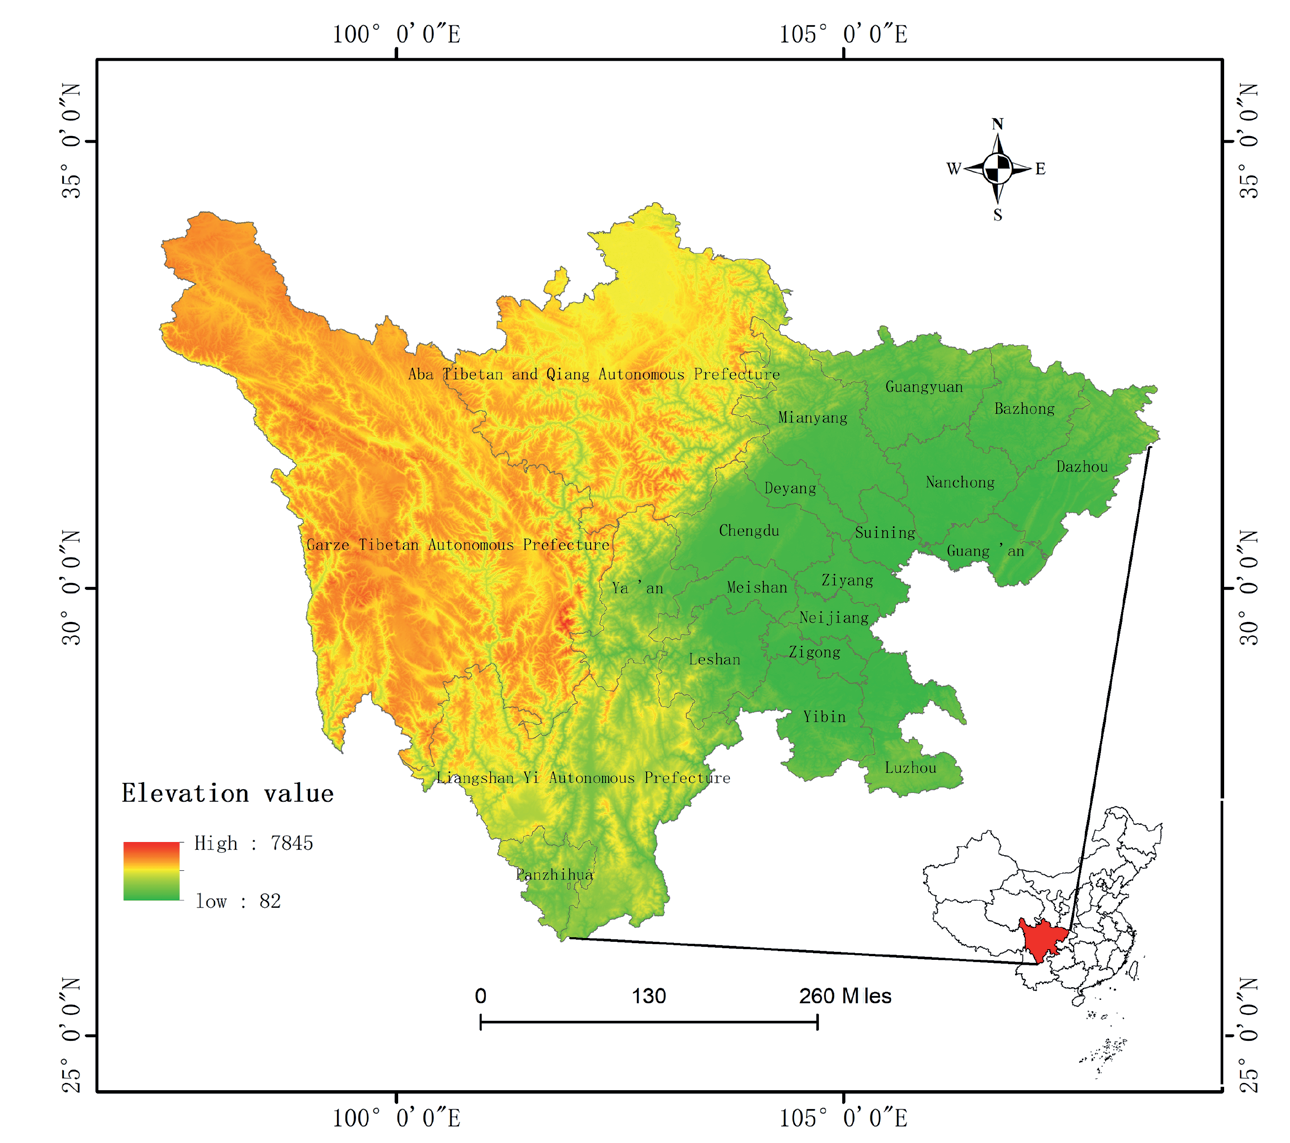
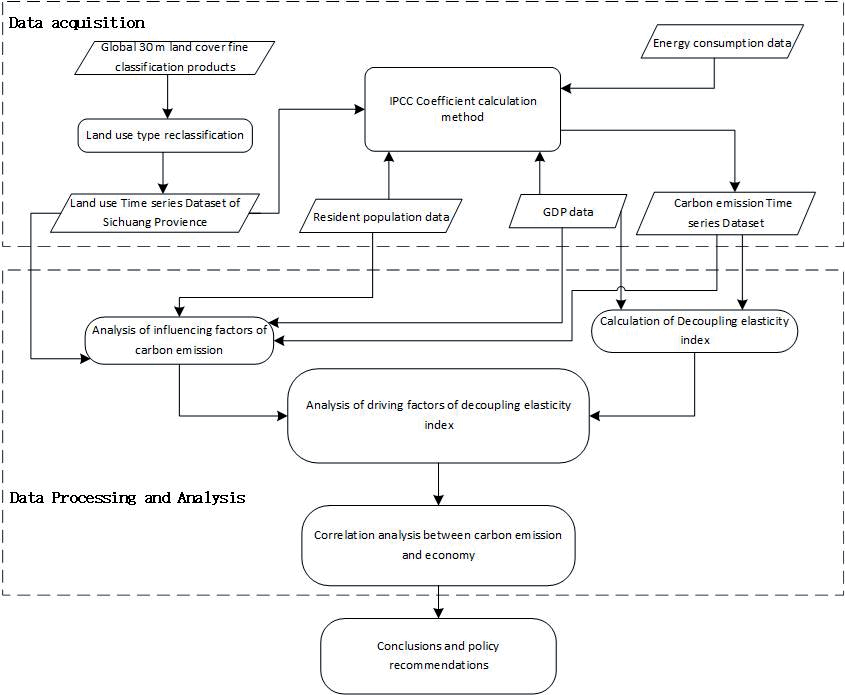
Table 1.
Land classification description of Sichuan Province.
(2) The socio-economic data used in this research are obtained from China National Bureau of Statistics, Sichuan Statistical Yearbook and Chongqing Statistical Yearbook [36, 37].
Method
Description of Land Use Classification
The land use data of Sichuan Province were reclassified in this paper by utilizing the global 30-meter land cover fine classification product data, with reference to the Chinese Academy of Sciences Land Use Classification System [38] and “Current land use classification” [39] (Table 1).
Land Use Carbon Emissions Calculation Method
1. Land use carbon emission calculation except construction land
The calculation formula is:
where Ci is the carbon emissions of land use type i, Ai is the carbon emission coefficient of land use type i (Table 2), and Si is the area of land use type i.
2. Carbon emission calculation of construction land
The calculation method of carbon emission of construction land is different from that of other types of land use, which is generally calculated indirectly by using energy consumption data [46-49]. Due to the large population in Sichuan Province, the impact of population respiration is also taken into account when calculating the carbon emissions of construction land [50, 51]. The calculation formula of carbon emission of construction land is as follows:
Where, Cj is the carbon emission of construction land, mj is the energy consumption data, βj is the conversion coefficient of standard coal, γj is the carbon emission coefficient, Cpeo is the carbon emission of population respiration. Referring to previous studies on respiratory carbon emissions of population [52-54], their average value is taken to participate in the calculation, and the specific value is 0.2169kg of carbon produced per person per day. Cpeo is obtained by multiplying the number of people by the carbon emissions produced per person per day and multiplying by the number of days. When calculating carbon emissions, double counting was avoided by considering only data from fossil fuels. The data from the Sichuan Provincial Bureau of Statistics and the National Bureau of Statistics were referred to in order to categorize energy into eight specific categories (Table 3). Carbon emission coefficient taken from IPCC, and energy conversion coefficient of standard coal is taken from China Energy Statistical Yearbook.
3. The calculation method of total carbon emissions
Formula for calculating total carbon emissions:
Where Ci is the carbon emission of land use type i, Ci is the carbon emission of construction land, and C is the total carbon emission. Energy consumption data from 1990 to 2020 for Sichuan Province was utilized in the calculation. However, the National Bureau of Statistics did not publish energy consumption data for 2020. Therefore, for the year 2020, consumption data for coal, crude oil, and natural gas from the Sichuan Statistical Yearbook was employed. As the National Bureau of Statistics did not supply population data for Sichuan in 1990 and 1995, the population figures for Sichuan Province in those years were sourced from the registered population data found in the Sichuan Statistical Yearbook (excluding the Chongqing area). For the years after 2000, population data was obtained from the National Bureau of Statistics’ permanent population records for Sichuan Province.
Table 2.
Carbon emission coefficient (kg·m−2·a−1).
| Type | Carbon emission coefficient | Source |
|---|---|---|
| Cultivated land | 0.0479 | Cai [40], He [41] |
| Forest land | -0.0581 | Fang [42] |
| Meadow | -0.0021 | Fang [42] |
| Unused land | -0.0005 | Yan [43], Lai [44] |
| Water area | -0.0253 | Lai [44], Duan [45] |
Table 3.
The conversion factors and carbon emissions factors.
Table 4.
Energy consumption data and population data.
In Table 4, the unit for natural gas is one hundred million cubic meters, while the units for other energy sources are ten thousand tons, and the units for population are ten thousand people (Table 4).
Analysis Method of Influencing Factors of Land Use Carbon Emission
Due to its close relationship with carbon emissions, the Kaya identity has become the standard in related research fields [55]. The prototype of Kaya identity is an analysis of carbon dioxide produced by the economy, energy and population, as follows:
Where, GHG is the total carbon emissions, TOE is the energy consumption, GDP is the energy consumption, POP is the total population, f is the carbon intensity of energy structure, e is the energy intensity per unit GDP, g is the per capita gross product, and p the is population size.
Land use change has a significant impact on natural carbon emissions, so the extended Kaya identity is used in calculation:
Where, C is the total carbon emission of Sichuan Province, Lu is the area of land use type u; L is the area of Sichuan Province; GDP is the gross product of Sichuan Province; POP is the resident population of Sichuan Province; fu is the carbon emission intensity per unit land(CEIPUL); su is the land use structure (LUS); k is the land use intensity per unit GDP (LUIPUG); g is the per capita gross product of Sichuan Province (PCG); pis the resident population of Sichuan Province; Because resident population is more appropriate than household population in calculating per capita GDP, and resident population can more accurately reflect the impact of population size on carbon emissions within a certain period of time, p is resident population (PS).
The impact of different factors on carbon emissions is quantified in this paper using the LMDI model, building upon the extension of the Kaya identity. The LMDI method, introduced in 1992, is a decomposition method based on the logarithmic mean Dee’s index method and is widely used in the analysis of driving forces behind carbon emissions due to its advantage of having no residual error [56-58]. The change in carbon emission values over time can be expressed as:
Two methods of quantifying regional carbon emissions by LMDI model.
Its addition decomposition formula is:
ΔCfu, ΔCsu, ΔCk, ΔCg, ΔCp are the contribution value of each influence factor from the beginning to the end of the study, respectively.
Its multiplication decomposition formula is:
Dfu, Dsu, Dk, Dg, Dp are the contribution rates of each factor from the beginning to the end of the study, respectively. When contribution value is >0 or contribution rate is >1, the increase of carbon emissions is promoted; when contribution value is <0 or contribution rate is <1, the increase of carbon emissions is inhibited.
Tapio Decoupling Model
The Organization for Economic Cooperation and Development (OECD) firstly proposed the decoupling development theory and established model to express the environmental pressure of economic growth [59, 60]. At present, one of the main goals of decoupling research is to find the ideal decoupling state in the dynamic changes of economic growth and resource consumption [61].
Tapio decoupling model is more time-varying than OECD decoupling model. Because Tapio model can analyze and compare data in different time periods, it can assess the decoupling relationship between land use carbon emissions and economy in more detailed way. According to Wang Yi et al [62], the model expression is as follows:
Where T is the decoupling elasticity index; %ΔC is the change rate of carbon dioxide emission; %ΔGDP is the rate of economic change; C 0 and C t represent the carbon emissions for the base year and t-year, respectively. GDP0 and GDP t correspond to the GDP of Sichuan Province in the base year and t year, respectively.
After taking driving factors into formula (18), the following formula can be obtained [63, 64]. The results are as follows:
Where Sfu, Ssu, Sk, Sg, Sp are contribution values of each influencing factor to T from the beginning to the end of the study, respectively.
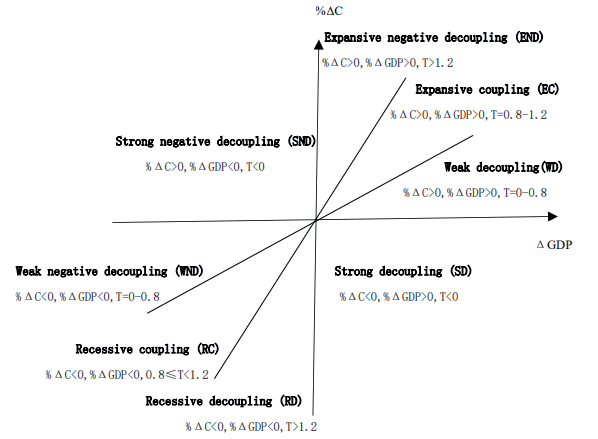
The Tapio decoupling model encompasses eight scenarios that span from the ideal state to the pessimistic scenario. These scenarios cover a range of situations, including one where carbon emissions decrease while economic growth occurs and another where carbon emissions worsen overall despite economic growth. The specific decoupling classification is shown in Fig. 3 [65].
Results and Analysis
Analysis of Land Use Change
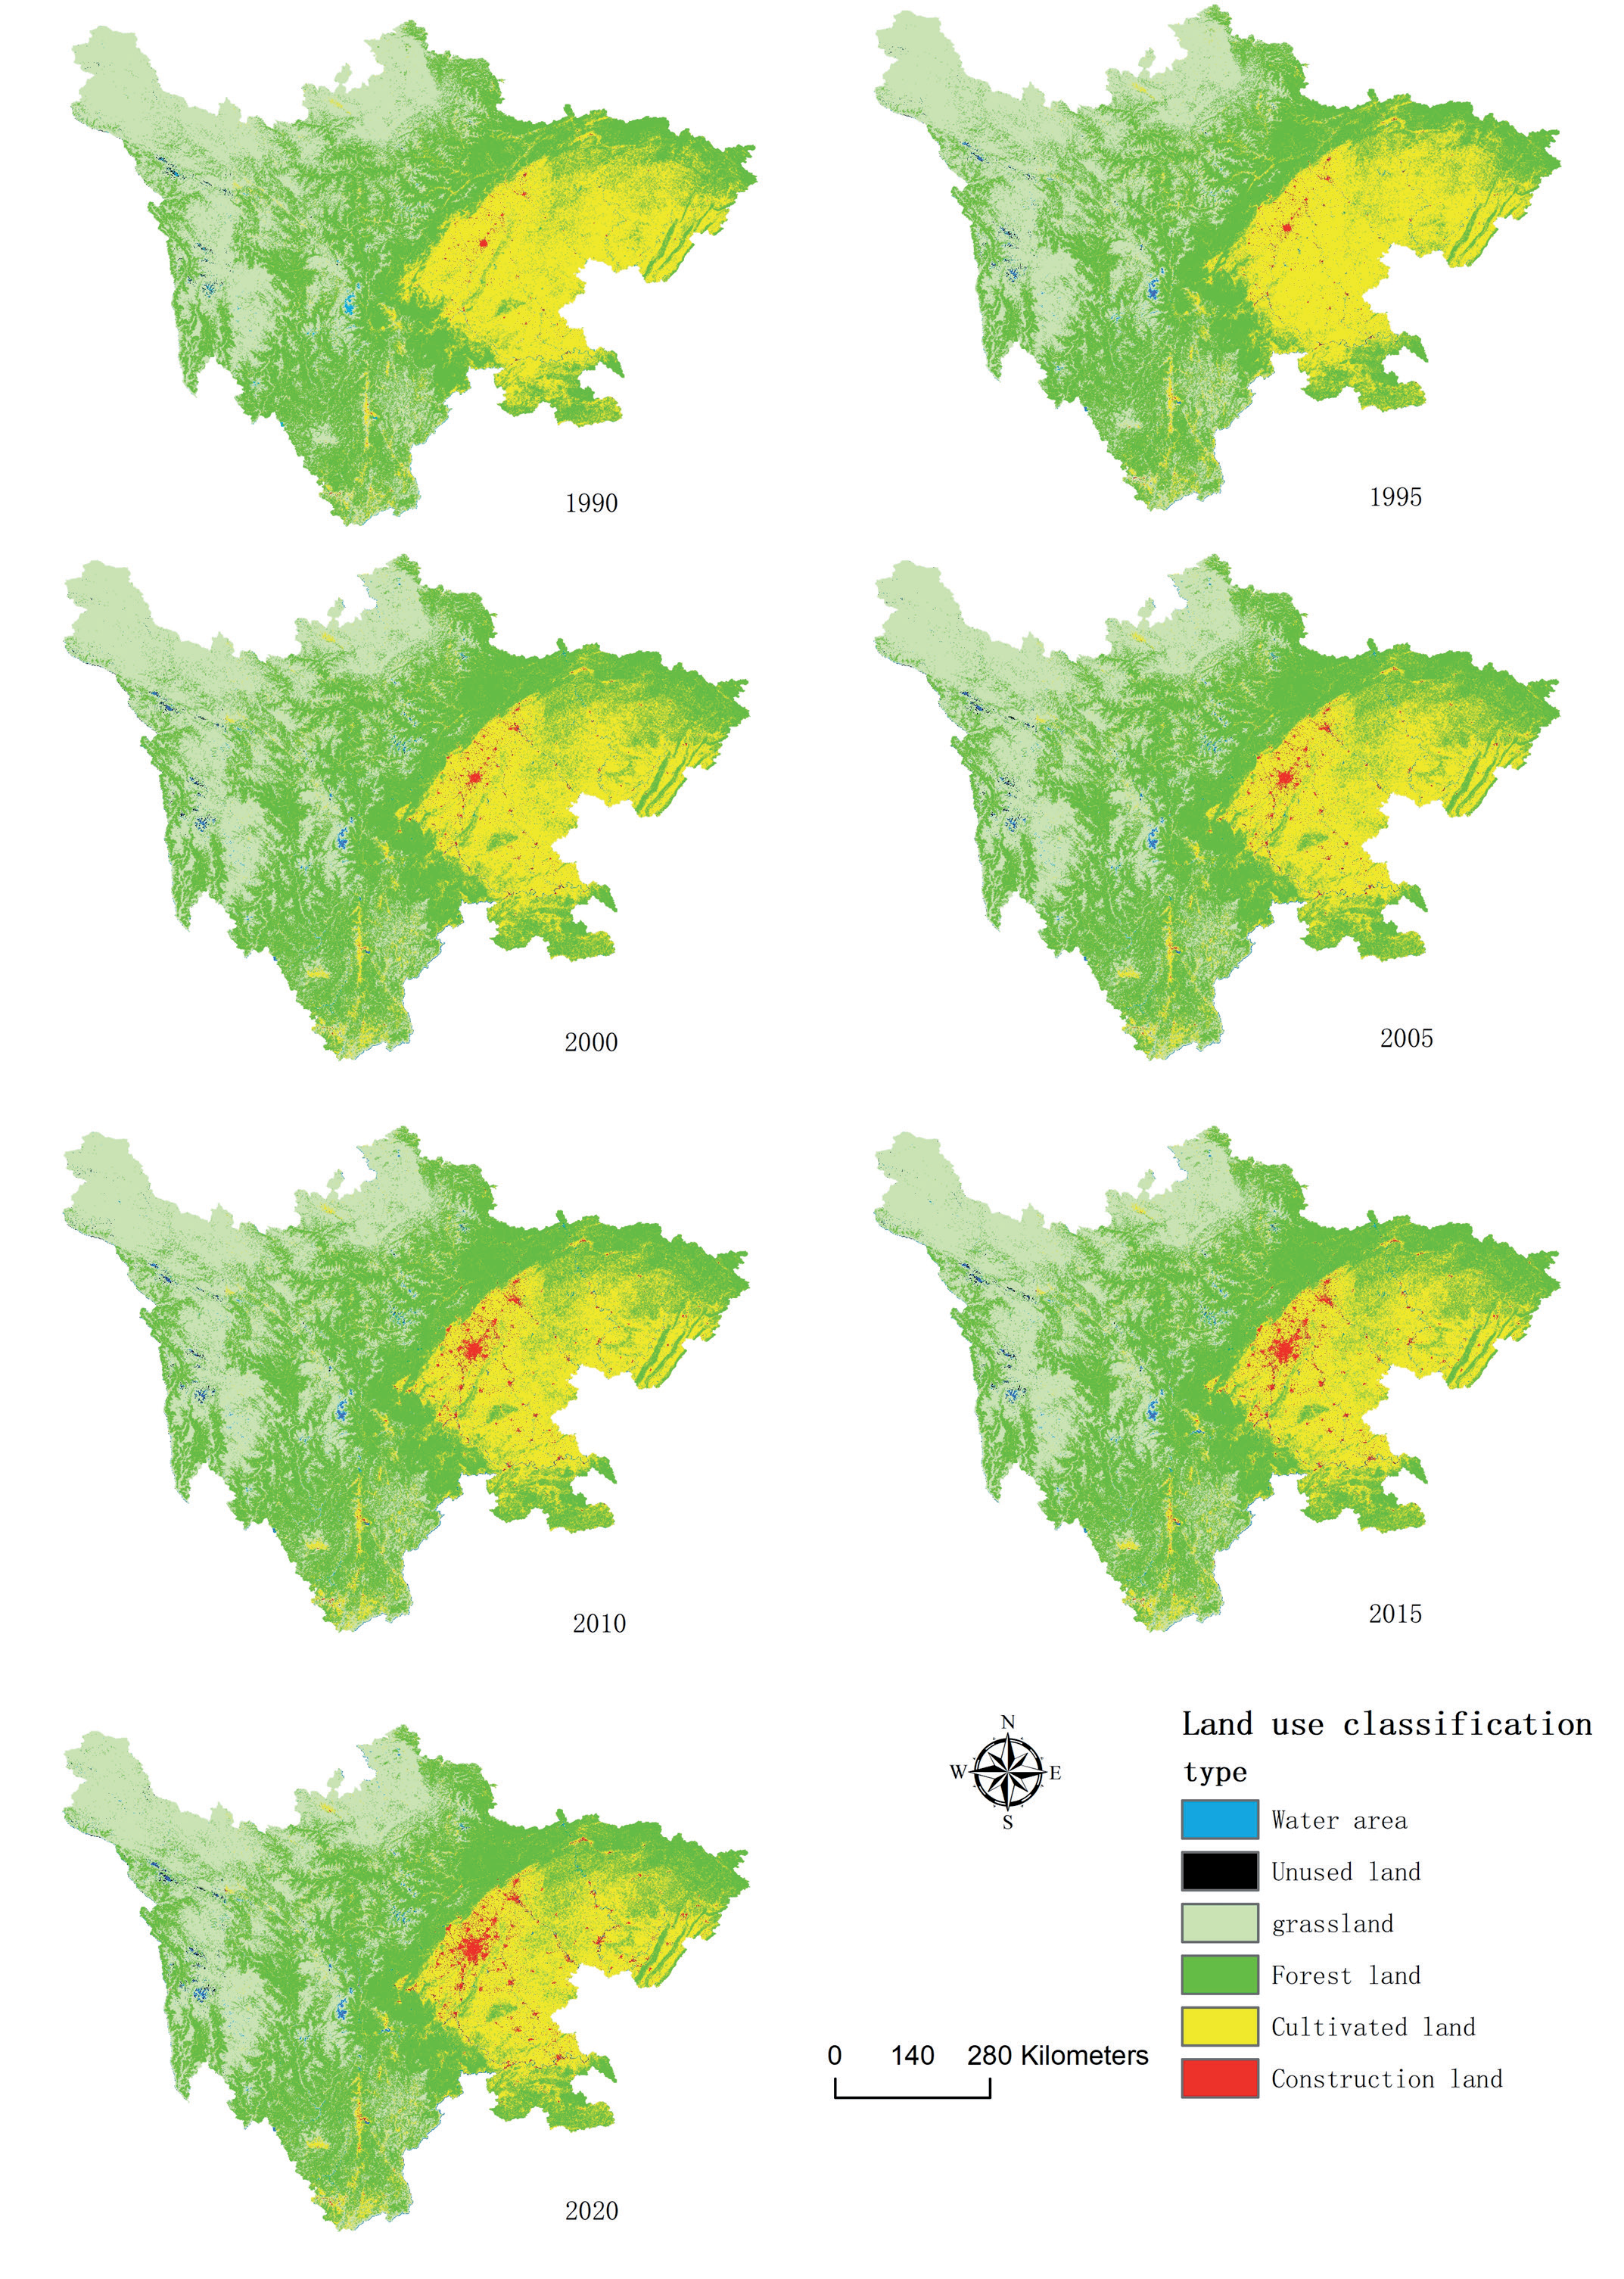
The spatial distribution of land types in Sichuan Province is shown in the Fig. 4. Cultivated land is extensively distributed in Sichuan Basin. Forest land is primarily concentrated in the borders of Sichuan Basin and Qinghai-Tibet Plateau, Hengduan Mountains, Yunnan-Guizhou Plateau and Qinling Mountains. Grassland is mainly concentrated in the high mountain plateau area in western Sichuan and the hilly plateau mountain area in northwest Sichuan. Chengdu Plain and its surrounding areas are concentrated areas of construction land. Unused land is widely distributed in the high mountains and plateaus of western Sichuan. The water area is distributed in different areas of Sichuan Province (Fig. 4).
The land use area of Sichuan Province is mainly composed of cultivated land, woodland and grassland, of which woodland area is the largest and grassland area is the smallest. Over the past 30 years, construction land and water area are steadily increasing, while the cultivated land area is gradually decreasing. The area of forest land fluctuated, but showed an increasing trend on the whole, and the unused land was consistent with it. On the contrary, grassland overall showed a downward trend (Table 5).
Table 5.
Land use area and its change in Sichuan Province from 1990 to 2020 (Unit:km2).
From the perspective of the overall time span from 1990 to 2020, the area of cultivated land reached its maximum in 1990, the area of grassland reached its maximum in 1995, and the area of other types reached its maximum in 2020. The most significant period of land type area change was 1995-2000, mainly due to the fact that Sichuan became a pilot area for converting farmland to forest in 1999, and urbanization and industrialization of Sichuan are accelerated due to the western development strategy. From 1990 to 2020, the area of cultivated land and grassland decreased by 17,155.77 km² and 7,463.38 km², while the area of forest and construction land increased by 16,781.85 km² and 6,322.57 km² (Table 5).
Land Use Carbon Emission Calculation
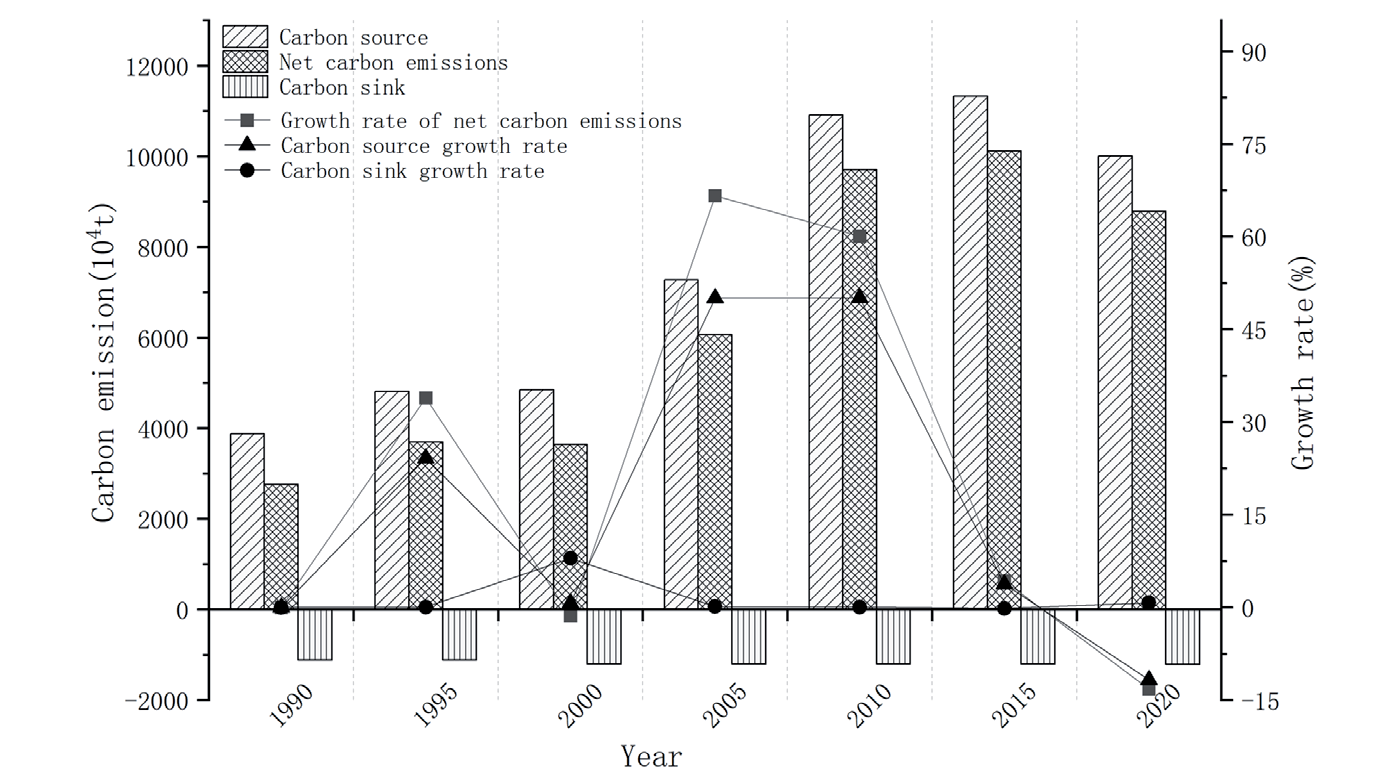
Since Chongqing area was part of Sichuan Province before 1997, the carbon emissions of Chongqing should be excluded from the calculation of carbon emissions for 1990 and 1995, based on the boundaries of the existing Sichuan administrative region. From 1990 to 2020, the net carbon emission of Sichuan Province increased from 27563.9 ten thousand tons to 87852.6 ten thousand tons, with a growth rate of 218.7%. The growth rates of carbon emissions in the six periods were 33.91%, -1.41%, 66.62%, 60.06%, 4.29% and -13.20% (Table 6, Fig. 5).
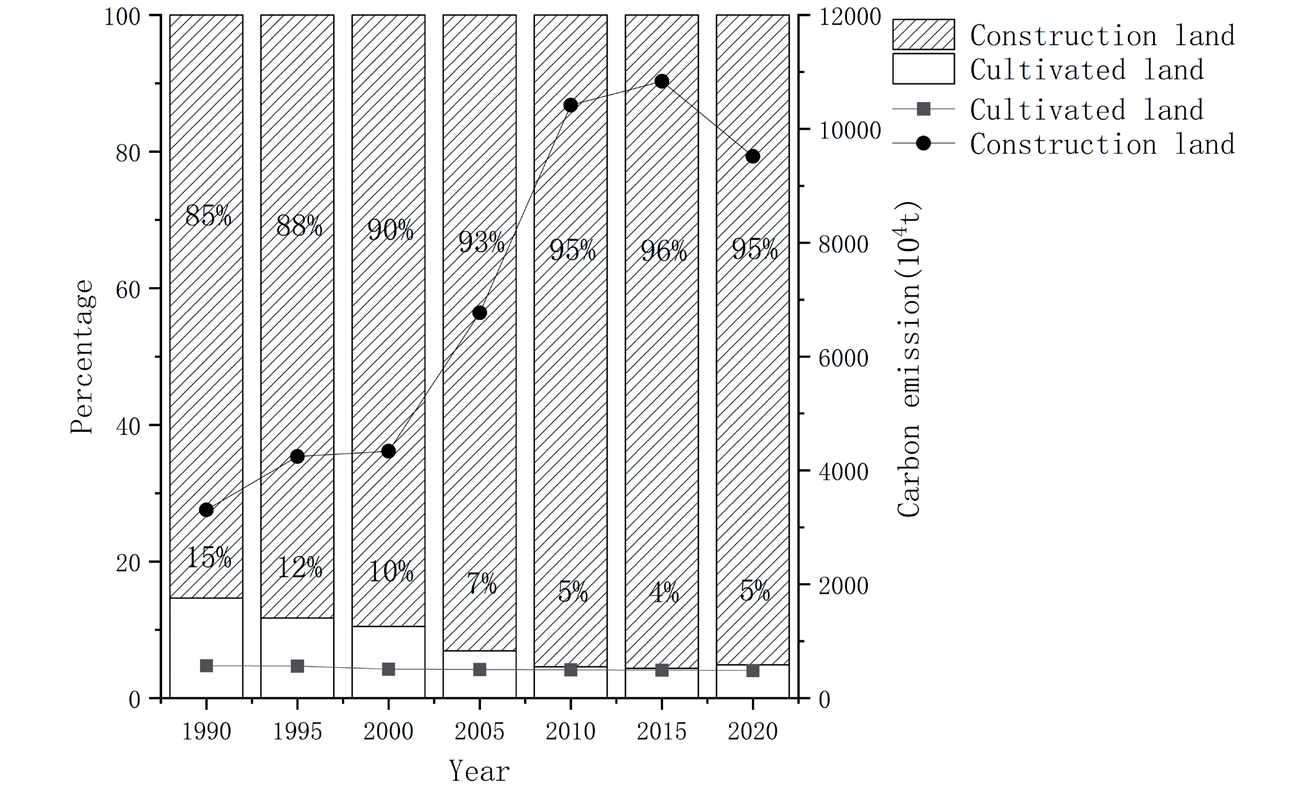
Cultivated land and construction land are the two primary sources of carbon emissions. However, the quantity of emissions from cultivated land was significantly lower compared to construction land. In 1990, the difference in carbon emissions between the two sources was the smallest, with construction land emitting six times more carbon than cultivated land. By 2015, this difference had increased significantly, with construction land emitting 22.5 times more carbon than cultivated land. From 1990 to 2020, the proportion of carbon emissions from construction land gradually increased to 85%, 88%, 90%, 93%, 95%, 96%, and 95%, respectively. This change in carbon emissions can be attributed to the significant reduction in cultivated land and the accelerated processes of urbanization and industrialization. (Fig. 6).
Woodland, grassland, unused land, and water are significant carbon sinks in ecosystems. Among these land types, woodland has the highest capacity for carbon sequestration, followed by grassland, water, and unused land. In 1990, forest land was the primary contributor to carbon sinks, accounting for 96.1% of the total, and this proportion increased steadily over the years. However, the contribution decreased in 2020. Over the past 30 years, the ratios of carbon emissions for forest land and construction land were 1:3.2, 1:4.1, 1:3.8, 1:5.9, 1:9.0, 1:9.4, and 1:8.2, respectively. The gap between the two had reached its widest point in 2015.
Analysis of Influencing Factors of Carbon Emission
The contribution of influencing factors to the change of carbon emissions in Sichuan Province from 1990 to 2020 was shown in the table (Table 7, Table 8).
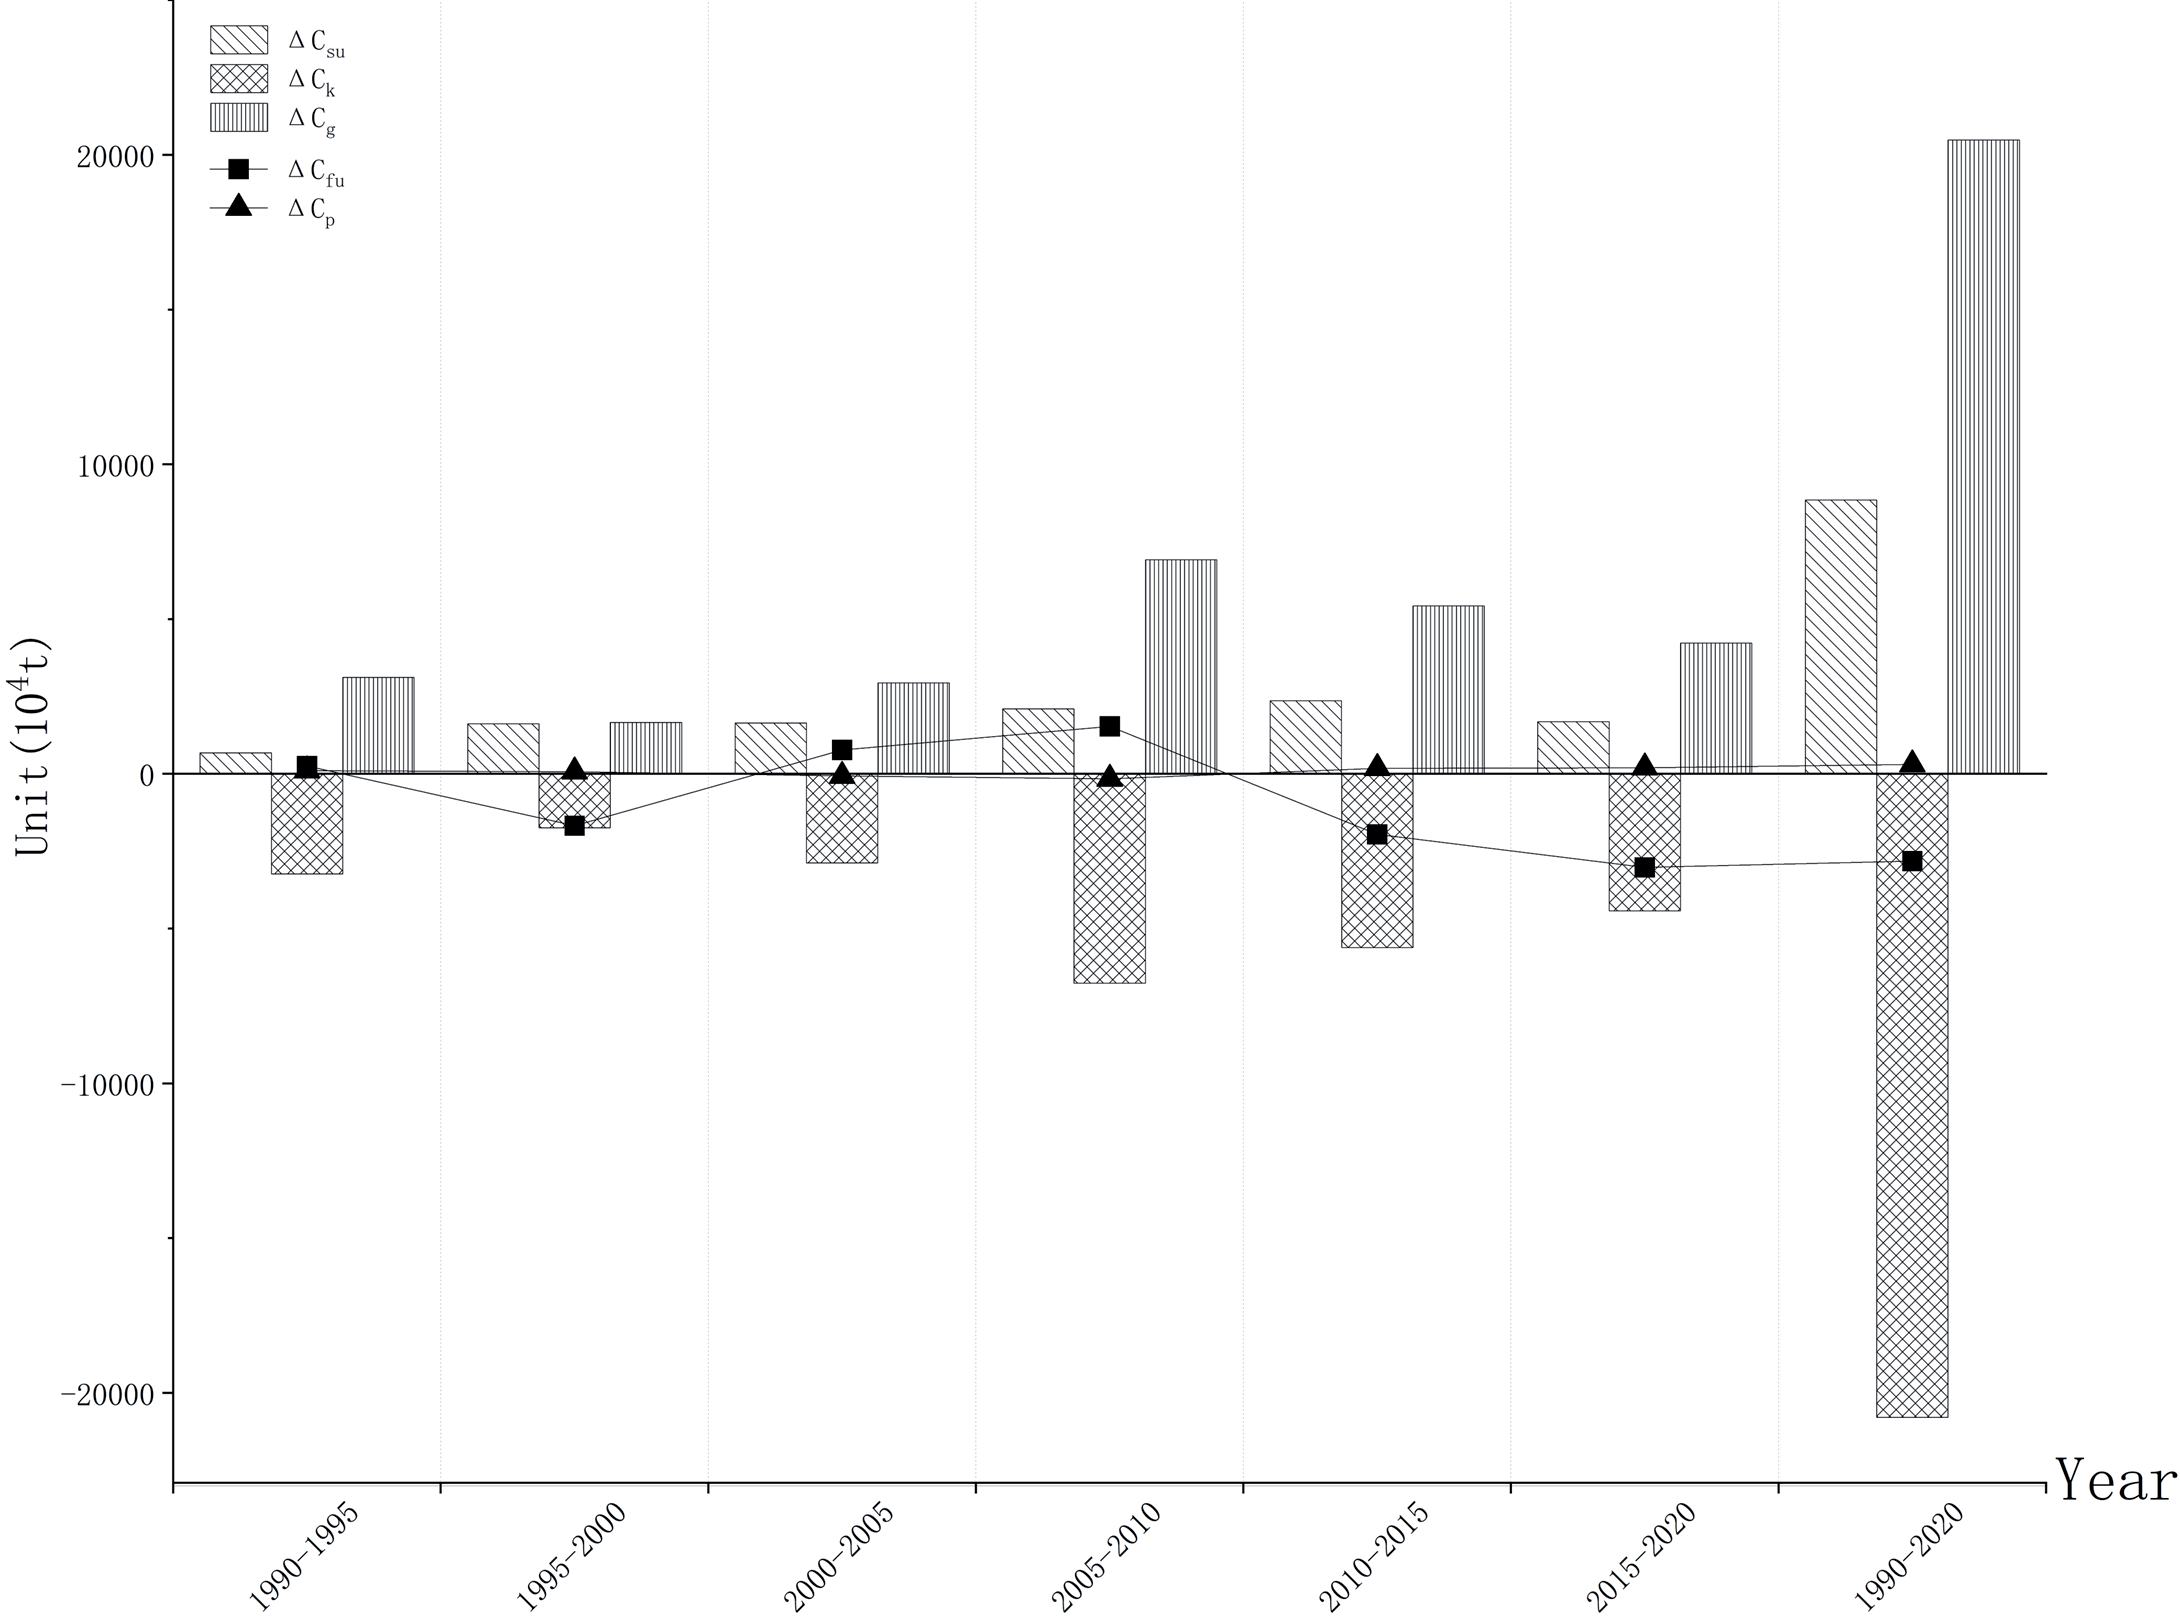
In terms of carbon emissions in each period, LUS and PCG promoted emissions growth, while LUIPUG inhibited emissions growth. The effects of CEIPUL and PS on carbon emissions increases varied in different years. From 1990 to 2020, PCG significantly increased carbon emissions, followed by LUS and PS. LUIPUG played a significant role in reducing carbon emissions, followed by CEIPUL (Fig. 7).
Table 6.
Carbon emissions from land use from 1990 to 2020 (Unit: ten thousand tons).
For carbon emission, the contribution value of PCG was a decreasing - increasing - decreasing process. The contribution value of PCG was the minimum during 1995-2000, the maximum during 2005-2010, and the fastest growth during 2000-2010.The contribution value of PCG was consistent with the change of contribution rate (Fig. 8).
The contribution value of LUS increased from 1990 to 2015, and decreased from 2015 to 2020. The contribution value of LUS was the smallest during 1990-1995, and the largest during 2010-2015. The contribution rate of LUS was the largest from 1995 to 2000, and decreased gradually from 2000 to 2020 (Fig. 8).
The contribution of PS to carbon emission was positive during 1990-2000 and 2010-2020, and negative during 2000-2010. The contribution value of PS was consistent with the change of contribution rate. The effect of PS on carbon emissions was small, between 0% and 1% (Fig. 8, Table 9).
Table 7.
Contribution value of net carbon emissions in Sichuan Province from 1990 to 2020 (Unit: ten thousand tons).
Table 8.
Contribution rate of net carbon emissions in Sichuan Province from 1990 to 2020.
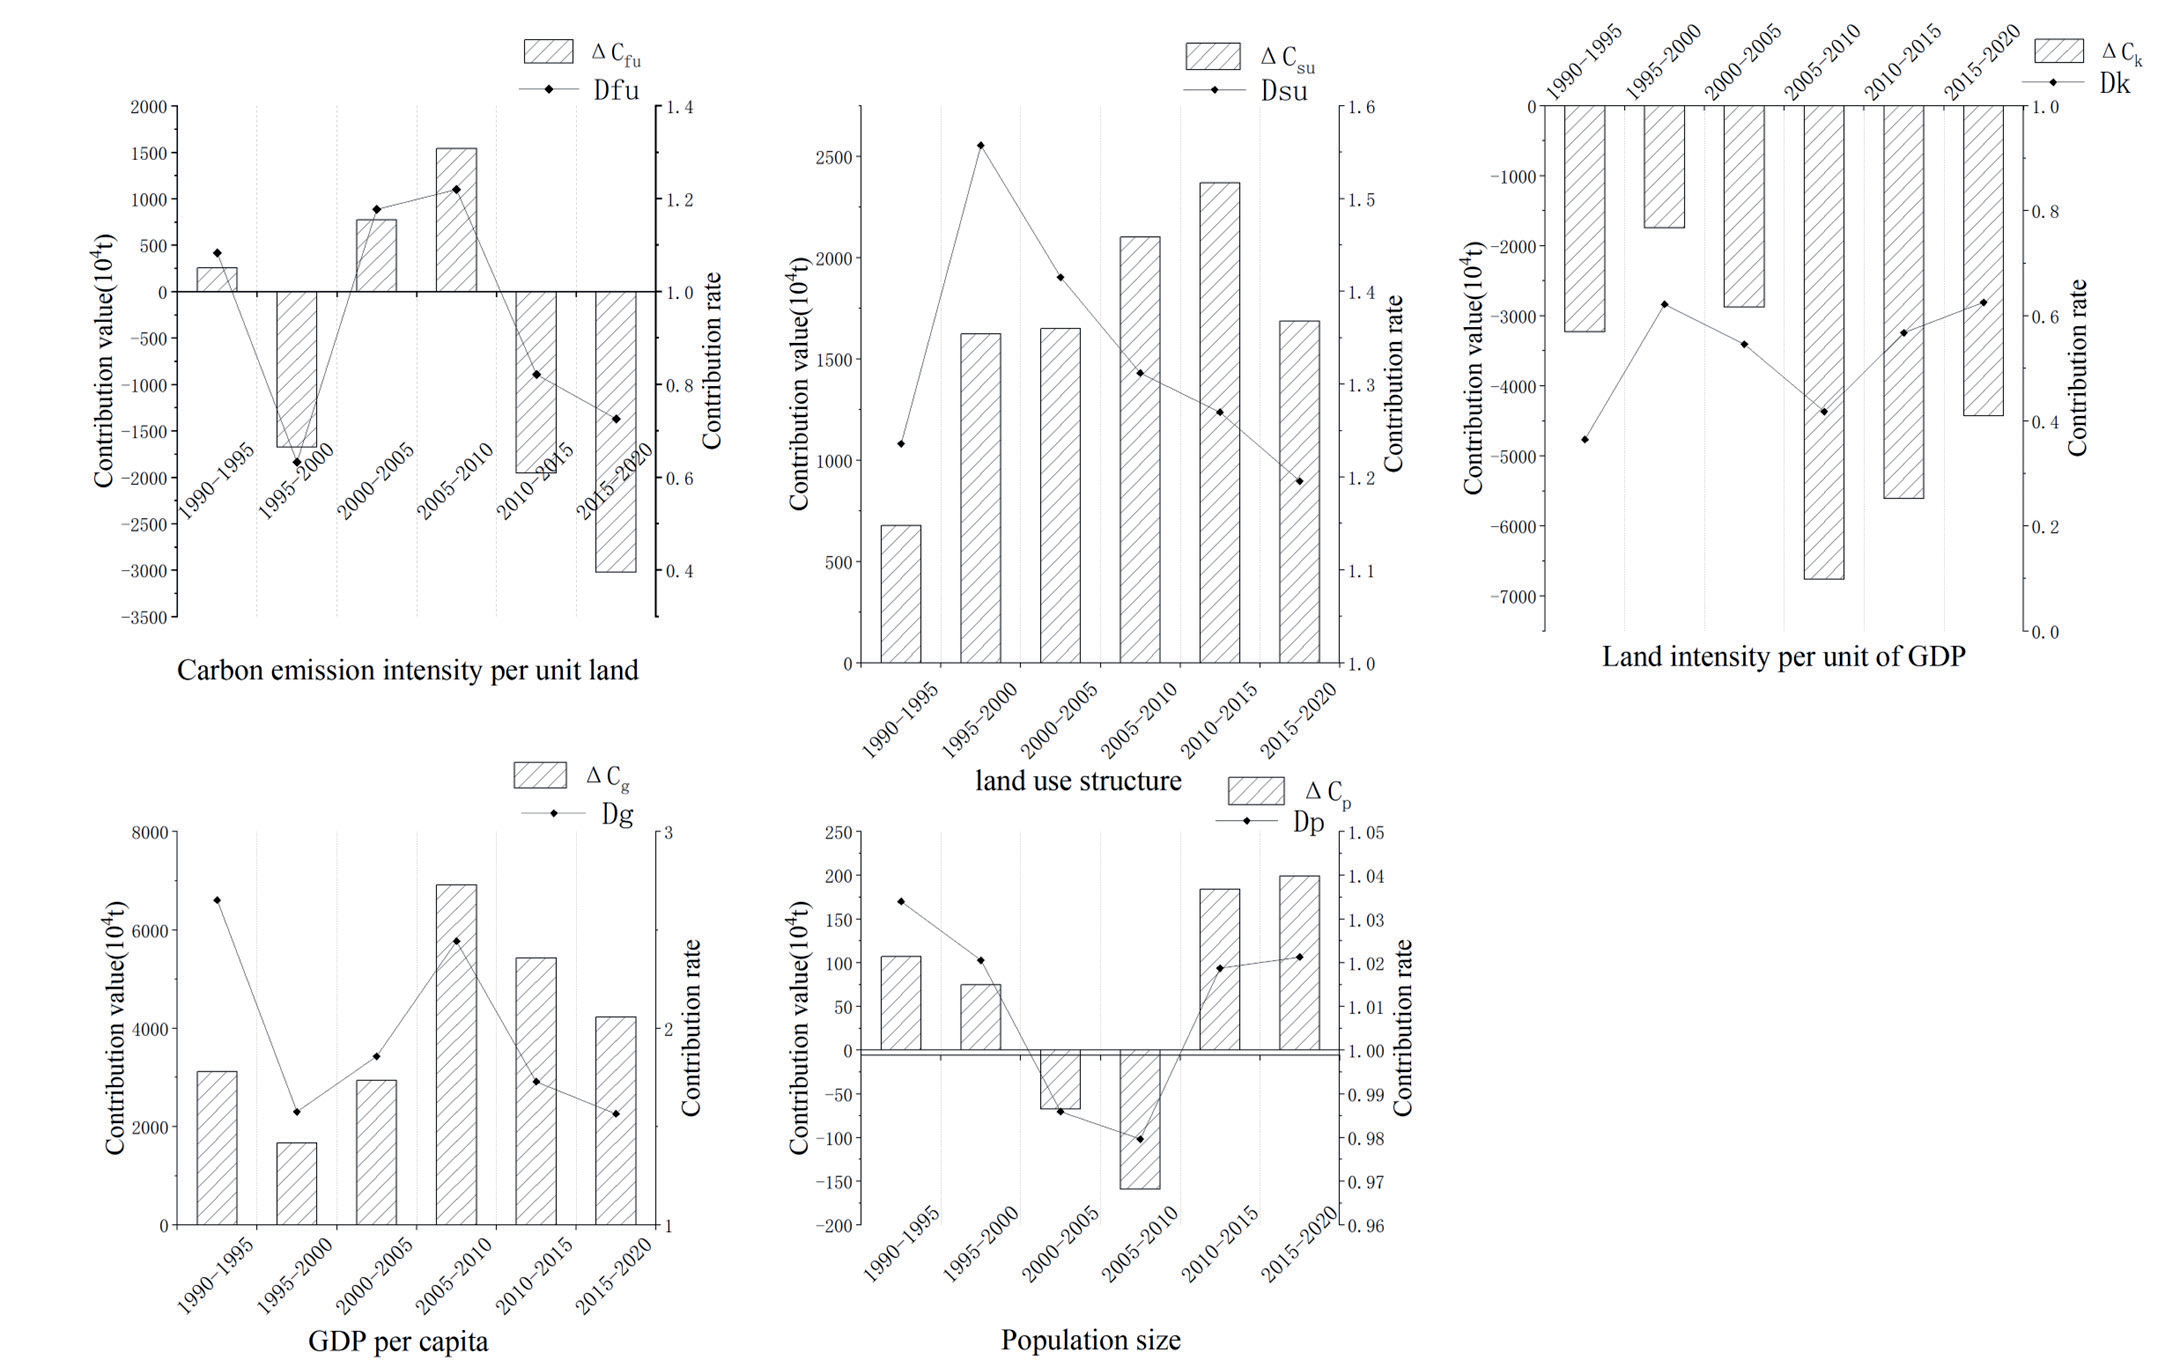
Table 9.
Percentage of contribution value of five influencing factors to carbon emission change.
| Year | ΔCfu | ΔCsu | ΔCk | ΔCg | ΔCp |
|---|---|---|---|---|---|
| 1990-1995 | 3% | 9% | -44% | 42% | 1% |
| 1995-2000 | -25% | 24% | -26% | 25% | 1% |
| 2000-2005 | 9% | 20% | -35% | 35% | -1% |
| 2005-2010 | 9% | 12% | -39% | 40% | -1% |
| 2010-2015 | -13% | 15% | -36% | 35% | 1% |
| 2015-2020 | -22% | 12% | -33% | 31% | 1% |
| 1990-2020 | -5% | 17% | -39% | 38% | 1% |
The inhibition intensity of LUIPUG on carbon emissions was a process of decreasing – increasing – decreasing. The inhibition intensity of LUIPUG on carbon emissions was the smallest during 1995-2000, and the largest during 2005-2010. The contribution value of LUIPUG was in line with the contribution rate (Fig. 8).
The contributions of CEIPUL to carbon emission was positive during 1990-1995 and 2000-2010, and negative during 1995-2000 and 2010-2020. The promoting effect of CEIPUL on carbon emission was the largest during 2005-2010, while the inhibiting effect was the largest during 2015-2020. The inhibition effect of CEIPUL on carbon emission was smaller than that of LUIPUG during 1995-2000 and 2010-2020. The contribution value of CEIPUL was consistent with the contribution rate (Fig. 8).
Analysis on Decoupling State of Carbon Emission in Sichuan Province
The development of Sichuan Province has experienced a process from WD-SD-EC-WD-WD-SD. From the perspective of 30 years, the overall state was WD (Table 10, Fig. 9). During 2000-2005, the elastic decoupling index of Sichuan Province was the maximum, and it was in the state of EC, with the greatest pressure on the environment. The elastic decoupling index decreased by nearly 0.4 relative to the 2000-2005 periods in the 2005-2010 period, and it also decreased by nearly 0.4 relative to the 2005-2010 period in the 2010-2015 periods. This result indicates that Sichuan Province began to pay attention to the impact of environment during 2005-2015, and the pressure of environment on economic development decreased. Sichuan Province achieved strong decoupling between 2015 and 2020, and the interaction between the economy and the environment gradually decreased, indicating that economic development no longer puts pressure on the environment.
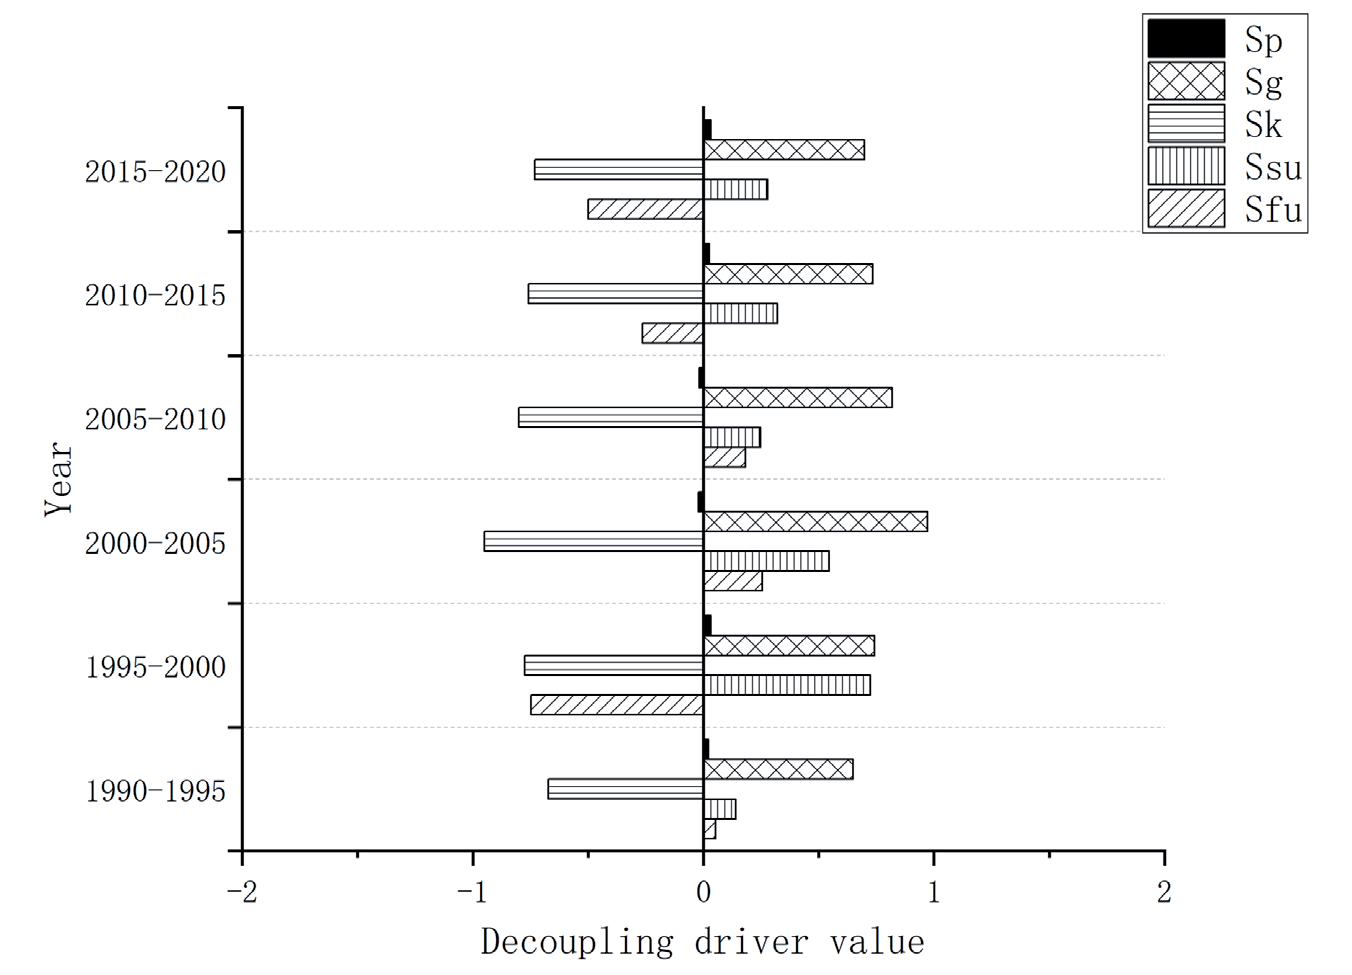
In each period from 1990 to 2020, LUS and PCG continue to promote the growth of the decoupling elasticity index, while LUIPUG always inhibits the growth of the decoupling elasticity index. The contribution value of PCG to the decoupling elasticity index showed a trend of first increasing and then decreasing, reaching the maximum during 2000- 2005. The contribution value of LUS to the decoupling elasticity index showed an increasing - decreasing - increasing - decreasing trend, and the increase was the largest from 1990 to 2000.The variation trend of the contribution value of LUIPUG to the decoupling elasticity index was consistent with that of the contribution value of PCG to the decoupling elasticity index (Table 11, Fig. 10).
In the period of 1990-1995, 2000-2005, and 2005- 2010, CEIPUL played a role in promoting the increase of the decoupling elasticity index. However, it inhibited the increase during the periods of 1995-2000 and 2010-2020. Over the span of 30 years, from 1990 to 2020, LUIPUG and PCG were identified as the main factors influencing the decoupling elasticity index. The contribution values of these factors changed to a similar extent. Comparatively, CEIPUL had a lesser inhibitory effect on the decoupling elasticity index compared to LUIPUG. This can be attributed to the fluctuation of CEIPUL’s contribution value, which was not as stable as that of LUIPUG, during the four periods from 1990 to 2010. Additionally, the contribution of PS to the decoupling elasticity index was minimal, consistently close to zero.
Table 10.
The decoupling status of the six periods from 1990 to 2020.
| Year | %ΔC | %ΔGDP | T | Decoupling condition |
|---|---|---|---|---|
| 1990-1995 | 0.34 | 1.74 | 0.19 | WD |
| 1995-2000 | -0.01 | 0.61 | -0.02 | SD |
| 2000-2005 | 0.67 | 0.83 | 0.80 | EC |
| 2005-2010 | 0.60 | 1.39 | 0.43 | WD |
| 2010-2015 | 0.04 | 0.76 | 0.06 | WD |
| 2015-2020 | -0.13 | 0.60 | -0.22 | SD |
| 1990-2020 | 2.19 | 53.44 | 0.04 | WD |
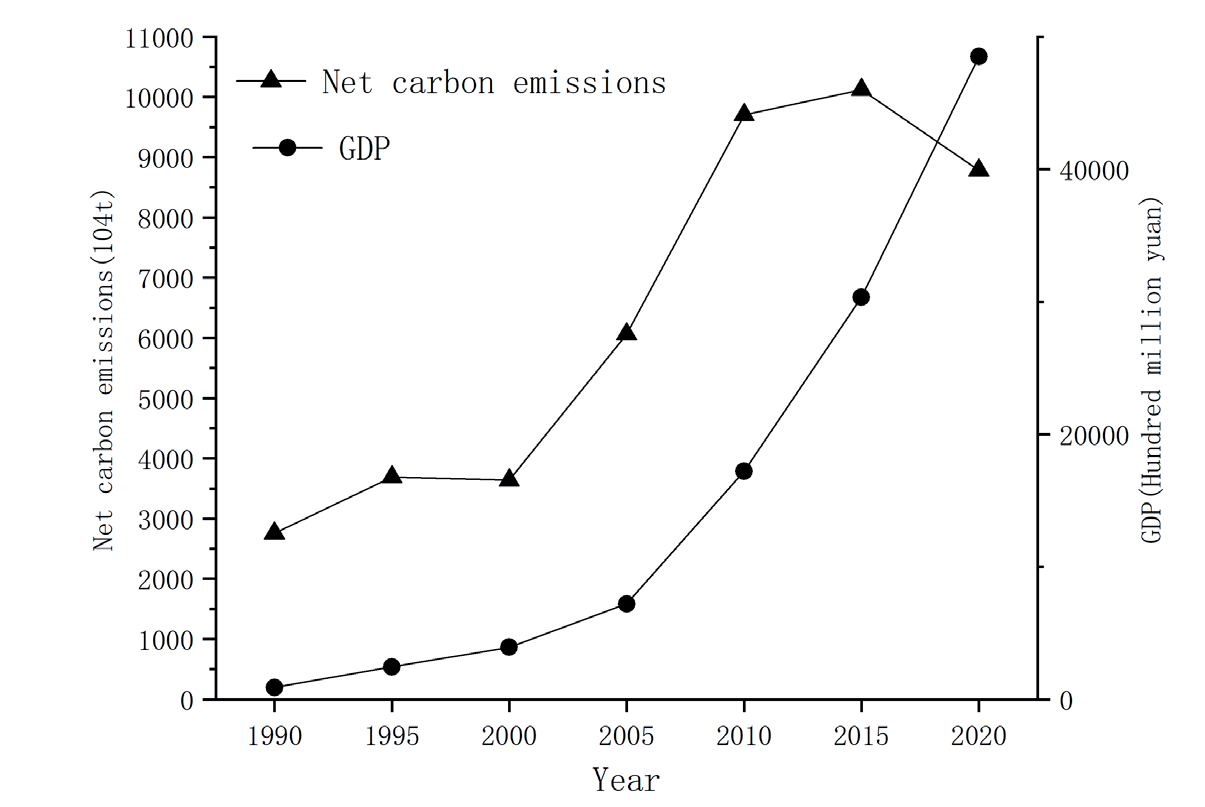
Table 11.
The contribution value of factors influencing the decoupling elasticity index.
Conclusions and Recommendations
Conclusions
The main conclusions of this paper are as follows:
(1) During the 30 years from 1990 to 2020, the area of forest land, construction land, unused land and water area in Sichuan increased by 16,781.8444 km2, 6,322.56686 km2, 272.297341 km2 and 1242.44854 km2, respectively. The cultivated land area and grassland area were reduced by 17,155.766 km2 and 7,463.38596 km2 respectively.
(2) The total carbon emissions of Sichuan Province in the past 30 years showed an upward trend (excluding Chongqing area). In 1990, the carbon emission was 2756.39×104t, and in 2020, the carbon emission increased to 8785.26×104t, with a growth rate of 218.7%.
(3) From the perspective of 30 years, LUS, PCG and PS have a promoting effect on the carbon emission growth in Sichuan Province, among which the PCG has the largest promoting effect, followed by LUS and PS. On the other hand, CEIPUL and LUIPUG have inhibitory effects on carbon emission growth in Sichuan Province. LUIPUG has the largest inhibitory effect, followed by CEIPUL. These results indicate that in future carbon emission reduction strategies, Sichuan Province should focus on optimizing LUS and improving the efficiency of LUIPUG to restrain the growth of carbon emissions.
(4) From the perspective of 30 years, Sichuan Province was in a state of WD. From the perspective of different periods of time, Sichuan Province was SD from 1995 to 2000, EC from 2015 to 2020, and WD in other periods. LUS, PCG and PS have a positive effect on the elasticity index of decoupling, and the contribution of PCG was greater than the contributions of LUS and PS. CEIPUL and LUIPUG have inhibitory effects on decoupling elasticity index, and the contribution of LUIPUG was greater than CEIPUL.
Recommendations
Based on the above research conclusions, how to develop green economy and enter low-carbon society in Sichuan Province is discussed.
(1) Optimize the land use structure, strengthen land spatial planning and control, and establish a land spatial protection pattern conducive to carbon peak and carbon neutrality. At the same time, the work of returning farmland to forest and grassland should continue. Land use planning should be strictly implemented so that the necessary amount of arable land can be maintained. The density and intensity of urban development and construction should be controlled to prevent excessive growth of new construction land. In addition, measures should be taken to improve the structure of land use and improve the efficiency of land use in order to achieve the purpose of mitigating climate change.
(2) In the process of formulating industrial policies, the following points should be considered: 1) Optimize the industrial structure. Policies should encourage priority development of green manufacturing and cleaner production in order to promote the realization of energy conservation and emission reduction targets.
2) Improving the consumption structure. Gradually reduce the dependence on fossil energy and coal, take measures to promote the use of clean energy, and accelerate the construction of a green modern energy system.
(3) Take measures to ensure the effective operation of the carbon emission trading market and guide enterprises to actively participate in carbon emission trading. Raise the environmental awareness of enterprises and the masses, so that economic development will not be at the expense of the ecological environment.

