

Introduction
Water is a fundamental substance for living beings and a crucial industrial raw material. Nevertheless, industrial development has caused numerous pollutions in water that are frequently dangerous for the proper function of living organisms and harmful for human health [1].
Due to the deficiency of industrial separation processes for desired substances, highly valuable compounds are common in waste water and industrial sewage. Examples of such compounds are α-hydroxycarboxylic acids (AHA) which can be glycolic or lactic. Although AHA is not a significant threat, these are still valuable resources, for example, in the manufacture of biobased plastics such as PLA or PGA [2], cosmetics [3, 4], or active pharmaceutical ingredients [5]. Glycolic acid has found common applications in the leather [6] and textile [7] industries and in the role of component of paints, lacquers, adhesives, and other materials [8]. Moreover, copolymers, such as polylactic-co-glycolic acid have found great significance in biomedical applications [9-11].
Glycolic acid is produced industrially by many routes, among others such as hydrolysis of chloroacetic acid in the presence of sodium hydroxide [12], hydrolysis of glycolonitrile in the presence of sulfuric acid or enzymes [13, 14], separation from fermentation broth [15] and biomass processing as alternatives [16, 17]. Glycolic acid can also be a byproduct of synthesis, as in cases of the production of herbicides such as 4-chloro-2-methylphenoxyacetic acid, where it remains in saline waste water (up to 2% by weight) [18, 19].
In the mentioned methods, the deep recovery and efficient enrichment of glycolic acid from aqueous solutions play a crucial role, which is significantly demanding in industrial conditions due to the high affinity of glycolic acid to water and the potential to polymerize in concentrated and heated solutions. Methods and different combinations applied to separating glycolic acid from solutions include membrane separation and crystallization [20], vacuum distillation, or reactive distillation [21] of glycolate esters [22, 23] or reactive liquid-liquid extraction [13], [24]. It is worth it to mention that adsorption methods involving natural-based adsorbents such as grape leaf residues [25, 26], bagasse fly ash, and natural clays [27, 28] or in addition, aluminum oxide [29] and synthetic adsorption resins [30]. Some studies were performed by applying ion-exchange resins, e.g., Amberlite IRA-67 for separation and the described above AHAs [31-33].
The aim of present studies is to define the basic parameters of glycolic acid adsorption (ion-exchange) processes with the use of anionites Purolite A103S and A1496, determining breakthrough curves of ion-exchange adsorption and detail the effects of salinization of glycolic acid aqueous solutions during the process. Those types of ion exchange resins have been chosen based on literature studies showing the best capabilities and effectiveness for removing small organic acids (e.g. glycolic, lactic, formic, and acrylic acids) from aqueous solutions by ion exchange.
Experimental
Materials
Glycolic acid 99% and sodium chloride 99% were purchased from Merck Co. Anionite A1496 and act as a weak base, macroporous, polystyrenic ion-exchange resin in the form of a free base of an amine complex. Anionite A103S is a weak base, macroporous, polystyrenic ion-exchange resin in the form of a free base of tertiary amine. Both ionites were obtained from the Purolite Company.
Equilibrium Studies
Solutions with different concentrations of acid were prepared for adsorption equilibrium studies. Concentrations were accordingly 1%, 2%, 4%, 6%, 8%, 10%, and 12% by weight percentage (Table 1). Mixtures of 100mL of solutions and 1g of resin were prepared and poured into thermostated shakers. Tests were performed at three different temperatures (293K, 303K, and 313K) for the sake of examining the impact of temperature on the adsorption process and defining values of changes in enthalpy, entropy, and free Gibbs enthalpy. Experimental tests were performed on prepared samples and on real environmental samples as well. Results from environmental samples are the property of the contracting company, and there is no possibility of sharing them in any article.
Concentrations up to 12% have practical justification. Aforementioned examples of technologies related to aqueous solutions of glycolic acid, such as MCPA technology (up to 3% for proper reaction, possibly more during some problems with production process), biotechnological route of glycolic acid synthesis in listed literature mentions about 6.5% of glycolic acid in fermentation broth, and removal of glycolic acid by extraction from glyconitrile hydrolysate was performed even in a little higher concentrations than 12%. After all, higher concentrations give the possibility of a wider range of applications for this research, especially for preconcentrated solutions on ionites, membranes, or in other ways. From a scientific point of view, it allows to predict the point of saturation of the ionite bed, which occurs, e.g., for A1496 at 303K and 298K at concentrations over 10% and disturbances of equilibrium at higher concentrations, as for A103S. Concentrations below 1% in practical work can be predicted by extrapolation to x = 0%, y = 0 g/100g due to Henry’s law, which is widely applied for the design of mass transfer operations in industry.
The economical usefulness analysis of the removal of highly concentrated glycolic acid by ion exchange is not the aim of this article and depends on many variables like the regeneration of the anionite bed, other ingredients of the solution, the durability of the resin and many others. For very low concentrations, it can be one of the very few possible ways to capture glycolic acid remnants.
Effect of the Amount of Adsorbent
Studies of the effect of the amount of adsorbent were performed on a 5% acid solution at 293K. Suspensions of adsorbent and solution were prepared with 0,5-14,0g of ion-exchange resin and 100mL of solution, according to Table 2.
Effect of Salinization
Studies of the salinization effect were performed at 293K operating with solutions of 2% acid and 1%, 2%, 4%, 6%, 8%, 10%, and 12% by weight of sodium chloride in water. The amounts of solution and resin used were 100g and 1g respectively.
Analytical Methods
Mixtures after equilibration were filtered and titrated using a 0,1N KOH aqueous solution in the presence of phenolphthalein as an indicator to determine the concentration of glycolic acid. Amounts of sodium chloride were determined by titrating a 10% aqueous solution of silver nitrate in the presence of a 10% aqueous solution of potassium chromate as an indicator. Each value was calculated as an average of the minimum of three measured points, with differences lower than the standard deviation of this average. In this study, measuring glass class A was used with an analytical balance with an accuracy equal of 0,0005 g. Temperature measurements were performed using a mercury thermometer with an accuracy of 0,2ºC.
Adsorption Breakthrough Curve Studies
Studies of breakthrough curves were carried out in a fixed bed column. Column diameter and bed height were 42 mm and 70 mm respectively. The linear velocity of the fluid was 2∙10-6 m/min averaged, measured by the volume of the flown solution. During the flow of solution, samples were taken in equal amounts of the flowing liquid and analyzed according to the method mentioned.
Results and Discussion
Equilibrium Studies
The minimal time demanded to achieve equilibrium was determined for each concentration and temperature, which equaled less than 120 minutes. Tests of batch adsorption were performed in no less than 240 minutes time slots. The optimal amount of adsorbent for further studies was determined as 1g per 100mL of acid solution, based on the results of initial trials and equipment limitations. Initial trials show that 1g of resin allows for studies to be performed, avoiding stirring difficulties or even milling of grains, which was undesirable. The effect of initial glycolic acid concentration was studied for different temperatures, and Langmuir and Freundlich isotherms characteristics and thermodynamic parameters were calculated.
The equilibrium adsorption considered in this study was defined as follows:
Adsorption
Effect of Initial Acid Concentration
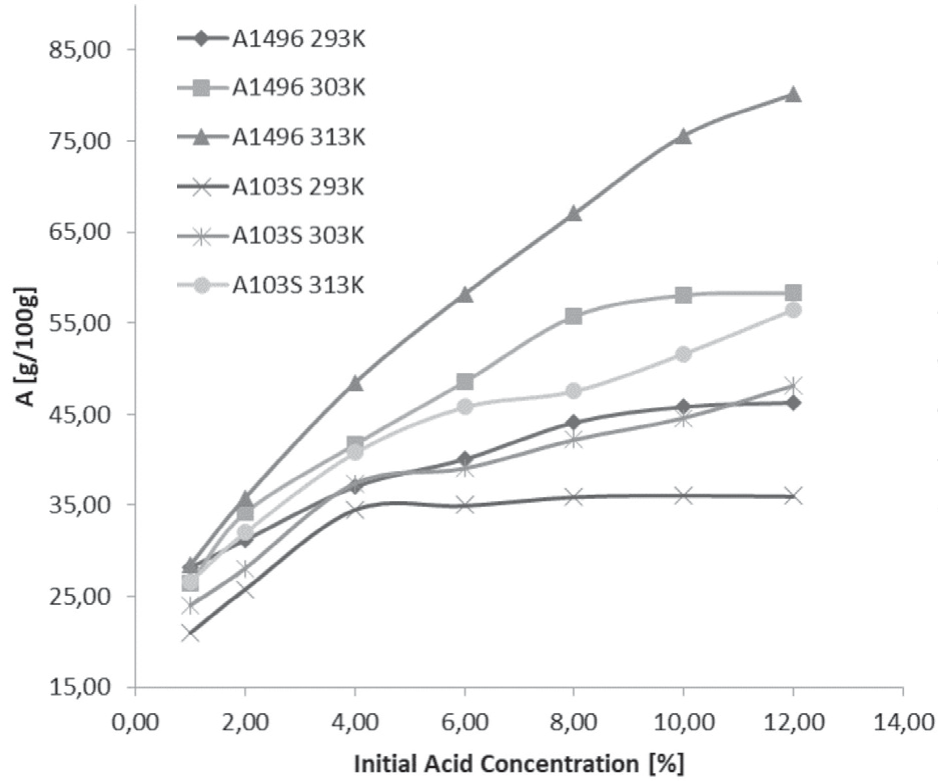
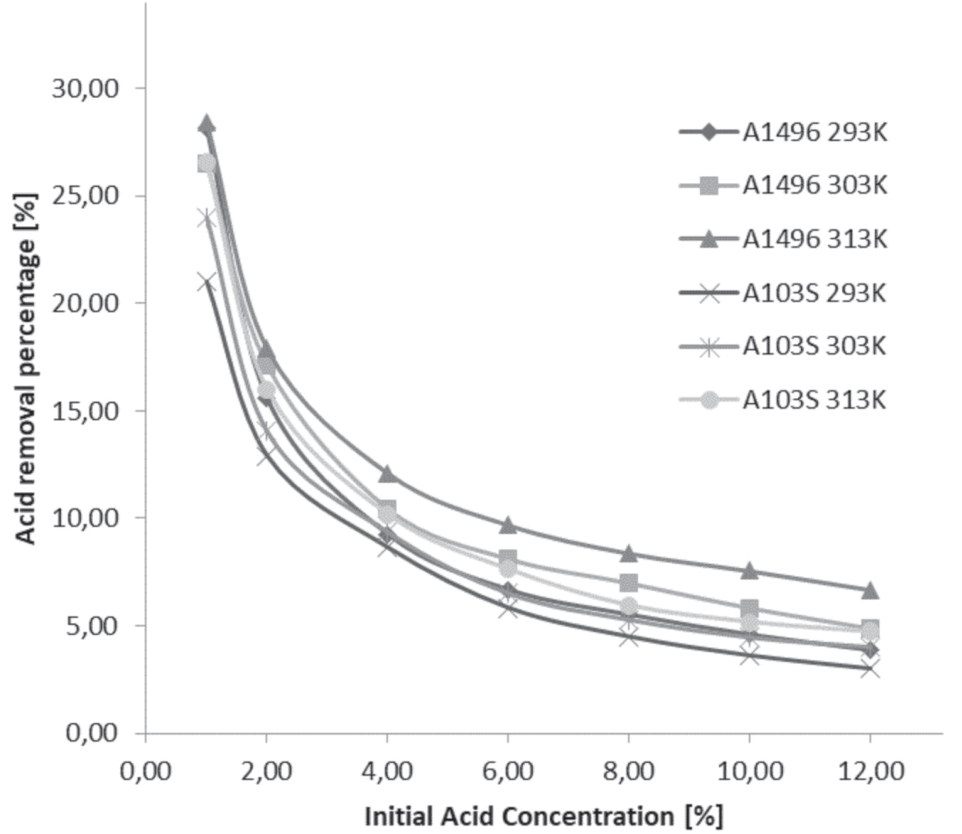
The effect of the initial acid concentration in an equilibrium state was studied for different initial concentrations. The results are listed in Table 1 and in Fig. 1. For both ion-exchange resins along with a growing initial concentration and rising temperature adsorption of glycolic acid increases, whereas the acid removal percentage related to the initial concentration decreases. An explanation for this phenomenon could be that limited adsorption capacity (surface concentration of active ion-exchange groups) and ion-exchange reaction equilibrium depended on temperature. The dependence of the acid removal percentage on the initial concentration is plotted in Fig. 2.
Effect of the Amount of Adsorbent
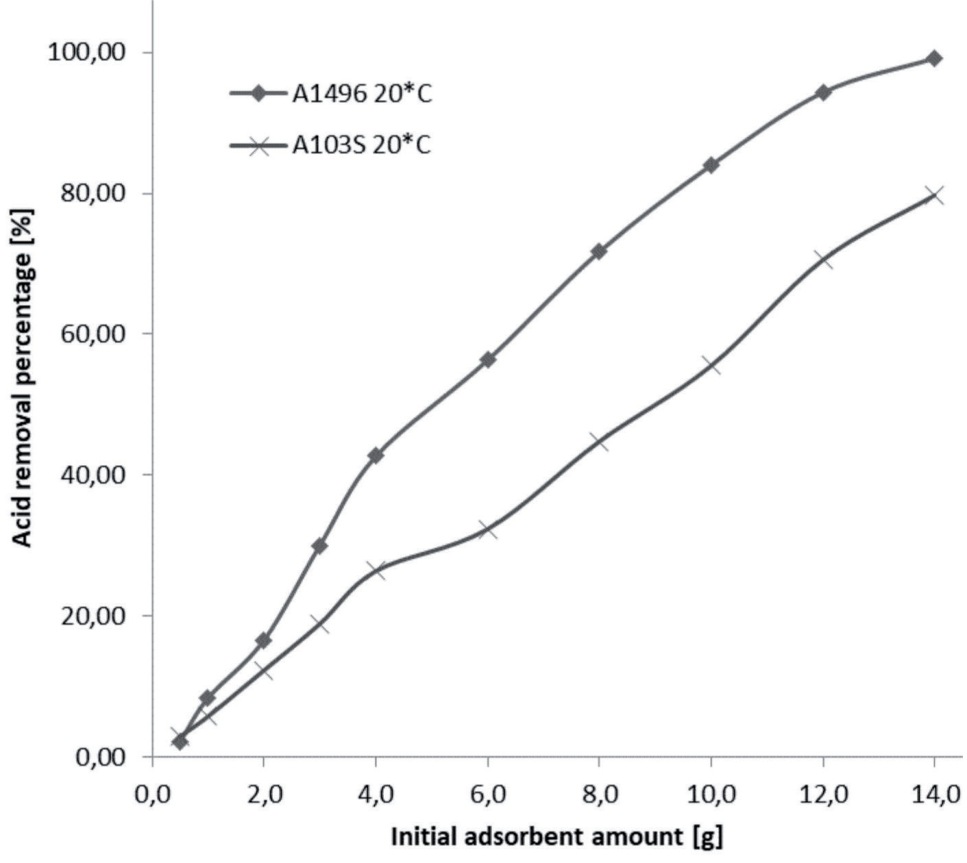
Studies considering the effect of the amount of the adsorbent on the efficiency of acid removal were performed. Along with the increasing amount of added adsorbent, the amount of removed glycolic acid increased. The local maximum of adsorption efficiency in relation to the amount of adsorbent was reached for 4g of A1496 resin. Application of 14g of A1496 anionite allows for the removal of >99,0% of glycolic acid dissolved in a 5% solution, whereas an equal amount of A103S resin reached 79,8% of acid removal. The results of the presented studies are shown in Table 2 and in Fig. 3.
Adsorption Isotherms
The Langmuir and Freundlich isotherms were studied to define the equilibrium characteristic of adsorption.
The Langmuir equation [34] is defined as follows:
where KL is a characteristic constant of the Langmuir equation and A0 describes the saturation capacity of the adsorbent according to the theoretical monolayer of adsorbate on the surface. The values of KL and A0 can be established by the linearization of equation to the following form:
The Freundlich equation [35] is determined as:
Hence constants KF and N can be found by the transformation of the equation to linear form as below:
Calculated values of constants for isotherm equations are listed in Table 3, whereas linear functions are presented in Figs 4-7 for each temperature.
Comparing the constants of Freundlich and Langmuir equations and R2 of correlations with literature about similar processes, it is possible to summarize them as follows:
For removal of formic acid: Freundlich KF = 16,5 N = 0,282 R2 = 0,9421; Langmuir KL = 8,67 Ao = 19,2, R2 = 0,994; it was performed on IRA-96 by H. Zeidan and M. Marti [36]. For removal of acrylic acid: Freundlich KF = 20,9, N = 0,68, R2 = 0,9862, Langmuir KL = 0,898 Ao = 43,5, R2 = 0,9872; it was performed on IRA-67 by I. Inci, I. Irem and N. Baylan [34]. For removal of glycolic acid: Freundlich (20ºC A1496) KF = 43,1 N = 0,19 R2 = 0,9858; Langmuir (20ºC A1496) KL = 16,0 Ao = 44,64, R2 = 0,8597; performed by M. Makula et al..
A comparison of the described values shows that other authors obtained similar orders and even values of constants (of course after recalculation for the same dimension of concentrations). Some lower values of R2 for Langmuir were explained in the article as caused by the greater inappropriateness of the Langmuir equation for describing the process under consideration (what is not very common for such processes but possible, and for that reason, researchers developed a great number of isotherm equation types with worse or better correlation to the real results of measurements, e.g., Tompkin’s, Hutting’s, Kisarov’s, Gibbs’s, Redlich’s, etc., or the mentioned linear Henry’s equation as the simplest. Hence, evaluated values were deemed acceptable and possible.
Table 1.
Results of effects of initial acid concentration studies.
Thermodynamic Studies
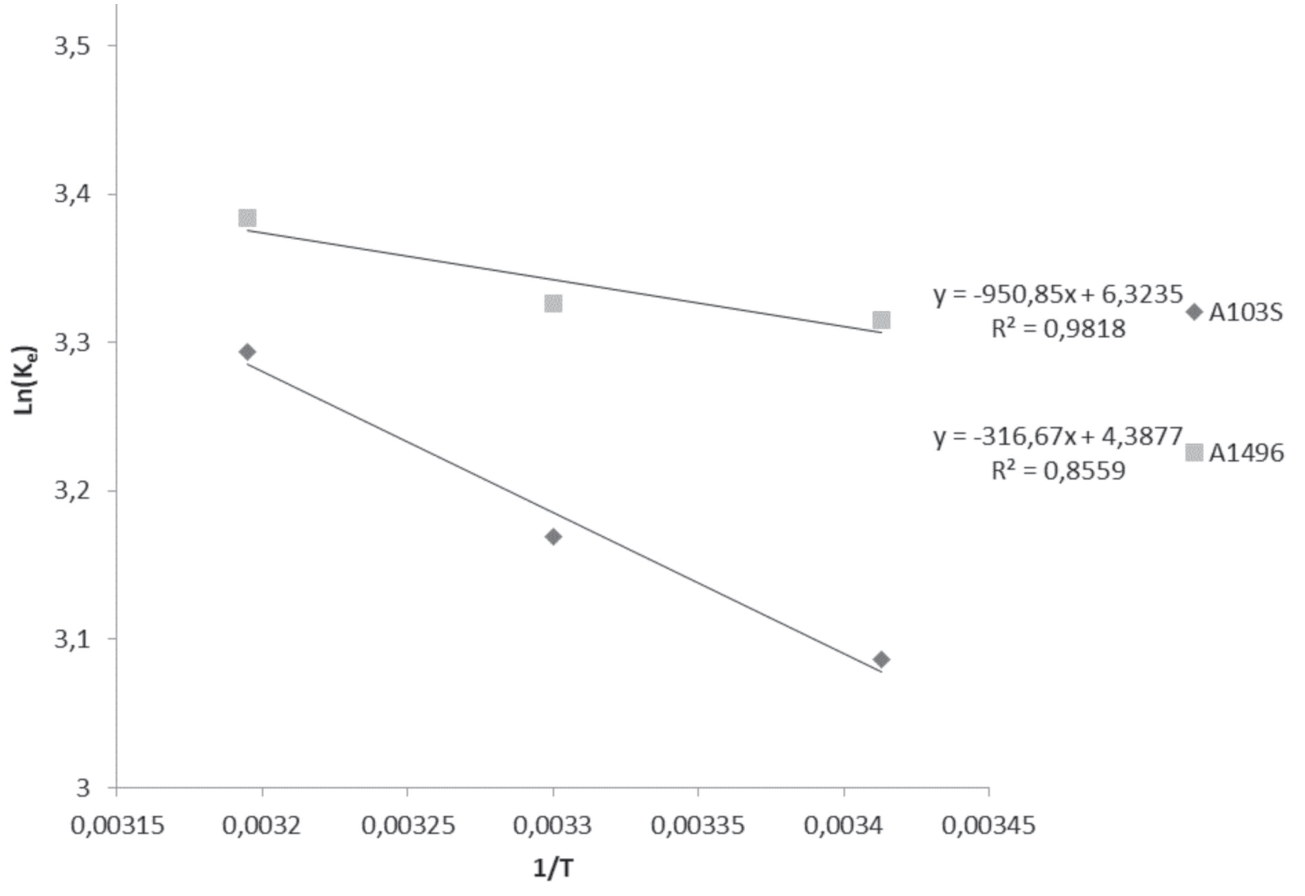
Thermodynamic values were determined by examining the equilibrium concentrations dependent on temperature according to the method described in the literature [37, 38]. The dependence of the mass transfer equilibrium constant in an infinitely diluted solution was defined as follows:
where
Acquired values of Ke for different temperatures allow to plot the function of lnKe versus
Due to dependency (Eq. 7):
where
Table 2.
Results of effects of initial amount of adsorbent studies.
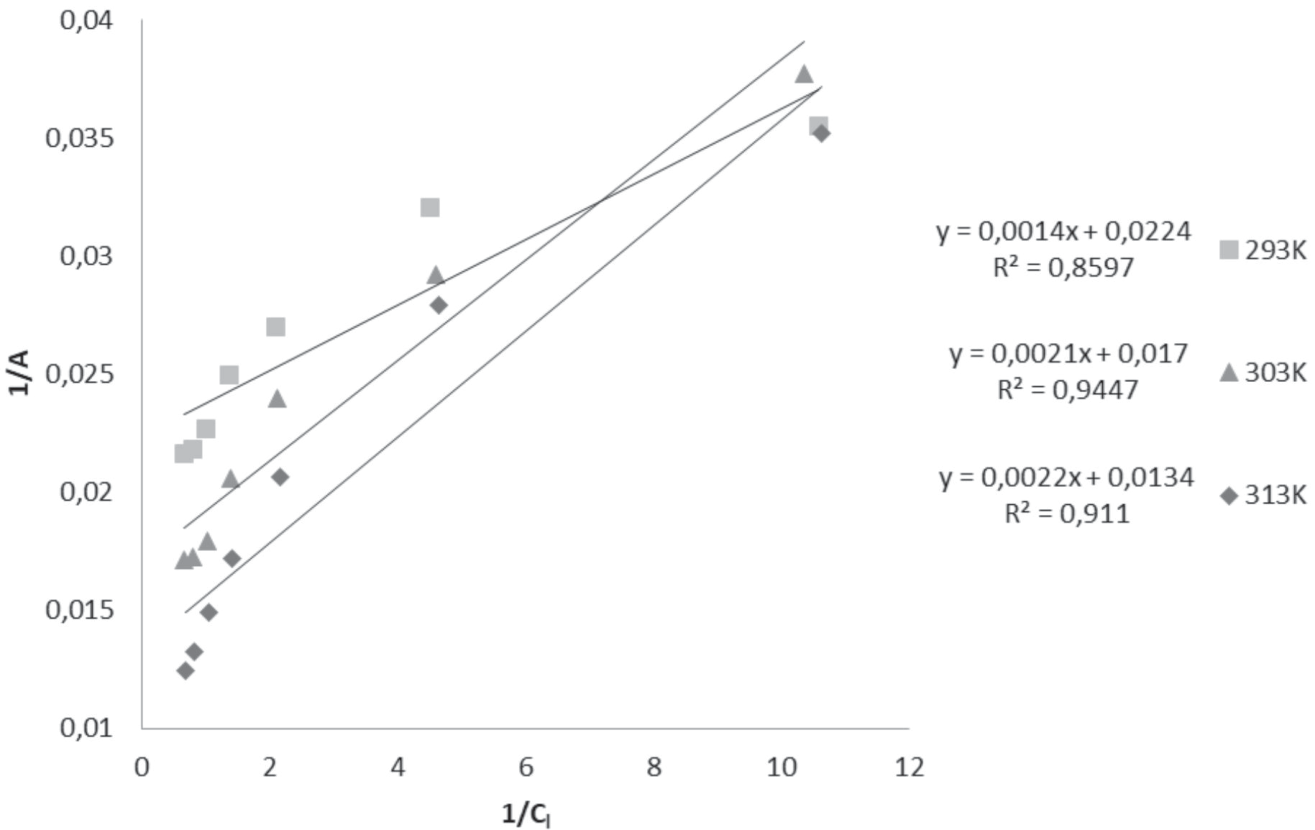
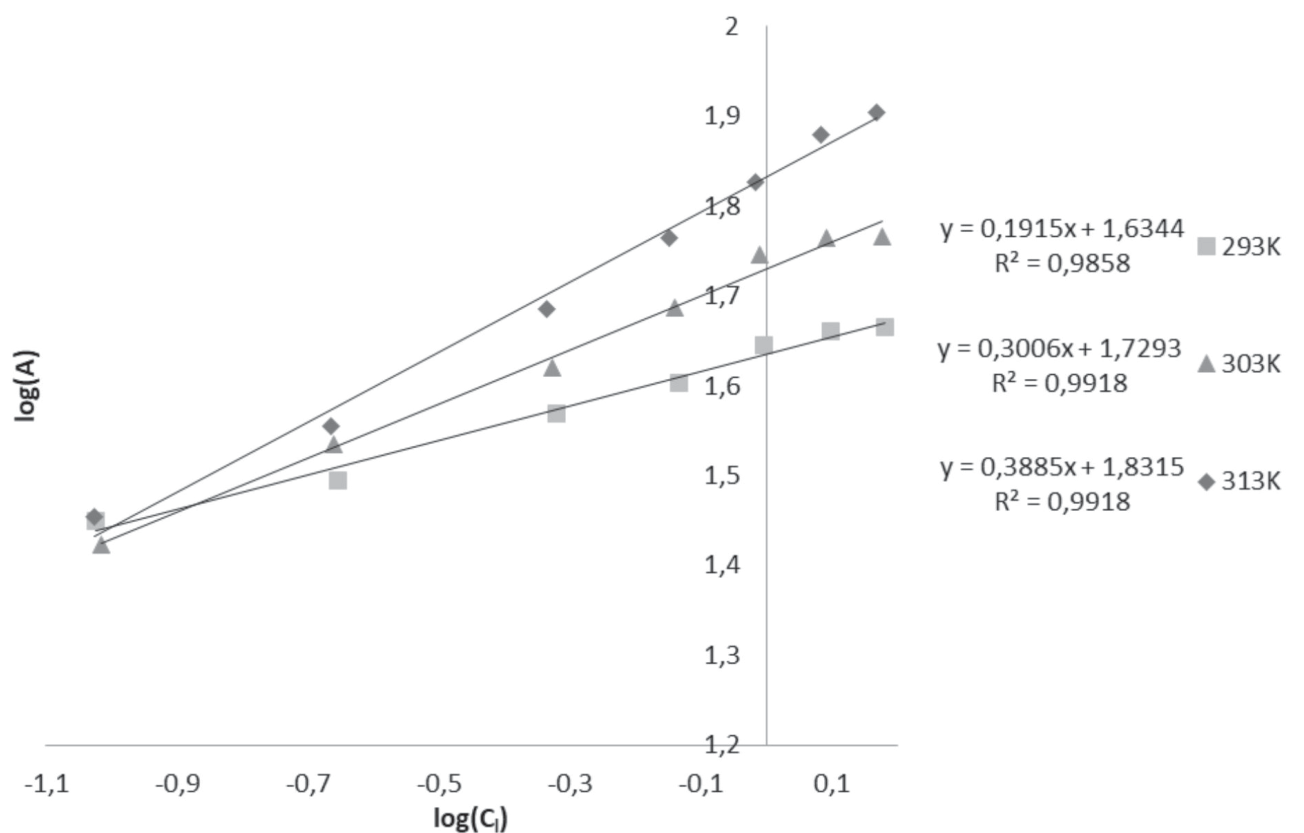
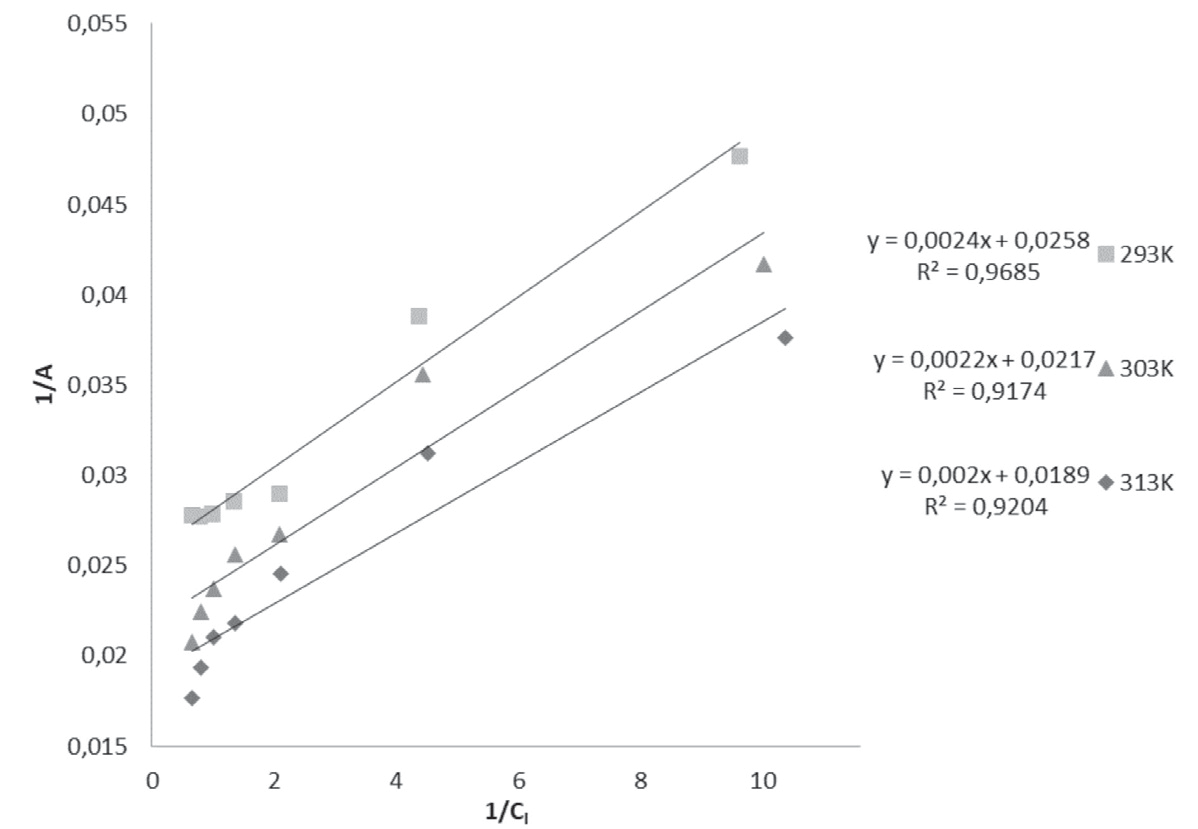
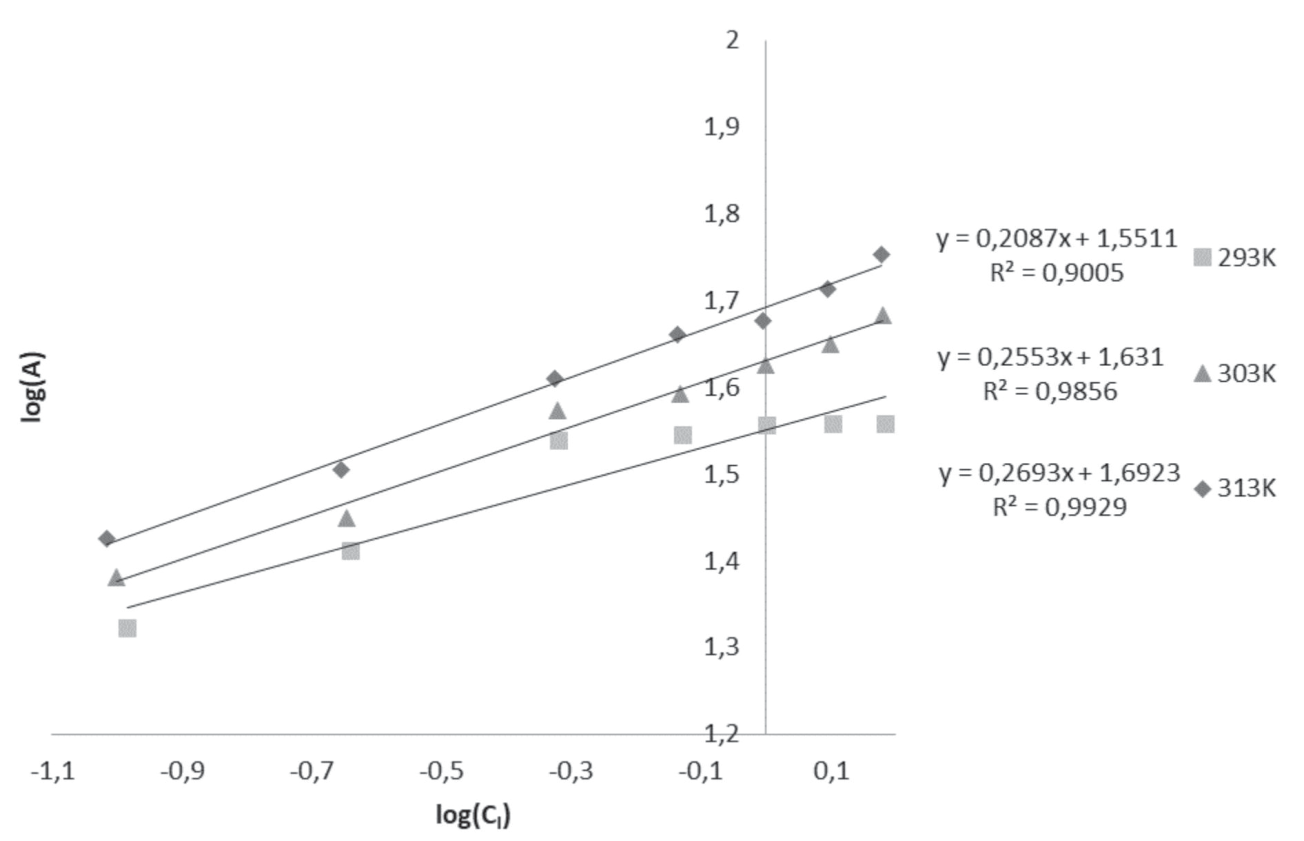
Table 3.
Parameters of isotherm equations for ion-exchange resins A1496 and A103S.
where
Effect of Salinization
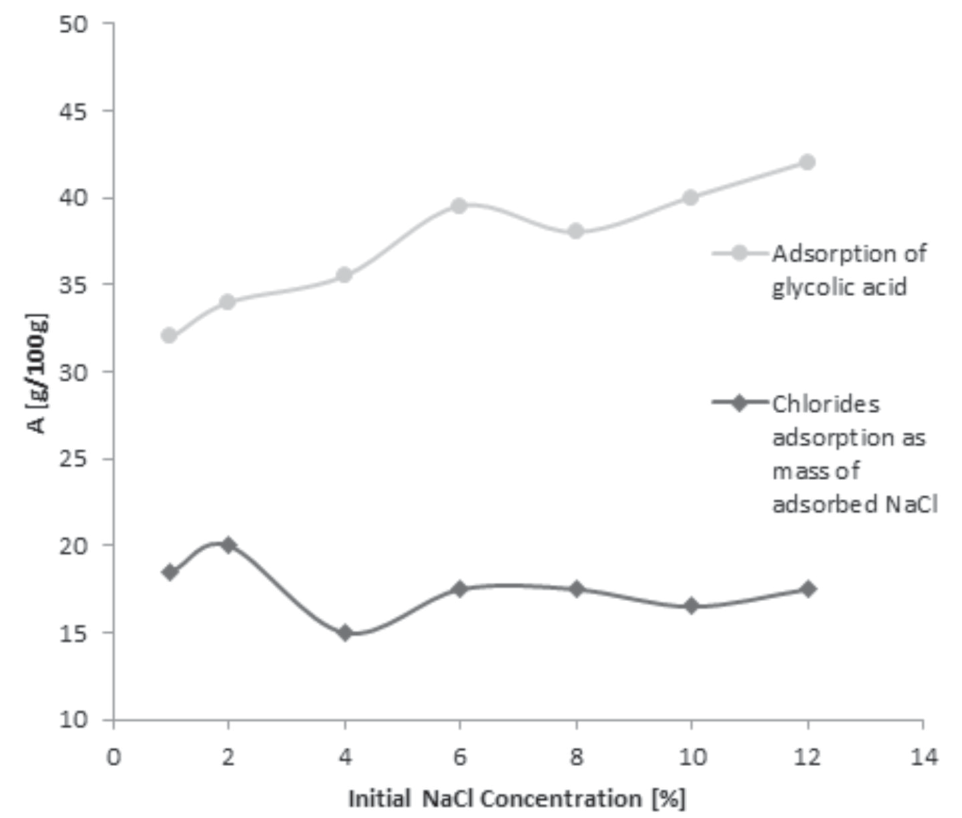
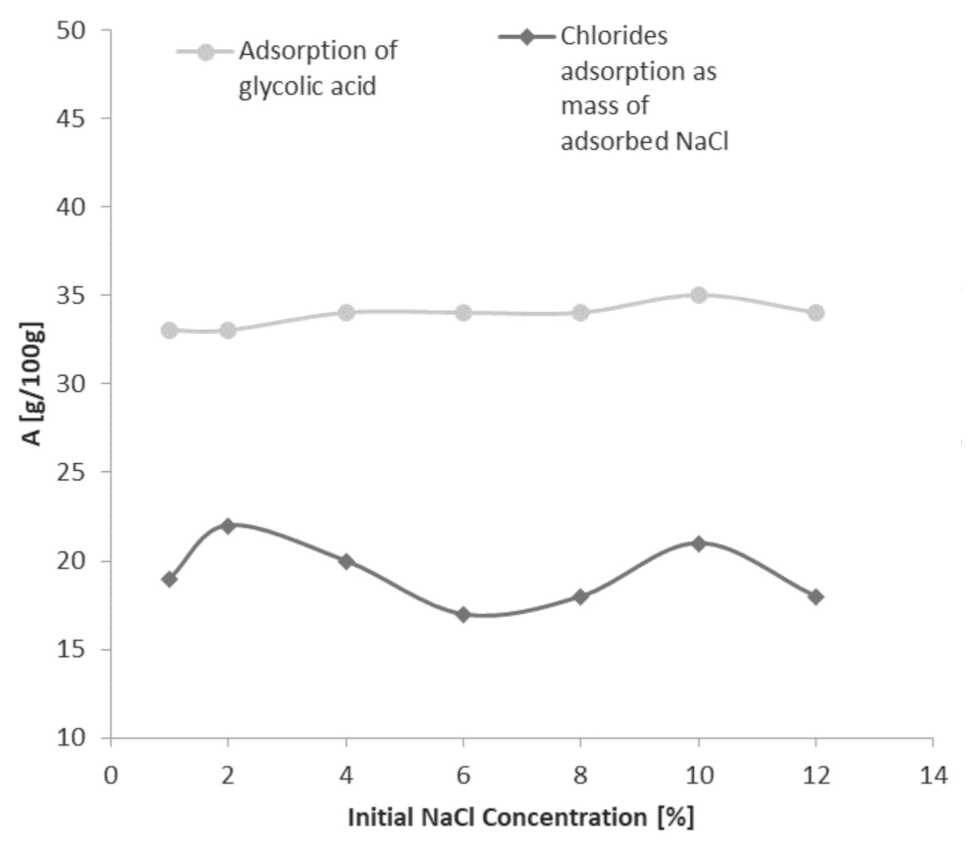
The effect of salinization on the aqueous solution of glycolic acid has no significant impact on the ion-exchange process for A103S resin as well as for A1496. It is worthy to mention that slightly more efficient adsorption on A1496 anionite related to increasing sodium chloride concentration, but is not observed for A103S resin. It is important to point out that adsorption of chlorides theoretically decreases the saturation point of glycolic acid caused by the competitive use of available active ion-exchange groups. Results of competitive adsorption of glycolic acid and chlorides for A1496 and A103S resins are shown in Fig. 9 and 10, respectively.
Adsorption Breakthrough Curve Studies
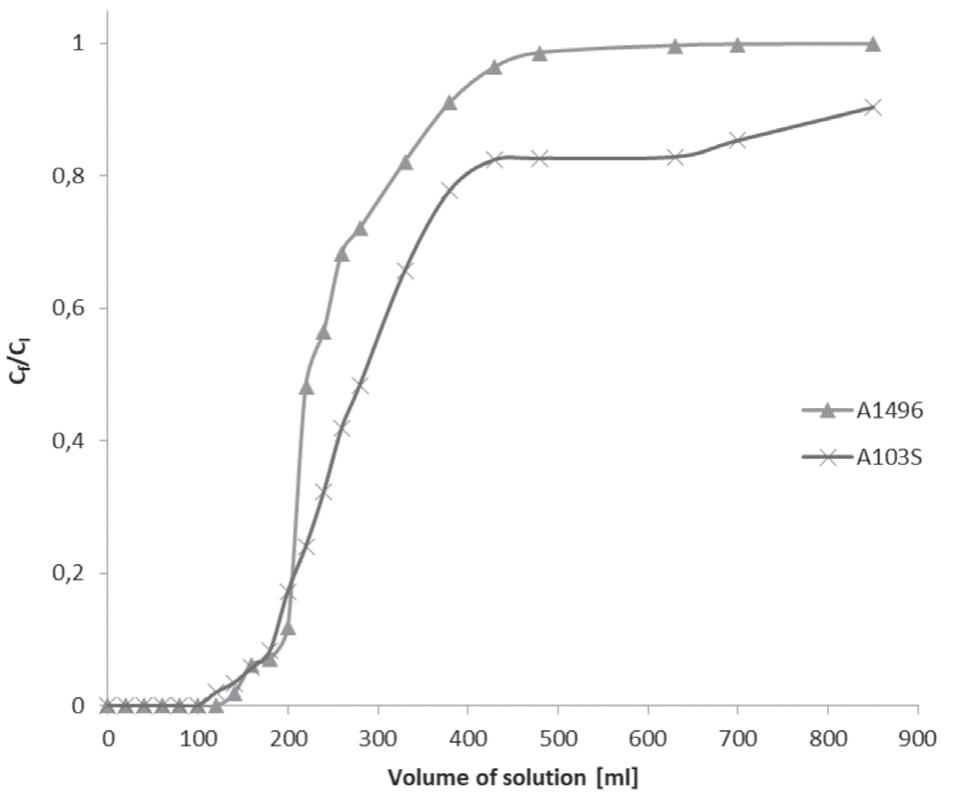
Breakthrough curves were determined for 3% of the weighted aqueous solution. Breakthrough curves were shown in Fig. 11 as a dependency of final concentration (Cf) related to initial concentration (CI) to volume of flown solution [ml]. Breakthrough points (Cf/CI = 0,05) for A1496 and A103S were equal to 150ml and 160ml respectively. The point of bed saturation for A1496 (Cf/CI = 0,95) was established as 420 ml. In the case of A103S resin, the effect of slowdown in relative concentration growth occurs at a point of 430ml (Cf/CI = 0,82) which could be treated as a pseudosaturation point.
Conclusions
The objectives of the presented studies were to investigate batch adsorption of glycolic acid from aqueous solution parameters as adsorption efficiencies, equilibrium characteristics for Langmuir and Freundlich equations, thermodynamic parameters of the process, the effect of the presence of sodium chloride on the adsorption process, and determining breakthrough curves for A103S and A1496 ion-exchange resins in the dynamic adsorption process. Both resins have been found effective in the removal of glycolic acid, especially from low-concentrated solutions. A1496 exhibited higher performance than A103S, especially in the case of batch adsorption, Nevertheless, these resins are competitive in their considered applications. Langmuir and Freundlich isotherm equations were matched to experimental results. Much higher compatibility results and Freundlich isotherm equations have been found for A103S, as well as for A1496 ionites for each temperature than Langmuir isotherm equations (except for A103S at 293K). Investigation on the effect of the initial amount of ion-exchange resin has shown that A1496 is more efficient than A103S and it is possible to remove nearly a whole mass of glycolic acid from the aqueous solution by ion-exchange resin application. The thermodynamics of processes were studied in detail. Although adsorption on A1496 as well as on A103S is endothermal and both capacity and efficiency increase along with temperature due to the endothermal characteristics of the process and positive entropy value. Investigation on the effect of salinization of solution exhibited low influence on efficiency process for used ionites in considered concentrations of acid and sodium chloride. The determination of breakthrough curves has shown notable similarity between these two adsorbents depending on the ability of total removal of glycolic acid and breakthrough point. Nevertheless, it exhibited that A1496 is more industrially applicable due to its better characteristics of curve flow, such as a lack of pseudosaturation point and a greater slope of the curve which results in potentially better utilization of bed volume.

