Introduction
Chromium is a common heavy metal that is released by a number of industries. In the environment, it mostly takes the forms of trivalent chromium (Cr (Ⅲ)) and hexavalent chromium (Cr (VI)) [1, 2]. Even at extremely low concentrations, Cr (VI) may seriously harm aquatic life and water consumers. Additionally, it is far more hazardous than Cr (III) [1, 3, 4]. As a result, Cr (VI) needs to be polished before the Cr (VI)-bearing wastewater is discharged into the water bodies.
Adsorption has been demonstrated by other researchers, and in our earlier work, to be an effective method for the elimination of Cr (VI) [5-7]. Due to its many advantages, such as its affordability, ease of manufacture, environmental friendliness, adaptability, high stability, and abundant supply of raw materials, biochar (BC) has been widely used as an adsorbent for adsorption removal of a variety of pollutants [8- 12]. Agricultural waste mainly includes plant waste, agricultural and sideline products processing waste, and so on [13-15], which has a loose, porous structure and contains carboxyl, hydroxyl, and other reactive groups to be used as a biomass adsorption material in the field of pollution control [16]. At present, a great deal of research has been done on taking advantage of agricultural wastes as biomass adsorbents for the treatment of pollutants, such as organic pollutants and heavy metals pollutants [17-21].
However, biochar has to be modified for Cr (VI) adsorption due to a lack of active sites in its pristine state [22, 23]. The efficacy of chemicals rich in amino groups, such as polypyrrole, polyaniline, polyethyleneimine, chitosan, and others, has been demonstrated by their amine and imine groups' ability to remove Cr (VI) through electrostatic adsorption and chelation [7, 24, 25]. In addition, their advantages, such as easy synthesis, robust ion exchange capacity, and environmental stability, account for their widespread use in biochar modification [24].
Polyethyleneimine (PEI) has been shown in our earlier work to be useful in enhancing Cr (VI) adsorption by biochar made from garden waste. However, because of its comparable density to the solution, the composite is challenging to separate after adsorption.
Fe2+/Fe3+ coprecipitation and PEI modification were employed in this study to improve the biochar's ability to remove Cr (VI) and make it easier to separate from the solution. The conversion of Cr (VI) into Cr (Ⅲ) further improved Cr (VI) removal [7, 26]. The best conditions for the manufacture of the composite were explored. Batch Cr (VI) adsorption tests were conducted to explore its Cr (VI) adsorption ability and Cr (VI) removal mechanism.
Materials and Methods
Adsorbent Preparation
Garden waste (GW) was collected from the North China University of Water Resources and Electric Power, Zhengzhou, China. GW was dried and sieved using 0.15 mm mesh. 15 g of GW powder was calcined at 800°C in a tube furnace for 4 h, which was determined in our previous study to be the best condition for GWBC preparation in the N2 atmosphere.
The Fe2+/Fe3+coprecipitation adopted in the previous research was used to prepare the magnetic GWBC (Fe3O4@GWBC). Briefly, Fe3O4@GWBC was prepared by adding GWBC, FeCl3·6H2O, FeSO4·7H2O at different ratios into 200 ml deionized water (W:W:W= 0.1:1.0:0.56, 0.5:1.0:0.56, 1.0:1.0:0.56, 1.5:1.0:0.56 and 2.0:1.0:0.56) since FeCl3·6H2O: FeSO4·7H2O=1.0:0.56 was used for Fe3O4 preparation determined in previous study [27]. Therefore Fe3O4@GWBC was made by adding GWBC, FeCl3·6H2O, and FeSO4·7H2O at varied ratios into 200 ml deionized water (W:W:W= 0.1:1.0:0.56, 0.5:1.0:0.56, 1.0:1.0:0.56, 1.5:1.0:0.56 and 2.0:1.0:0.56). The adsorbents that were made using distinct ingredients were identified by their labels, which were Fe3O4@ GWBC1, Fe3O4@GWBC2, Fe3O4@GWBC3, Fe3O4@ GWBC4 and Fe3O4@GWBC5. 1% NaOH was added dropwise into the mixture, being stirred at 150 rpm and 90℃ until its pH rose to 11 in a water bath. The mixture was stirred for another 1 h for a complete reaction. After gathering the black precipitate, deionized water was used to wash it until the pH was stable. To get the magnetic GWBC, the black particles were crushed and dried in a vacuum at 50℃ before being passed through a 0.15 mm sieve once more.
1g Fe3O4@GWBC was dispersed into 20 ml 10% (mass fraction) PEI-methanol solution combination and stirred at 160 rpm and 30℃ for 5 h. The mixture was stirred for another 30 minutes and filtered after 40 ml 1% (mass fraction) glutaraldehyde solution was added. The solid was dried in an oven at 65℃ after being washed using deionized water to get the final adsorbent (P/Fe3O4@GWBC).
GWBC was first modified using PEI and by Fe2+/Fe3+ coprecipitation in sequence using the same parameter mentioned above to get Fe3O4@PGWBC.
Adsorbent Characterization
An automatic specific surface area analyzer (Belsorp-max, Japan) was used to determine the BET-specific surface area and the total BJH pore volume and pore size distribution. The surface morphology of samples was observed by scanning electron microscopy (SEM, Zeiss Genimi500, Germany). The chemical states of the atoms in the samples were investigated by X-ray photoelectron spectroscopy spectrometer (XPS, Escalab 250Xi+, USA). A Fourier transform infrared spectroscopy (FTIR, Nicolet IS50, USA) was used to analyze the functional groups of the samples. The X-ray diffraction spectra of the samples were recorded using a diffractometry machine (XRD, ZSX Primus II, Japan). The zeta potential of the sample was determined using a zeta potential meter (Particle Metrix GmbH, Germany).
Batch Adsorption Experiment
Static adsorption experiments were carried out to explore the Cr (VI) removal performance of the prepared adsorbent in the following way: 20 mg of adsorbent was put into 50 mL Cr (VI)-containing wastewater, and the mixture was shaken at 120 rpm for various temperatures and times. The residual Cr (VI) in the filtrates was examined by a UV-vis spectrophotometer (UV-5100, Yuanxi, China) using the 1,5-diphenylcarbazide method at 540 nm. All the experiments were done in triplicate.
Results and Discussion
Determination of the Optimal Condition for Adsorbent Preparation
As shown in Fig. 1A, Cr (VI) adsorption of five Fe3O4@GWBCs increased significantly with the rising GWBC dosage from 0.1 g to 1 g, and further increase of GWBC dosage to 2 g led to faint enhancement of Cr (VI) adsorption, while, the magnetization of Fe3O4@ GWBCs decreased from 36.23 emu/g to 24.99 emu/g (Fig. 1B). As a result, 1g GWBC, namely, GWBC:FeC l3·6H2O:FeSO4·7H2O=1.0:1.0:0.56 was determined to be the best formula for Fe3O4@GWBC preparation, taking into account both its Cr (VI) adsorption and magnetic separation.
Fig. 1.
Cr (Ⅵ) adsorption and VSM diagrams of Fe3O4@GWBC prepared at different raw material ratios (T = 298 K, t = 4 h).
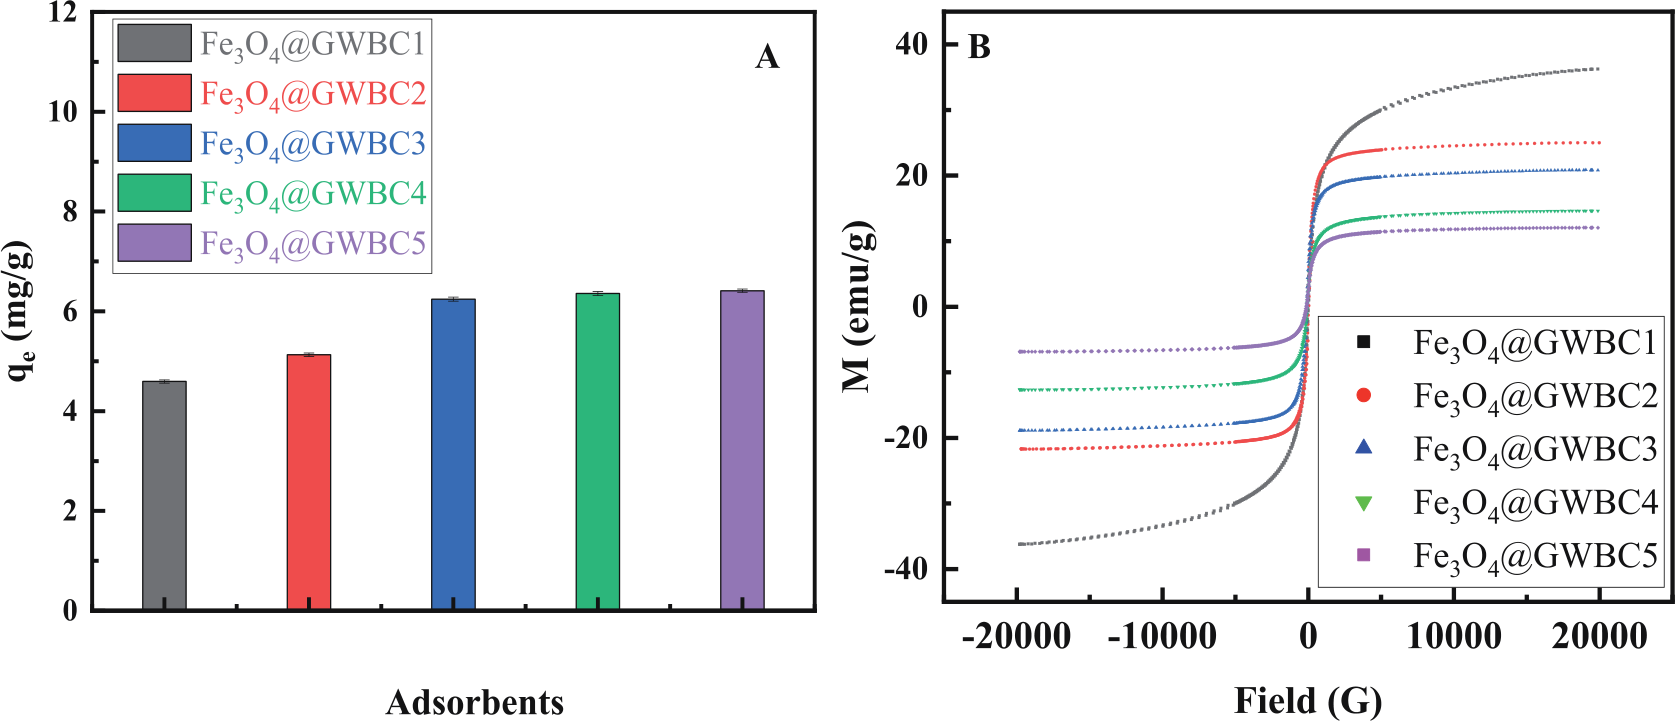
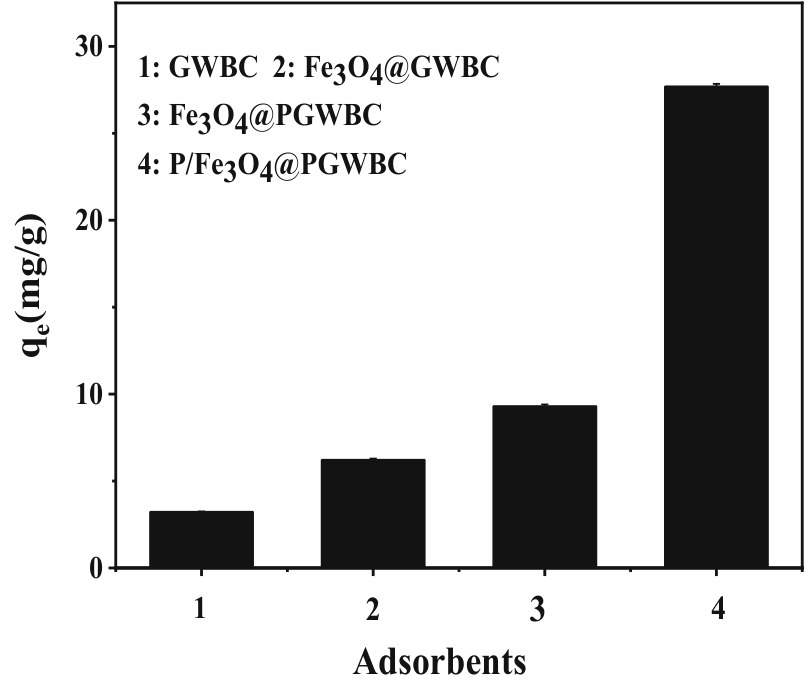
Fig. 2 shows the Cr (Ⅵ) adsorption using GWBC, Fe3O4@GWBC, Fe3O4@PGWBC, and P/Fe3O4@ GWBC. P/Fe3O4@GWBC showed the highest Cr (Ⅵ) adsorption of 27.7 mg/g among the four adsorbents, indicating GWBC modified by magnetization and PEI may improve its Cr (Ⅵ) adsorption. The modification sequence also considerably impacted the Cr (Ⅵ) adsorption. Compared to Fe3O4@PGWBC, P/Fe3O4@ GWBC was superior for Cr(Ⅵ) removal because PEI modification after magnetization provided reactive amino groups on its surface. However, magnetization after PEI modification covered the amino groups with Fe3O4 particles, which weakened the Cr (Ⅵ) adsorption. As a result, P/Fe3O4@GWBC was used to carry out the following tests.
As shown in Fig. 3A, GWBC had a relatively smooth surface with a flaky structure, whereas P/Fe3O4@ GWBC had a rough surface (Fig. 3B) with numerous fine particles on it due to the sequential alteration by magnetization and PEI.
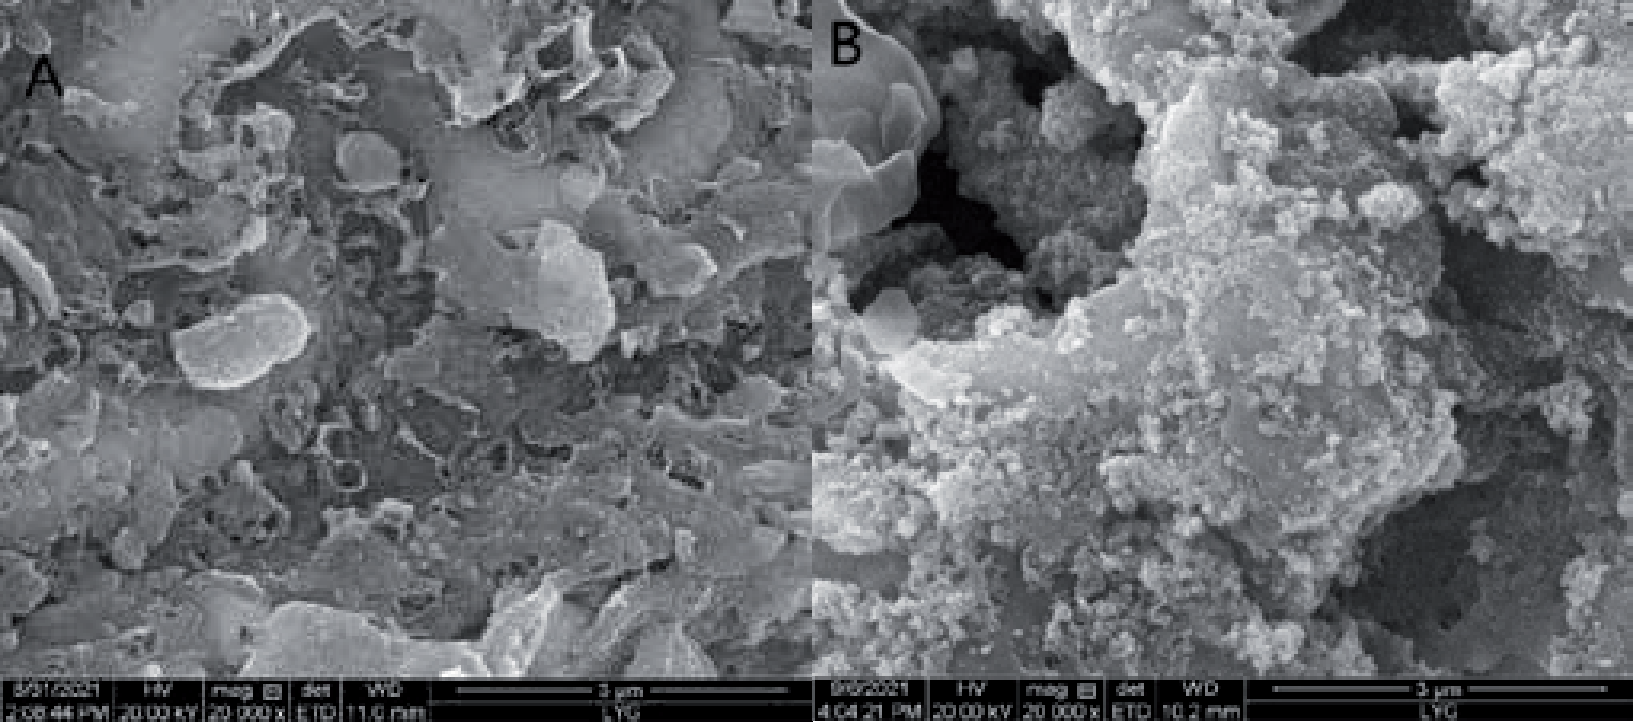
Fig. 4.
Nitrogen adsorption-desorption isotherms (A) and pore size distribution (B) of P/Fe3O4 @GWBC.
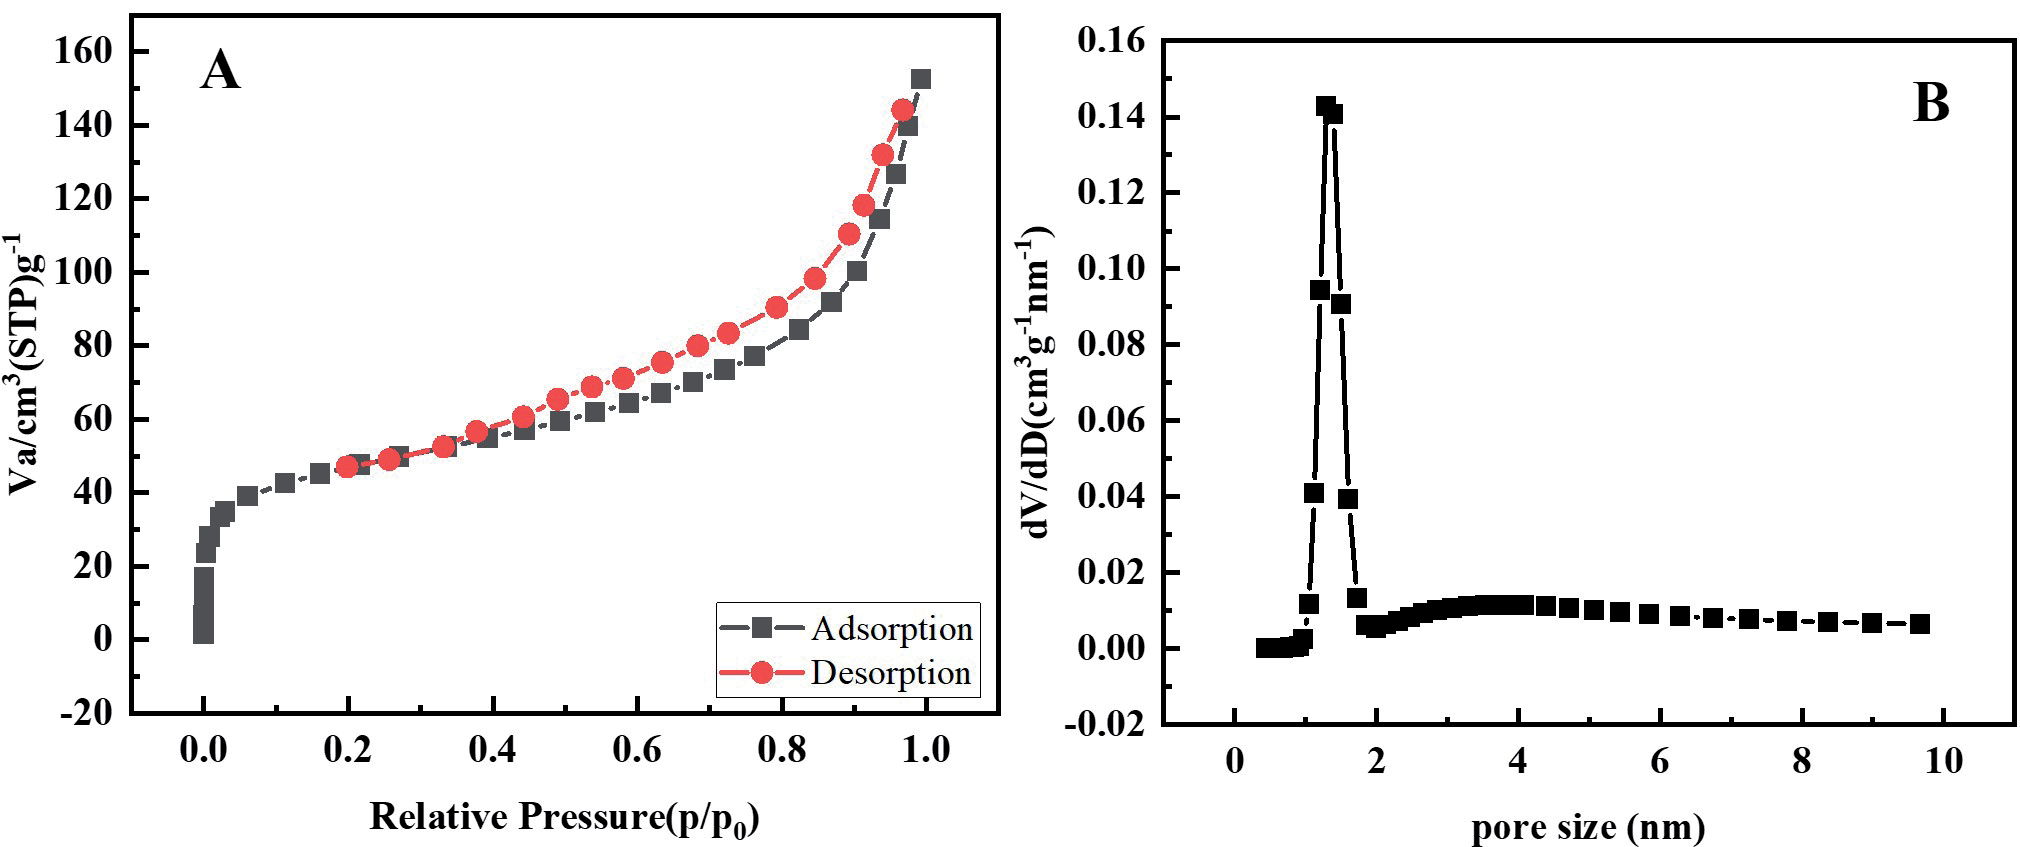
Table 1.
Specific surface areas and pore textures of P/Fe3O4@GWBC.
| Sample | SBET (m2/g) | Vtot (cm3/g) | Average pore diameter (nm) |
|---|---|---|---|
| P/Fe3O4@GWBC | 165.43 | 0.23 | 5.62 |
As shown in Fig. 4A, P/Fe3O4@GWBC had type IV N2 adsorption-desorption isotherms with type H4 hysteresis loop, and its SBET, Vtot, and average pore diameter were 165.43 m2/g, 0.23 cm3/g and 5.62 nm (Fig. 4B, Table 1), respectively, indicating the composite was a typical composite with both micropore and mesopore.
The structures and crystallinities of GWBC and P/Fe3O4@GWBC was investigated using XRD, and the findings were shown in Fig. 5. The main characteristic peaks at 2θ = 30.17°, 35.52°, 43.17°, 53.58°, 57.24° and 62.69° corresponded to the (220), (311), (400), (422), (511) and (440) planes of Fe3O4 [28-31]. Hence, Fe3O4 was loaded successfully on the P/Fe3O4@GWBC, allowing the spent adsorbent to be readily separated from an aqueous solution following adsorption in a magnetic field.
Static Adsorption
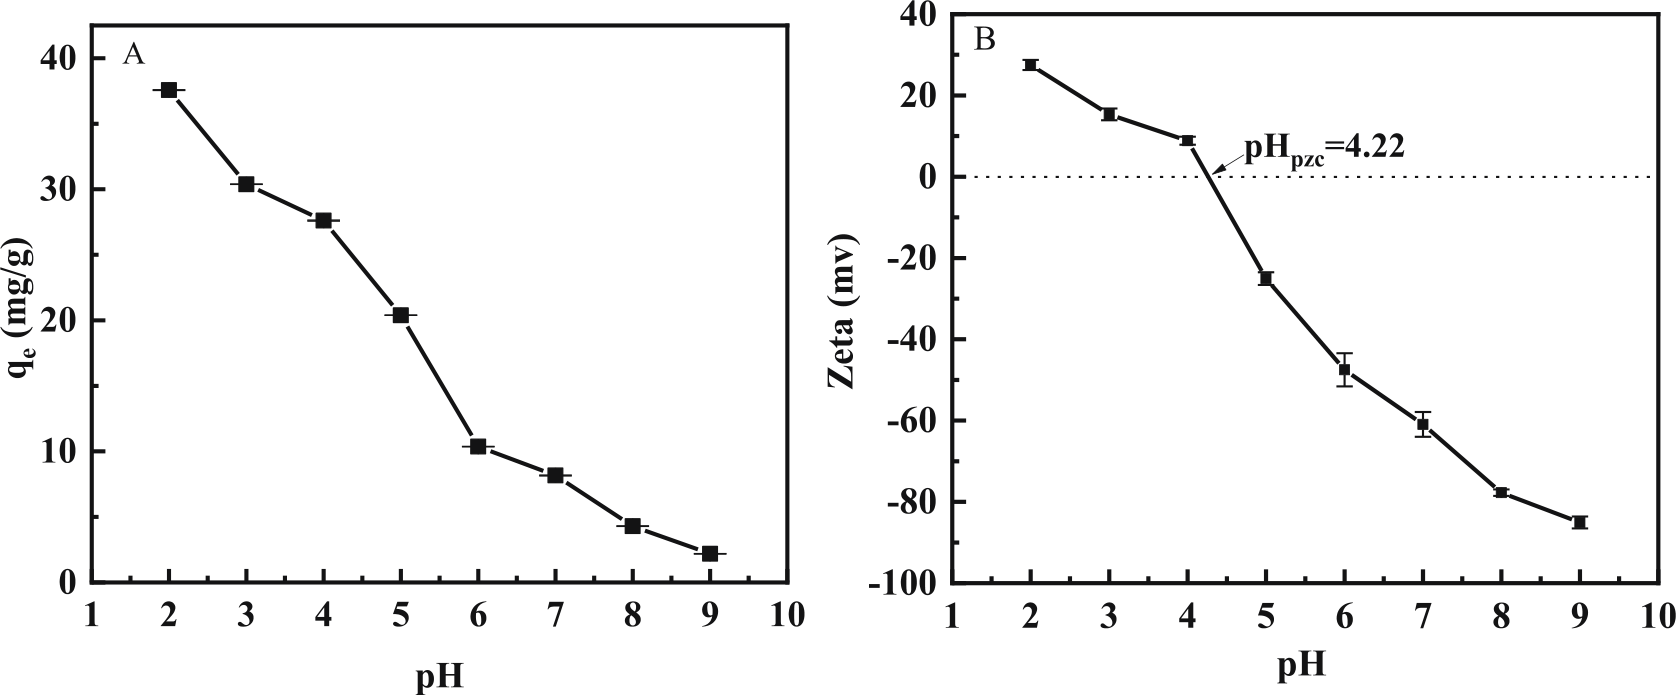
As shown in Fig. 6A and 6B, Cr (Ⅵ) adsorption by P/Fe3O4@GWBC declined from 37.6 mg/g to 2.2 mg/g as the solution pH increased from 2 to 9, indicating an acid environment was favorable for Cr (Ⅵ) adsorption. As shown in Fig. 6B, the zeta potential of P/Fe3O4@ GWBC fell from 27.5 mv to -85.1 mv when pH increased from 2 to 9, and pHzpc was about pH=4.22. As a result, the surface of P/Fe3O4@GWBC was positively charged in pH range of 2-4.22, allowing for the electrostatic attraction of Cr (Ⅵ) mainly existing in the form of oxygenate. Contrarily, the negatively charged surface at pH>4.22 repulsed the oxygenate, weakening the Cr (Ⅵ) adsorption. Additionally, the competition between oxygenate and OH- further impaired Cr (Ⅵ) adsorption as well.
Kinetic Study
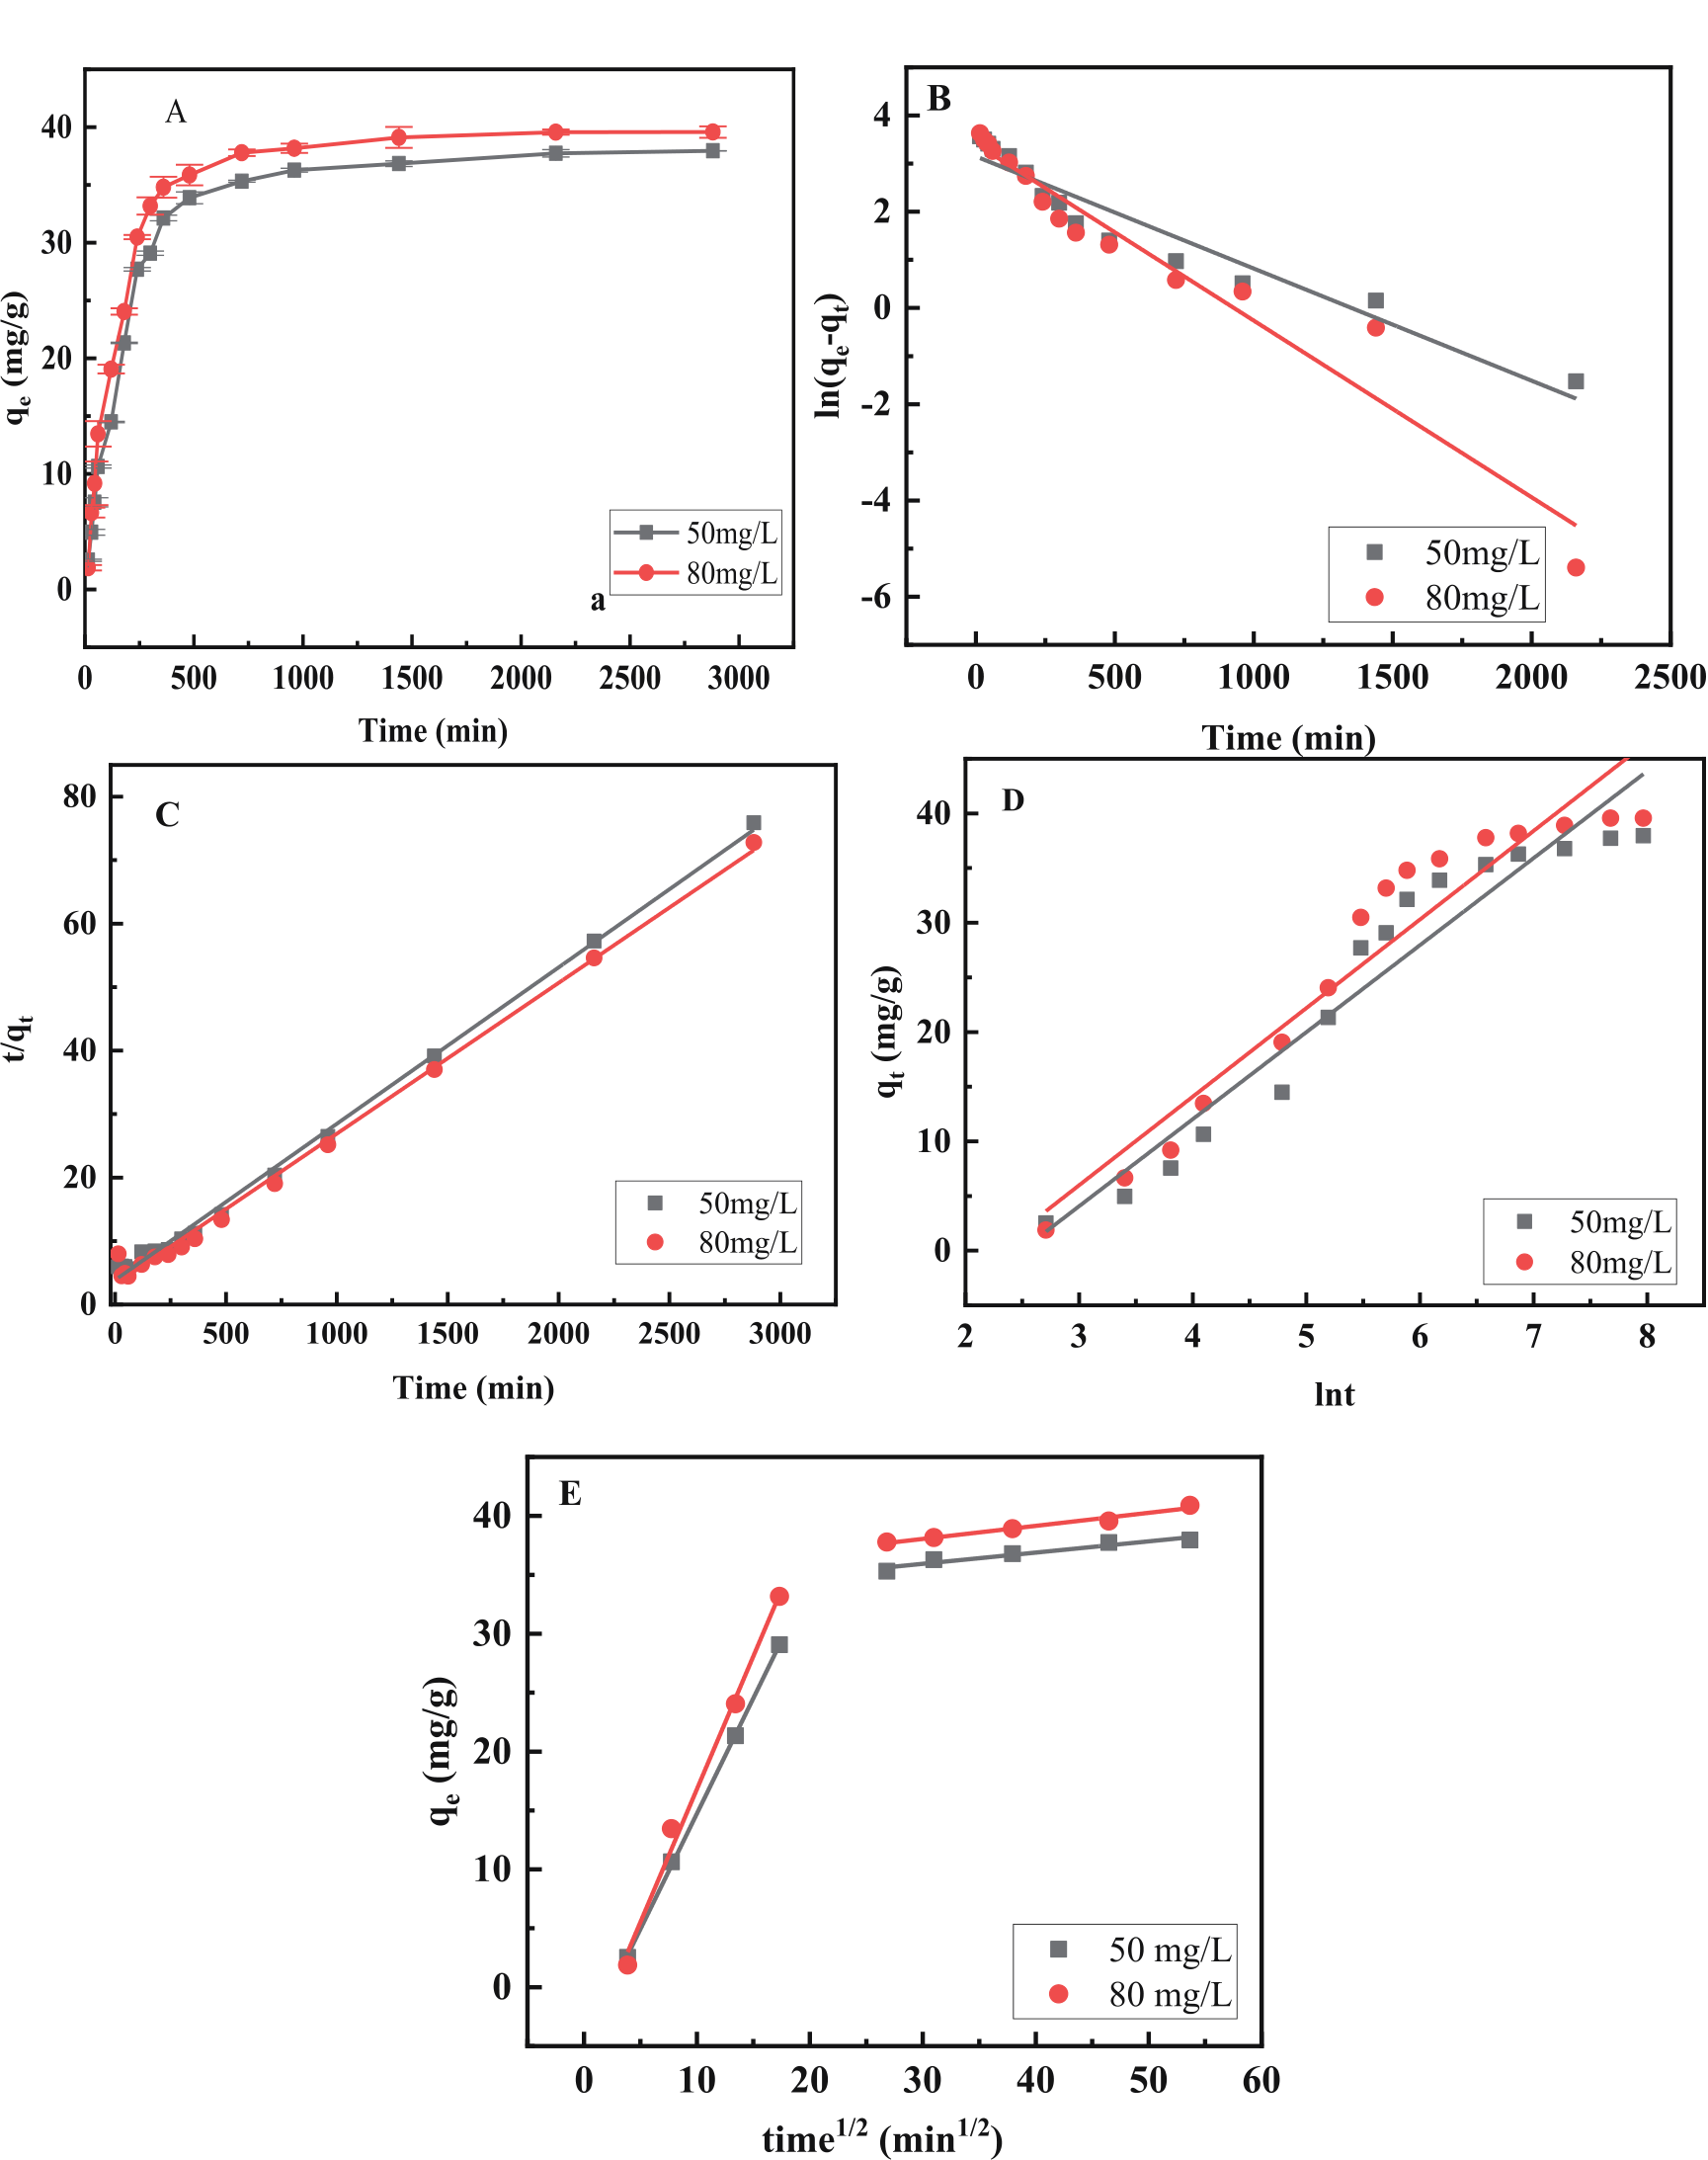
As shown in Fig. 7A, for each starting concentration, the adsorption process had a fast adsorption stage, lasting from the beginning of the test to 240 min, in which about 73.0% and 77.0% of the total Cr (Ⅵ) was removed, owing to enough active sites on the surface of the composite for the adsorption, then the adsorption came into a slow stage, which lasted to the end of the test at 2880 min.
Four kinetics models, namely, pseudo-first-order, pseudo-second-order, Elovich models, and intragranular diffusion (Eqs. (1)-(4)) [6, 32] were adopted to explore the adsorption process.
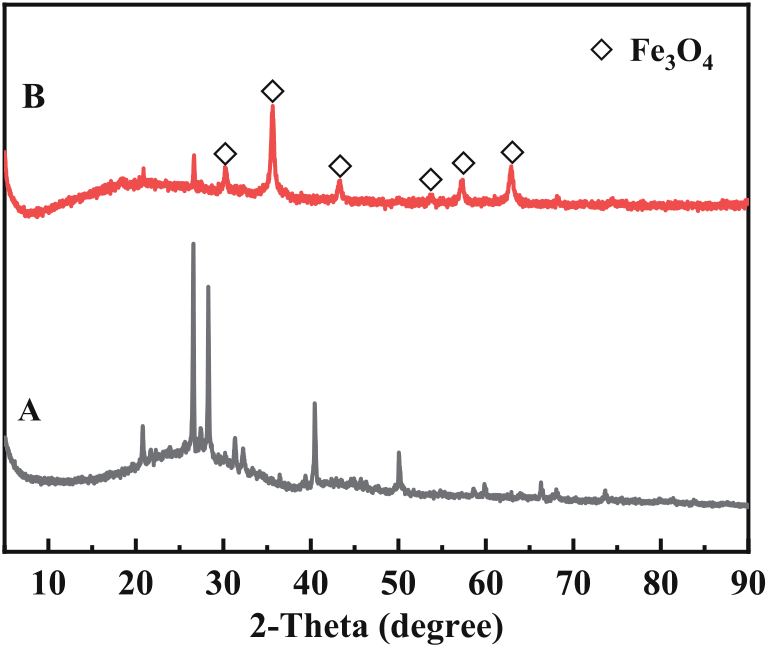
Fig. 6.
Influence of the initial solution pH on Cr (Ⅵ) adsorption by P/Fe3O4@GWBC (A), Zeta potential analysis of P/Fe3O4@GWBC (B) (C0 =50 mg/L , T=298K, t=4 h).
where qe (mg/g) and qt (mg/g) were the Cr (VI) uptake at equilibrium and time t, respectively. k1 (1/ min) and k2 (g/mg·min) were the pseudo-first-order and pseudo-second-order rate constants, respectively. α (mg/ g·min) and β (g/mg) were the initial adsorption rate and the desorption constant, respectively. ki (mg/g·min1/2) was the intragranular diffusion constant, and C was the y-intercept.
Fig. 7B-7D shows the linear fitting using the pseudo-second-order model, the pseudo-first-order model, and the Elovich model, with fitting results presented in Table 2. R2 of the pseudo-second-order model was higher than those of the pseudo-first-order and the Elovich models; meanwhile, the experimental data of qe values (37.95 mg/g for C0=50 mg/l and 39.75 mg/g for C0=80 mg/l) were closer to the calculated data from the models, indicating the pseudo-second-order model was more proper than the other two models to describe the adsorption process.
The intragranular diffusion model was used as well to understand the major processes and the rate-limiting step for Cr (Ⅵ) adsorption by P/Fe3O4@GWBC [33].
As shown in Fig. 7E, each of the two fitting curves had two linear components, showing that both intro-particle diffusion and surface diffusion took part in the adsorption process. Additionally, as shown in Table 2, kip1 was higher than kip2 for both processes, indicating that the diffusional resistance increased with the quantity of Cr (Ⅵ) diffusing into the pores of the adsorbent [34].
Isotherm and Thermal Dynamic Analysis
Langmuir and Freundlich models (Eqs. (5) and (6)) were used to fit the isotherms shown in Fig. 8A, and the results were given in Fig. 8B and 8C.
where Ce (mg/L) was the Cr (VI) concentration at equilibrium, qm (mg/g) was the theoretical saturated Cr (VI) adsorption calculated from the Langmuir equation, b (L/mg) is the Langmuir constant, kf and n were the Freundlich model constants, respectively [35].
It can be observed from the R2 values of the two models listed in Table 3 that the Langmuir model was better at describing Cr (VI) adsorption by the composite.
Table 4 shows the monolayer Cr (Ⅵ) adsorption capacity of 11 magnetic adsorbents. P/Fe3O4@GWBC prepared in this study ranked fourth among the composites, indicating it is an effective adsorbent for Cr (Ⅵ) removal.
The influence of reaction temperature on Cr (Ⅵ) adsorption by P/Fe3O4@GWBC and the feasibility of the process was studied using three thermodynamic parameters, including change in standard free energy (ΔG0), standard entropy change (ΔS0), and standard enthalpy change (ΔH0), which were derived from Eqs. 7 and 8.
Fig. 7.
The adsorption kinetics of Cr(VI) by P/Fe3O4@GWBC (A), adsorption kinetics fitted with pseudo-first-order (B), pseudo-secondorder (C), Elovich models (D), and intragranular diffusion models (E) (pH=4, T=298K).
where KL was a constant from Langmuir isotherm (L/mol); ΔS0 and ΔH0 were calculated from the relationship of lnKL and 1/T shown in Fig. 8d, R is the ideal gas constant (8.314 J/(mol·K)), and T is the adsorption temperature (K).
Table 5 shows that the negative values of ΔG0 for all three adsorption reactions indicated Cr (Ⅵ) adsorption by P/Fe3O4@GWBC was spontaneous [46], and the positive values of ΔH0 and ΔS0 revealed the adsorption processes had an endothermic nature [2]. Additionally, physical adsorption had a ΔG0 value and a ΔH0 value in the range of -20-0 kJ/mol, and 2.1-20.9 kJ/mol in general, respectively [47, 48]. As a result, the ΔG0 and ΔH0 values of this study indicated Cr(Ⅵ) adsorption by P/Fe3O4@GWBC was mainly physical adsorption.
Influence of Co-Existing Anions
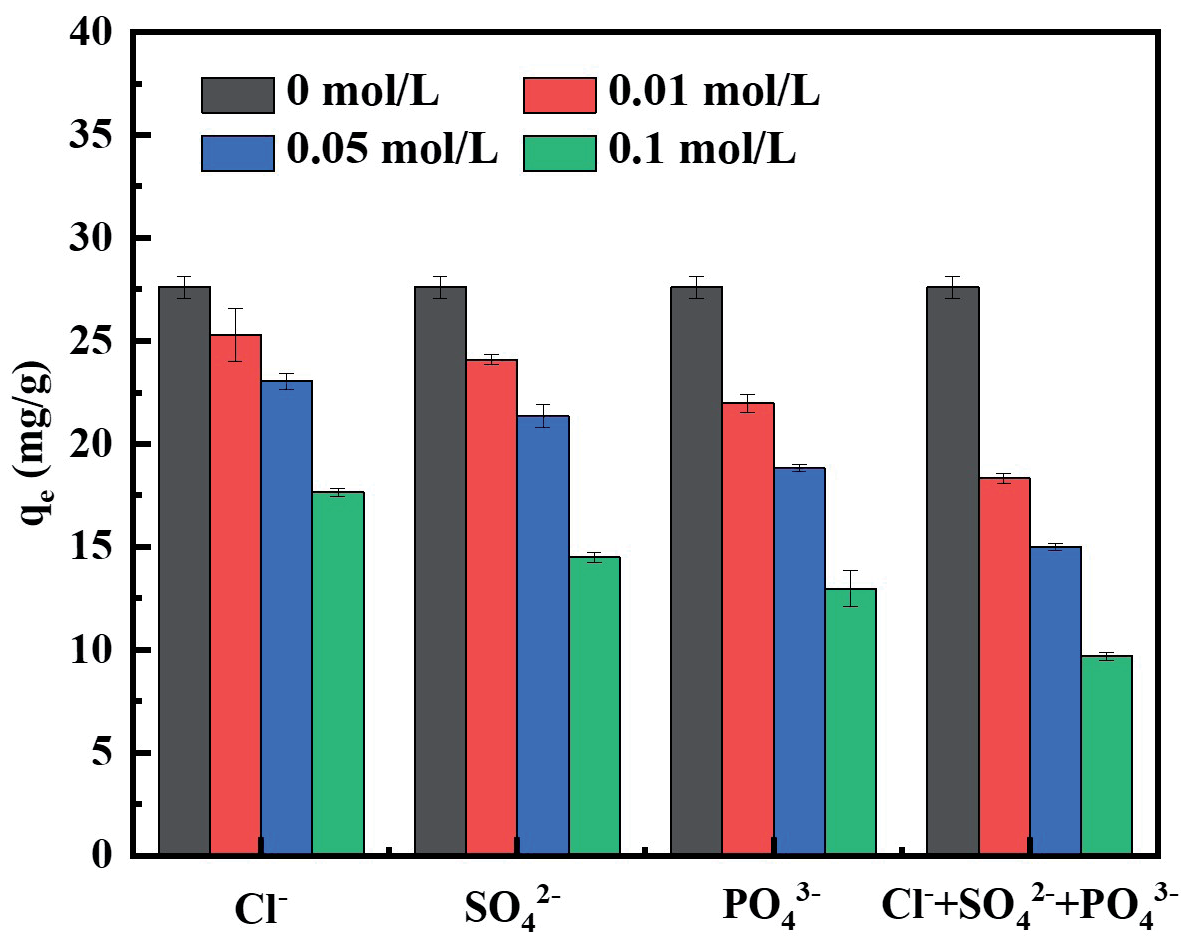
As shown in Fig. 9, all three anions decreased the Cr (Ⅵ) adsorption by P/Fe3O4@GWBC in the order of PO43->SO42->Cl- due to their competition for the active sites on the surface of P/Fe3O4@GWBC with Cr (Ⅵ) existing in the form of oxyanions, and increase of the concentration of each anion led to poorer Cr (Ⅵ) removal. The presence of the three anions weakened Cr (Ⅵ) adsorption more than the solo existence of any individual anion.
Cr (Ⅵ) Removal Mechanism
Verifying the Cr (VI) removal mechanism via P/ Fe3O4@GWBC is crucial as it indicates how the composite will be used in real applications. It was revealed by the experimental results mentioned above that the Cr (VI) removal by P/Fe3O4@GWBC was a monolayer chemisorption process with a spontaneous and endothermic nature.
Table 2.
Kinetic parameters of Cr (Ⅵ) adsorption by P/Fe3O4@GWBC.
Fig. 8.
The isotherms for Cr (Ⅵ) adsorption by P/Fe3O4@GWBC under different temperatures (A), the linear fitting by Langmuir model (B), Freundlich model (C), and the relationship between lnK0 and 1/T (D) (pH=4, t=48 h).
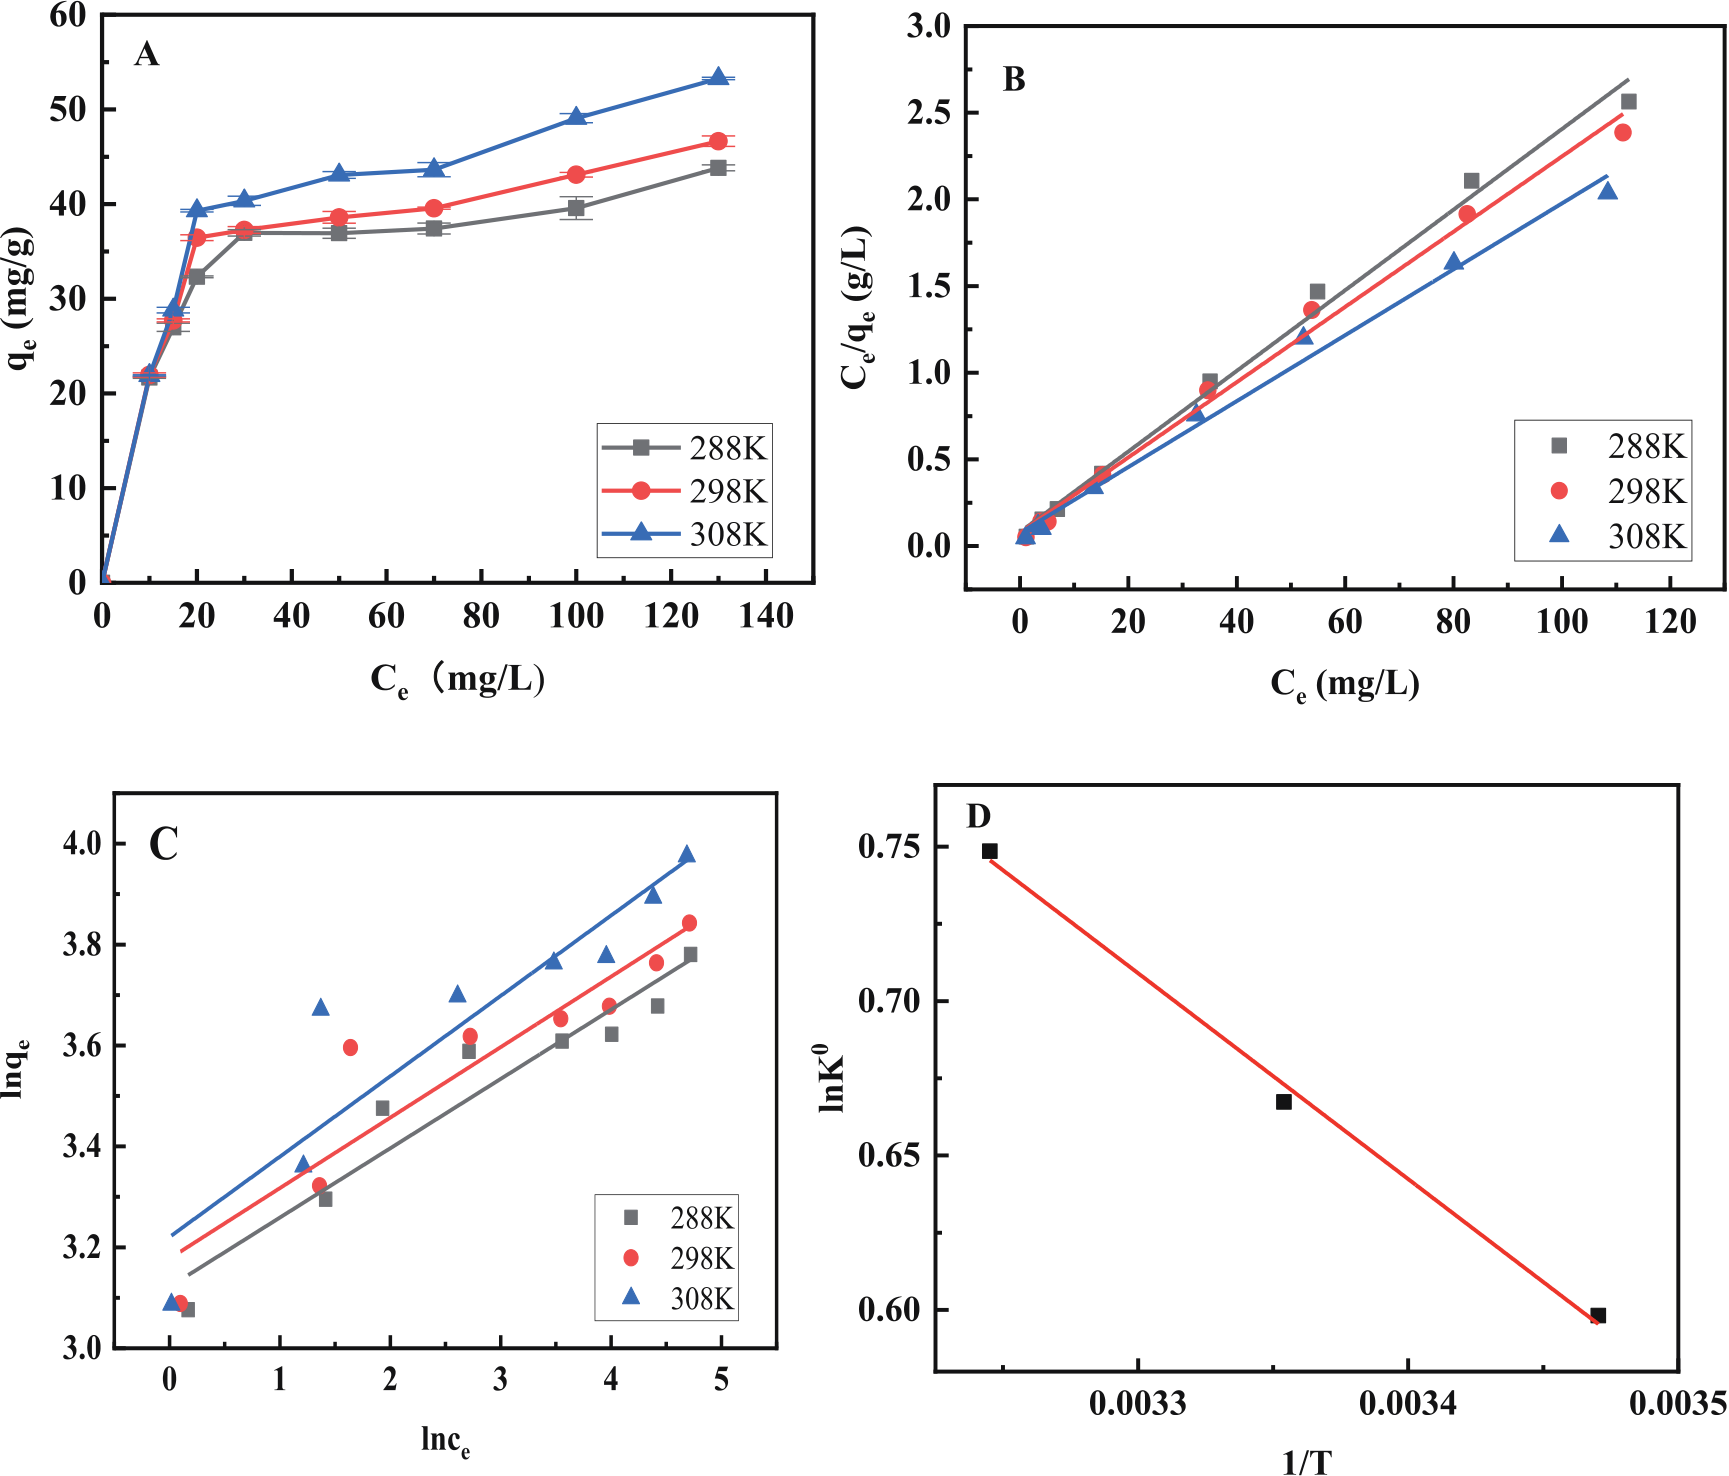
Table 3.
Parameters of Cr (Ⅵ) adsorption by P/Fe3O4@GWBC at different temperatures.
| Temperature (K) | Langmuir | Freundlich | ||||
|---|---|---|---|---|---|---|
| qm (mg/g) | KL (L/mg) | R2 | KF (mg/g) | n | R2 | |
| 288 | 43.011 | 0.287 | 0.993 | 22.686 | 7.281 | 0.926 |
| 298 | 46.083 | 0.279 | 0.993 | 23.992 | 7.159 | 0.867 |
| 308 | 52.604 | 0.250 | 0.991 | 25.039 | 6.278 | 0.856 |
Table 4.
Comparison of monolayer Cr (Ⅵ) adsorption by P/Fe3O4@GWBC with the other reported composites.
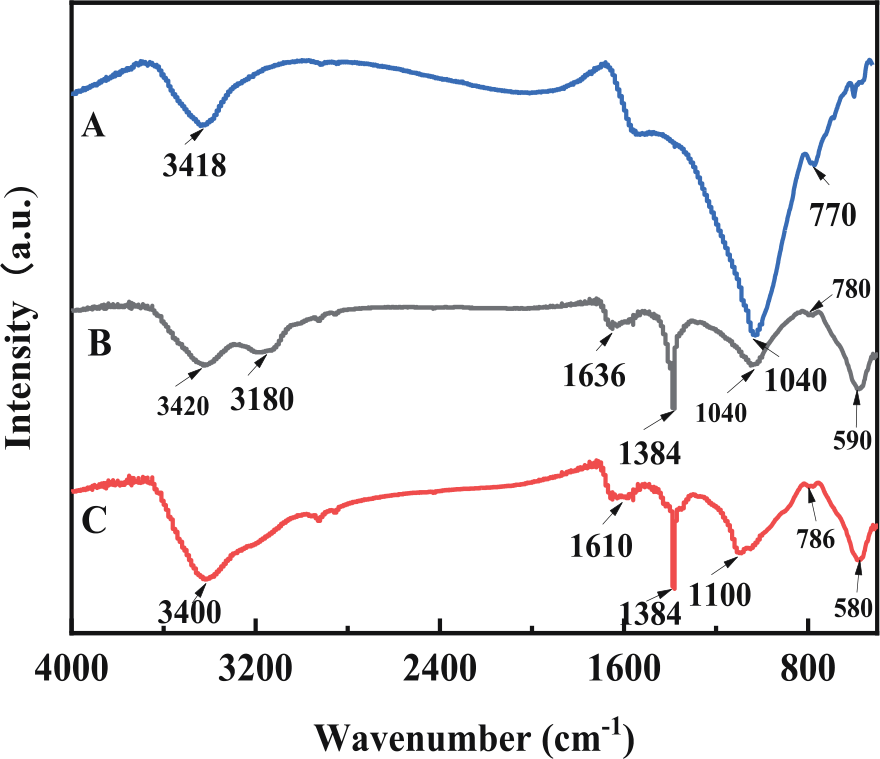
The characterizing functional groups on the surface of GWBC (Fig. 10A), P/Fe3O4@GWBC before (Fig. 10B) and after (Fig. 10C) Cr (Ⅵ) adsorption were shown in Fig. 10. Compared to GWBC, the new peak at 590 cm-1 was attributed to Fe-O-Fe [49], indicating the existence of Fe3O4; meanwhile, the peak at 1384 cm-1, 1636 cm-1 and 3180 cm-1 was corresponded to the CN stretching of the amide group, CONH in PEI, and N-H stretching of amine group [50-52], indicating the successful loading of Fe3O4 and PEI on GWBC. Additionally, the peak of O-H at 3420 cm-1 was amplified. After Cr (Ⅵ) adsorption, the peak of NH was reduced obviously, while the peak of -OH and Fe-O-Fe shifted to 3400 cm-1 and 580 cm-1, respectively, revealing their involvement in the interaction with Cr (Ⅵ).
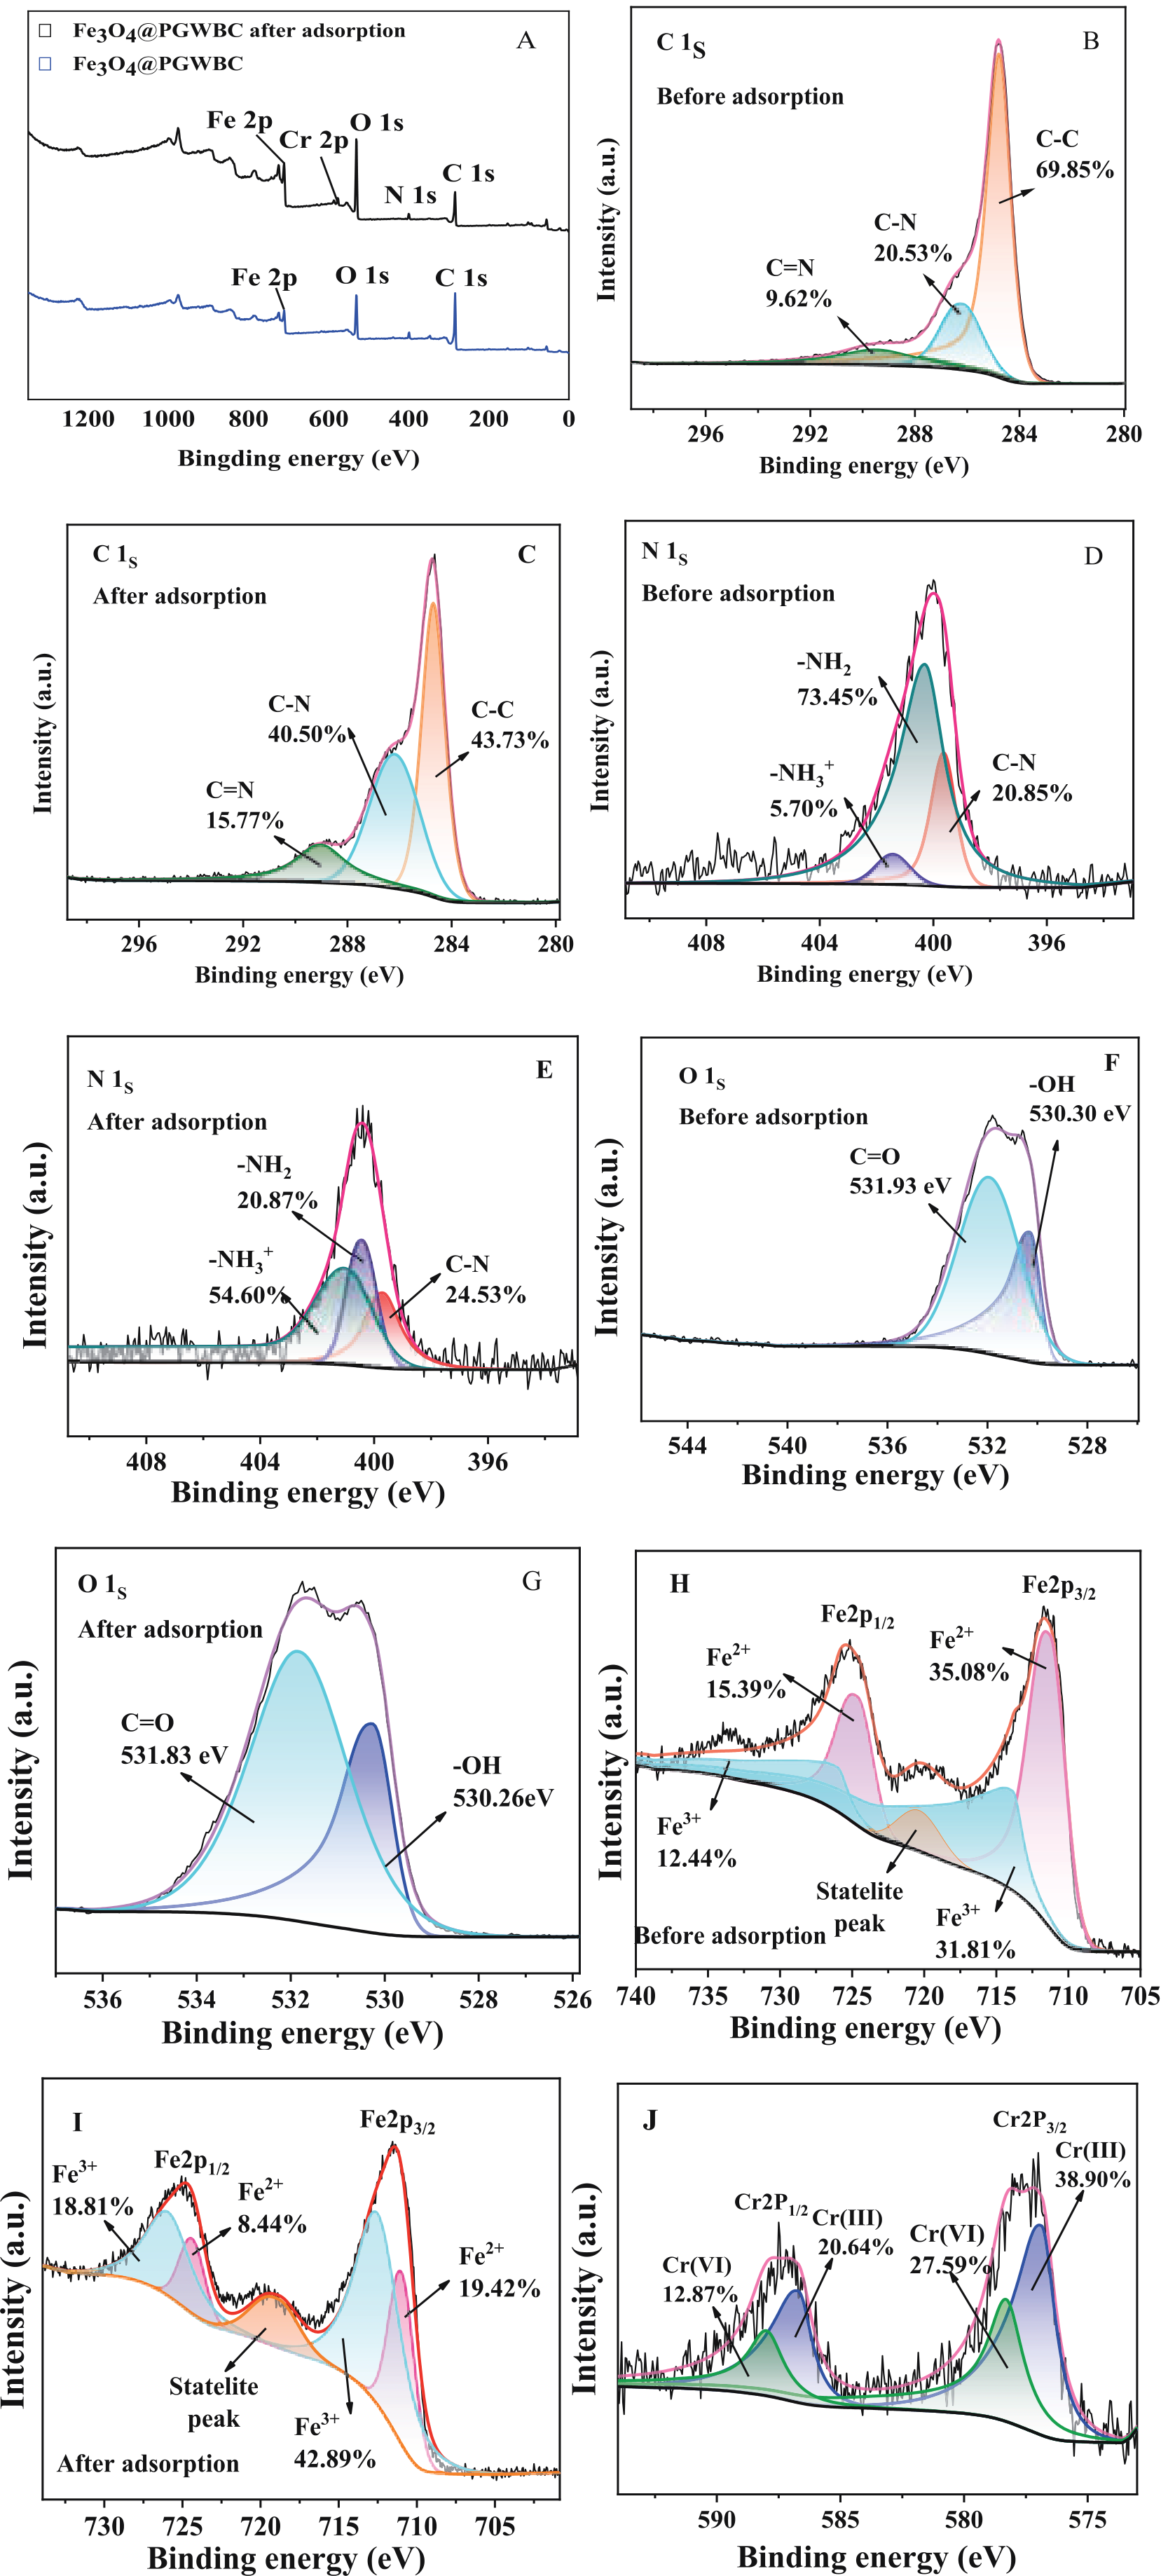
XPS was used to examine the component of P/ Fe3O4@GWBC before and after the adsorption of Cr (VI). The full XPS spectrum is shown in Fig. 11A, and the peaks of Cr2p appeared after adsorption, confirming that Cr (VI) is adsorbed successfully.
Table 5.
Thermodynamic parameters of Cr (Ⅵ) adsorption by P/Fe3O4@GWBC.
| T (K) | ΔG0 (kJ/mol) | ΔH0 (kJ/mol) | ΔS0 (J·mol-1·K-1) | |
|---|---|---|---|---|
| Cr(Ⅵ) | 288K | -1.433 | 5.544 | 24.266 |
| 298K | -1.654 | |||
| 308K | -1.918 |
Fig. 9.
The effect of coexisting ions on adsorption of Cr (Ⅵ) by P/Fe3O4@GWBC (T=298K, pH=4, C0=50 mg/L).
As shown in Fig. 11B,C the peaks at 284.78, 286.19, and 289.46 eV moved to 284.70, 286.18, and 289.01 eV, corresponding to C-C, C-N, and C=N, respectively [53- 55]. The peaks of the C1s XPS spectrum were shifted after adsorption (Fig. 11C), indicating the participation of the carbon functional group into the Cr (Ⅵ) adsorption. Fig. 11D showed that N 1s spectra contained three peaks at 399.64, 400.3 and 401.43 eV, which corresponded to C-N, -NH2, and -NH3+, respectively [56-58], indicating the presence of Polyethyleneimine. After adsorption, the peak area of -NH2 decreased from 73.45% to 20.87%; meanwhile, the peak area of -NH3+ increased from 5.70% to 54.6%, as shown in Fig. 11E. Hence, the results substantiated the amine groups were protonated successfully, which was conducive to attracting Cr (VI) with a negative charge, which can be described by Eqs.9. The peaks at 530.3 and 531.93 eV (Fig. 11F) moved to 530.26 and 531.83 eV (Fig. 11G), corresponding to -OH and C=O respectively (Fig. 11F) [59, 60]. Fig. 11H and Fig. 11I showed the Fe2p high-resolution XPS spectra of P/Fe3O4@GWBC before and after Cr (VI) adsorption. Two peaks at 711.29 and 724.65 eV are attributed to Fe 2p3/2 and Fe 2p1/2 orbitals of Fe2+, respectively [61], and a satellite peak of Fe2+ at 720.36 eV before adsorption. Two peaks at 713.89 and 726.02 eV correspond to Fe 2p3/2 and Fe 2p1/2 orbits of Fe2+ [62, 63]. After adsorption, the peaks attributed to Fe3+ and Fe2+ shifted, and a new satellite peak emerged, indicating that the iron-containing group participated in the adsorption of Cr (VI). The peak area of Fe3+ increased from 44.25% to 61.70% after adsorption, whereas the peak areas of Fe2+ declined from 55.75% to 38.30%. Therefore, as a reductant, the Fe2+ in P/Fe3O4@GWBC reduced Cr (VI) into Cr (III), which can be stated by the following Eqs. 10, 11.
Fig. 11J showed that the peaks at 576.87 eV and 586.71 eV attributed to 2p3/2 and 2p1/2 of Cr (III) [64], and its peak areas increased from 0 to 59.54% after Cr (VI) adsorption. Peaks of 578.3 eV and 588 eV corresponded to 2p3/2 and 2p1/2 of Cr (VI) [65] and accounted for only 40.46% of total Cr, indicating the chelation and reduction of Cr (VI) into Cr (III) with P/ Fe3O4@GWBC.
Conclusions
Polyethyleneimine-modified magnetic biochar (P/ Fe3O4@GWBC) was prepared in the optimal way determined in this study, and the prepared composite was used to carry out static Cr (VI) removal experiments. The findings showed that Cr (VI) removal by P/Fe3O4@ GWBC was pH-dependent, and Cr (VI) adsorption dropped from 37.6 mg/g to 2.2 mg/g as the solution pH rose from 2 to 9. The thermodynamic exploration indicated that the adsorption process was spontaneous and endothermic, and the pseudo-second-order kinetics model described it better than the other two models. Langmuir's model was better than the Freundlich model to fit the experimental data. The greatest theoretical Cr (VI) adsorption capacity obtained from the model was 52.6 mg/g, which was greater than the other 10 types of composites collected from the existing documents. All three anions weakened Cr (VI) removal in the order of PO43->SO42->Cl-, indicating the impact of anions was positively correlated with the charge and concentration. Based on the studies above, electrostatic adsorption, ion exchange, chelation, and Cr (VI) reduction by Fe2+ were proposed as the primary processes for Cr (VI) removal.
Fig. 11.
The full XPS of P/Fe3O4@GWBC before and after Cr (VI) adsorption (A), the detail survey of C1S before (B) after Cr (VI) adsorption (C), N1S before (D) after Cr (VI) adsorption (E), O1S before (F) after Cr (VI) adsorption (G), F2p before (H) after Cr (VI) adsorption (I), Cr2p after Cr (VI) adsorption (J).