

Introduction
During his visit to Xinjiang in July 2022, General Secretary Xi Jinping stressed the need to correctly handle the relationship between economic and social development and ecological environmental protection and to accelerate high-quality economic development. Due to the arid climate and the prominent problem of water resource limitation, coupled with a long-standing rough development mode and insufficient protection of the ecological environment, the phenomenon of overloading resources and environmental carrying capacity in arid zones is widespread. As a result of the arid climate, the problem of water resource constraints has become prominent, which, together with the long-standing model of rough development and the lack of attention to ecological and environmental protection, has led to the prevalence of overloading of the carrying capacity of resources and the environment in arid zones. Resource development and environmental protection are incompatible with today’s rapid socio-economic development and have become important factors hindering high-quality development in arid zones. In order to achieve high-quality development, the background conditions of available resources should be researched in order to allow adaptation to local conditions, address the misallocation of resources, and accelerate the construction of a new development pattern.
Resource and environmental carrying capacity pertain to the maximum economic scale or population scale that can be carried by an area while maintaining sustainable processes on a natural basis [1]. In line with the study of sustainable development, the study of the RECC has developed from a single study of land resources [2, 3] and water resource carrying capacity [4–7] to a comprehensive study of the environment [8–10], ecology, and even the RECC. Research into the comprehensive carrying capacity of resources and the environment can be seen in William Fugate’s ‘The Road to Survival’ (published in 1948). For the inaugural instance, the publication introduces the term “ecological imbalance” to denote the ecological shifts resulting from excessive exploitation of human resources and the environment. Furthermore, it explicitly introduces the notion of regional carrying capacity, aimed at delineating the regional resources and environmental capabilities capable of sustaining a population and facilitating economic development [11]. China’s involvement in research on regional carrying capacity as the object of resource and environmental factors began in the 1990s, and scholars attempted to assess the regional RECC from the perspectives of natural resource support, environmental production support, and socio-economic and technological levels by constructing a comprehensive evaluation model [12–14]. A study area is dominated by the carrying capacity of typical ecosystems, such as ecologically fragile areas, urban areas, and watersheds [15–17]. The research content is often combined with national policy guidance, focusing on ecological civilization construction [18], territorial spatial planning [19], and sustainable development strategies [20]. In terms of research methodology, the method of weighted calculation of a number of indicators has been widely used recently, based on the theory of ‘pressure-state-response’ [21, 22]. Research into system dynamics models [23, 24], neural networks [25], and other complex models is also relatively rich, but it has not solved the problem of the physical meaning of the RECC.
With the continuous breakthroughs in research methods and perspectives, scholars are placing increasing emphasis on the study of driving factors of resource and environmental carrying capacity, seeking key controlling factors to reveal the mechanism of carrying capacity. Researchers have selected administrative units of different scales or regions, such as mountainous areas and river basins, as the study areas and used econometric or statistical methods to analyze the driving factors of water and soil resources [26, 27], ecological environment [28–30], and comprehensive resource and environmental carrying capacity [31, 32]. Scholars like Xu Yong have classified natural carrying bodies according to different terrain types and calculated the sensitivity of influencing factors of carrying capacity in different regions of China, which has milestone significance for the study of driving factors of resource and environmental carrying capacity [33]. With the development of geographic information technology, the geographic weighted regression (GWR) model has gradually been applied to the spatial relationship research of carrying capacity and its driving factors [34]. Compared with classical statistical methods, GWR can accurately describe the spatial differentiation characteristics of specific variable relationships [35]. Sun Yu and other scholars used the geographically weighted regression model to study the spatial autocorrelation of comprehensive land carrying capacity and the spatial non-stationarity of influencing factors in the Beijing-Tianjin-Hebei urban agglomeration area, providing a reference for research on land comprehensive carrying capacity based on spatial econometrics methods in other regions [36]. However, currently, most studies focus on the analysis of the influencing factors of single carrying capacity, such as land carrying capacity [37, 38], and fewer related studies are using GWR to explore the impact of driving factors on comprehensive resource and environmental carrying capacity [39].
Previous studies often adopted the method of weighing all indicators to calculate a composite index. However, the evaluation value obtained is a representation value, which ignores the real-world significance and physical equilibrium significance. To address the issue of unclear physical significance in evaluating resource and environmental carrying capacity using the aforementioned methods, this study constructed a three-dimensional tetrahedral model with physical equilibrium significance. Based on the restrictive evaluation of water and soil resources and the ecological environment, combined with the evaluation of habitat suitability and adaptability to social and economic development, the model adopts a research approach of “classification of habitat suitability zones – classification of resource carrying capacity restrictions – classification of adaptability to social and economic development – grading of comprehensive resource and environmental carrying capacity warning levels.” An empirical evaluation of the resource and environmental carrying capacity status in the Xinjiang Uygur Autonomous Region (referred to as Xinjiang hereafter, excluding the Xinjiang Production and Construction Corps) is conducted. Additionally, combined with the Geographic Weighted Regression model, the study quantitatively explores the spatial heterogeneity of influencing factors on the resource and environmental carrying capacity in Xinjiang. The aim is to provide more precise information support for the sustainable development of resources and the environment in Xinjiang and enrich the application of the Geographic Weighted Regression model in driving factors of resource and environmental carrying capacity.
Materials and Methods
Study Area
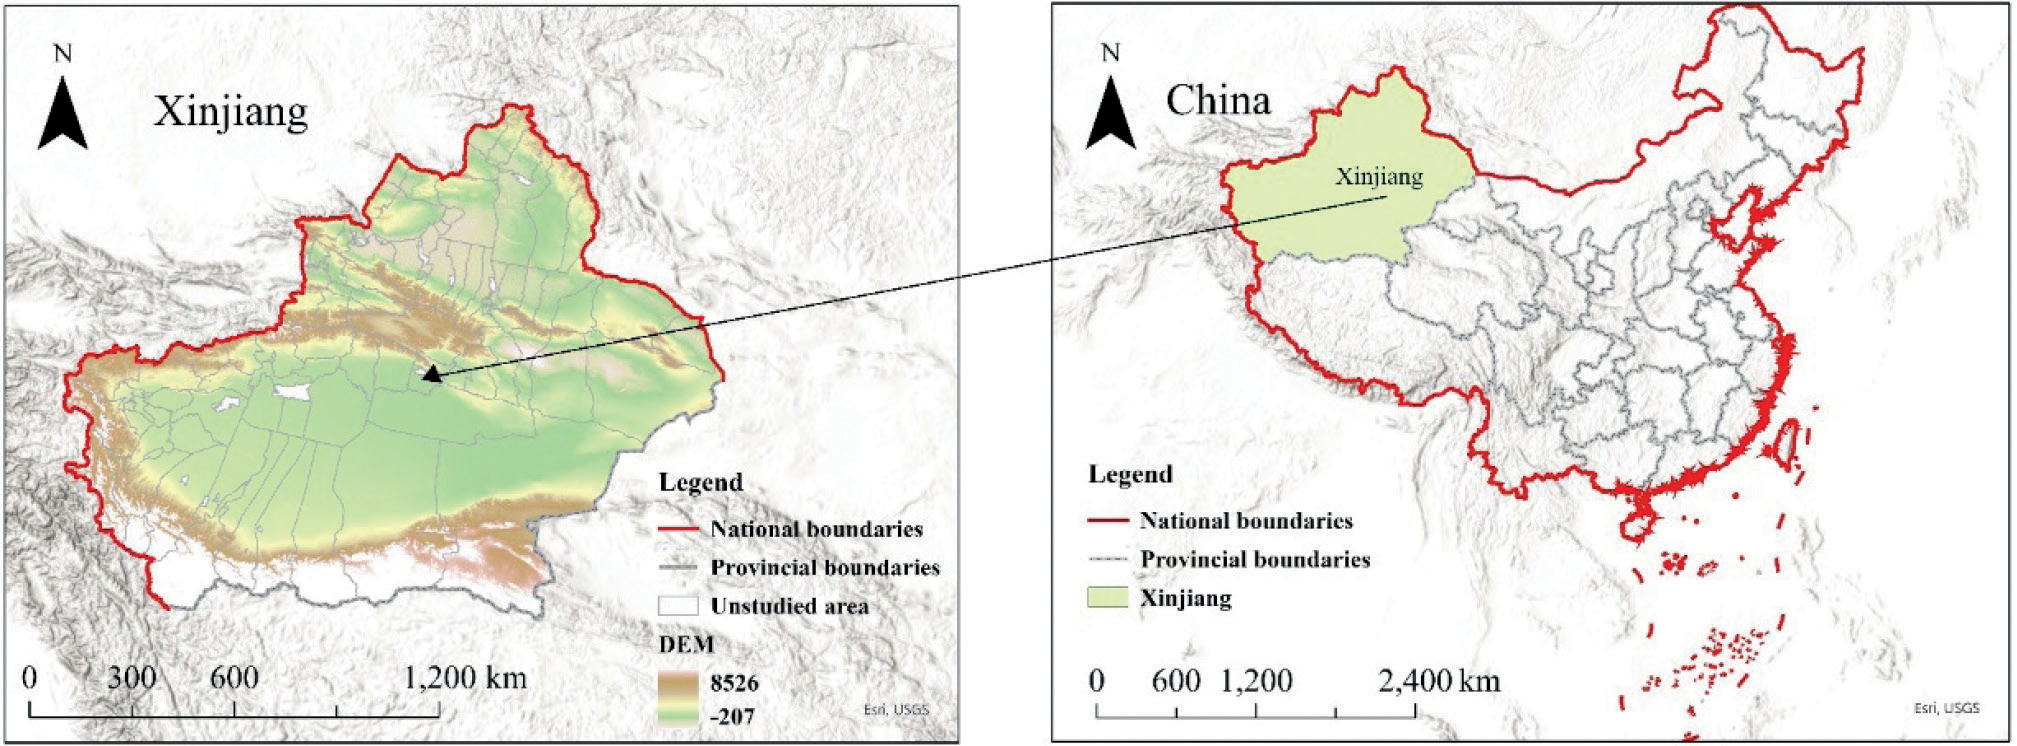
Xinjiang is located in the hinterland of the Asian-European continent, with a total area of 166.49 km2 (Fig. 1). Due to its rich resources and unique natural environment, it has become an important economic growth point in China. Xinjiang, characterized by an average annual precipitation of 130 mm and an annual evaporation exceeding 1000 mm, exemplifies a typical arid and semi-arid region. Based on climatic factors, the natural conditions are rigorous, and the ecosystem exhibits relative fragility. As economic development and urbanization accelerate, the ecological environment of Xinjiang has been damaged, and problems such as the degradation of grasslands, the expansion of deserts, and the decline of wildlife have attracted widespread attention [40]. The development of resources in Xinjiang also faces many challenges, with overexploitation and the irrational use of resources leading to ecological problems such as desertification and land sanding, which seriously threaten the sustainable development of the region. At the same time, water resources in Xinjiang are under great pressure [41, 42]. With the construction of the Silk Road Economic Belt, the demand for resources will be further exacerbated, bringing new challenges to resource utilization and the ecological environment in Xinjiang. Therefore, the study of the RECC in Xinjiang has become an important issue in the region.
Methodology
Following the research idea of ‘human settlements suitability zoning – resource carrying restriction classification – socio-economic development adaptability grading – resource environmental carrying capacity warning grading’, a comprehensive resource and environmental carrying index (RECCI) model based on the human settlements suitability index (HSI), resource carrying restriction index (RCI), and socio-economic development index (SDI) has been established.
The first step, a HSI model based on relief degree of land surface (RDLS), land use, the vegetation index (LVI), the hydrological index (HI), and the temperature and humidity index (THI), was established to complete the evaluation of the suitability of Xinjiang’s human settlements based on a kilometer grid.
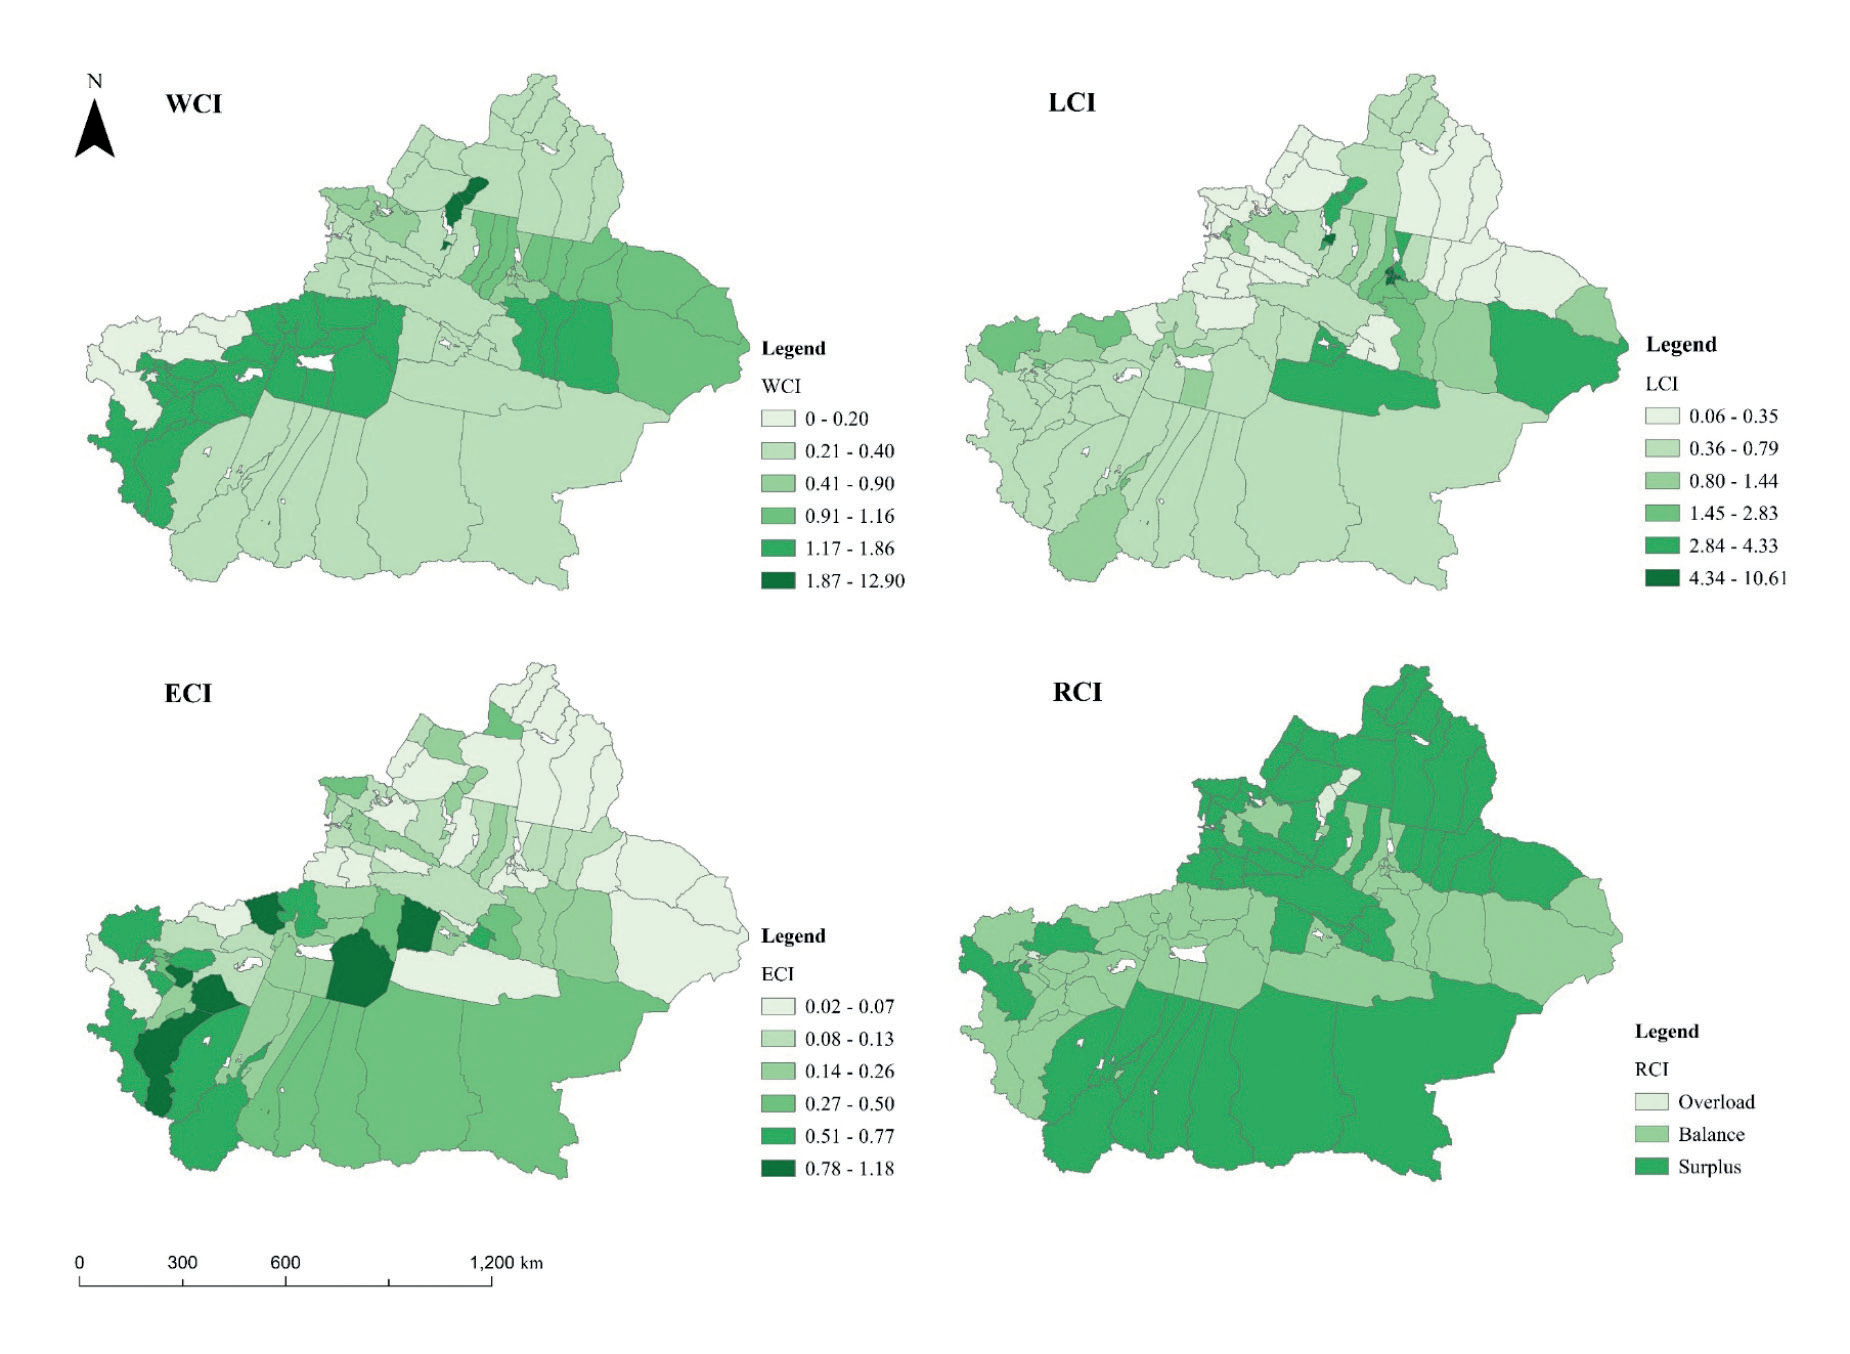
In the second step, an RCI model, based on the land resources carrying index (LCI), water resource carrying index (WCI), and ecological carrying index (ECI), was established to complete the evaluation of the carrying capacity of soil and water resources and the ecological environment of Xinjiang, based on counties.
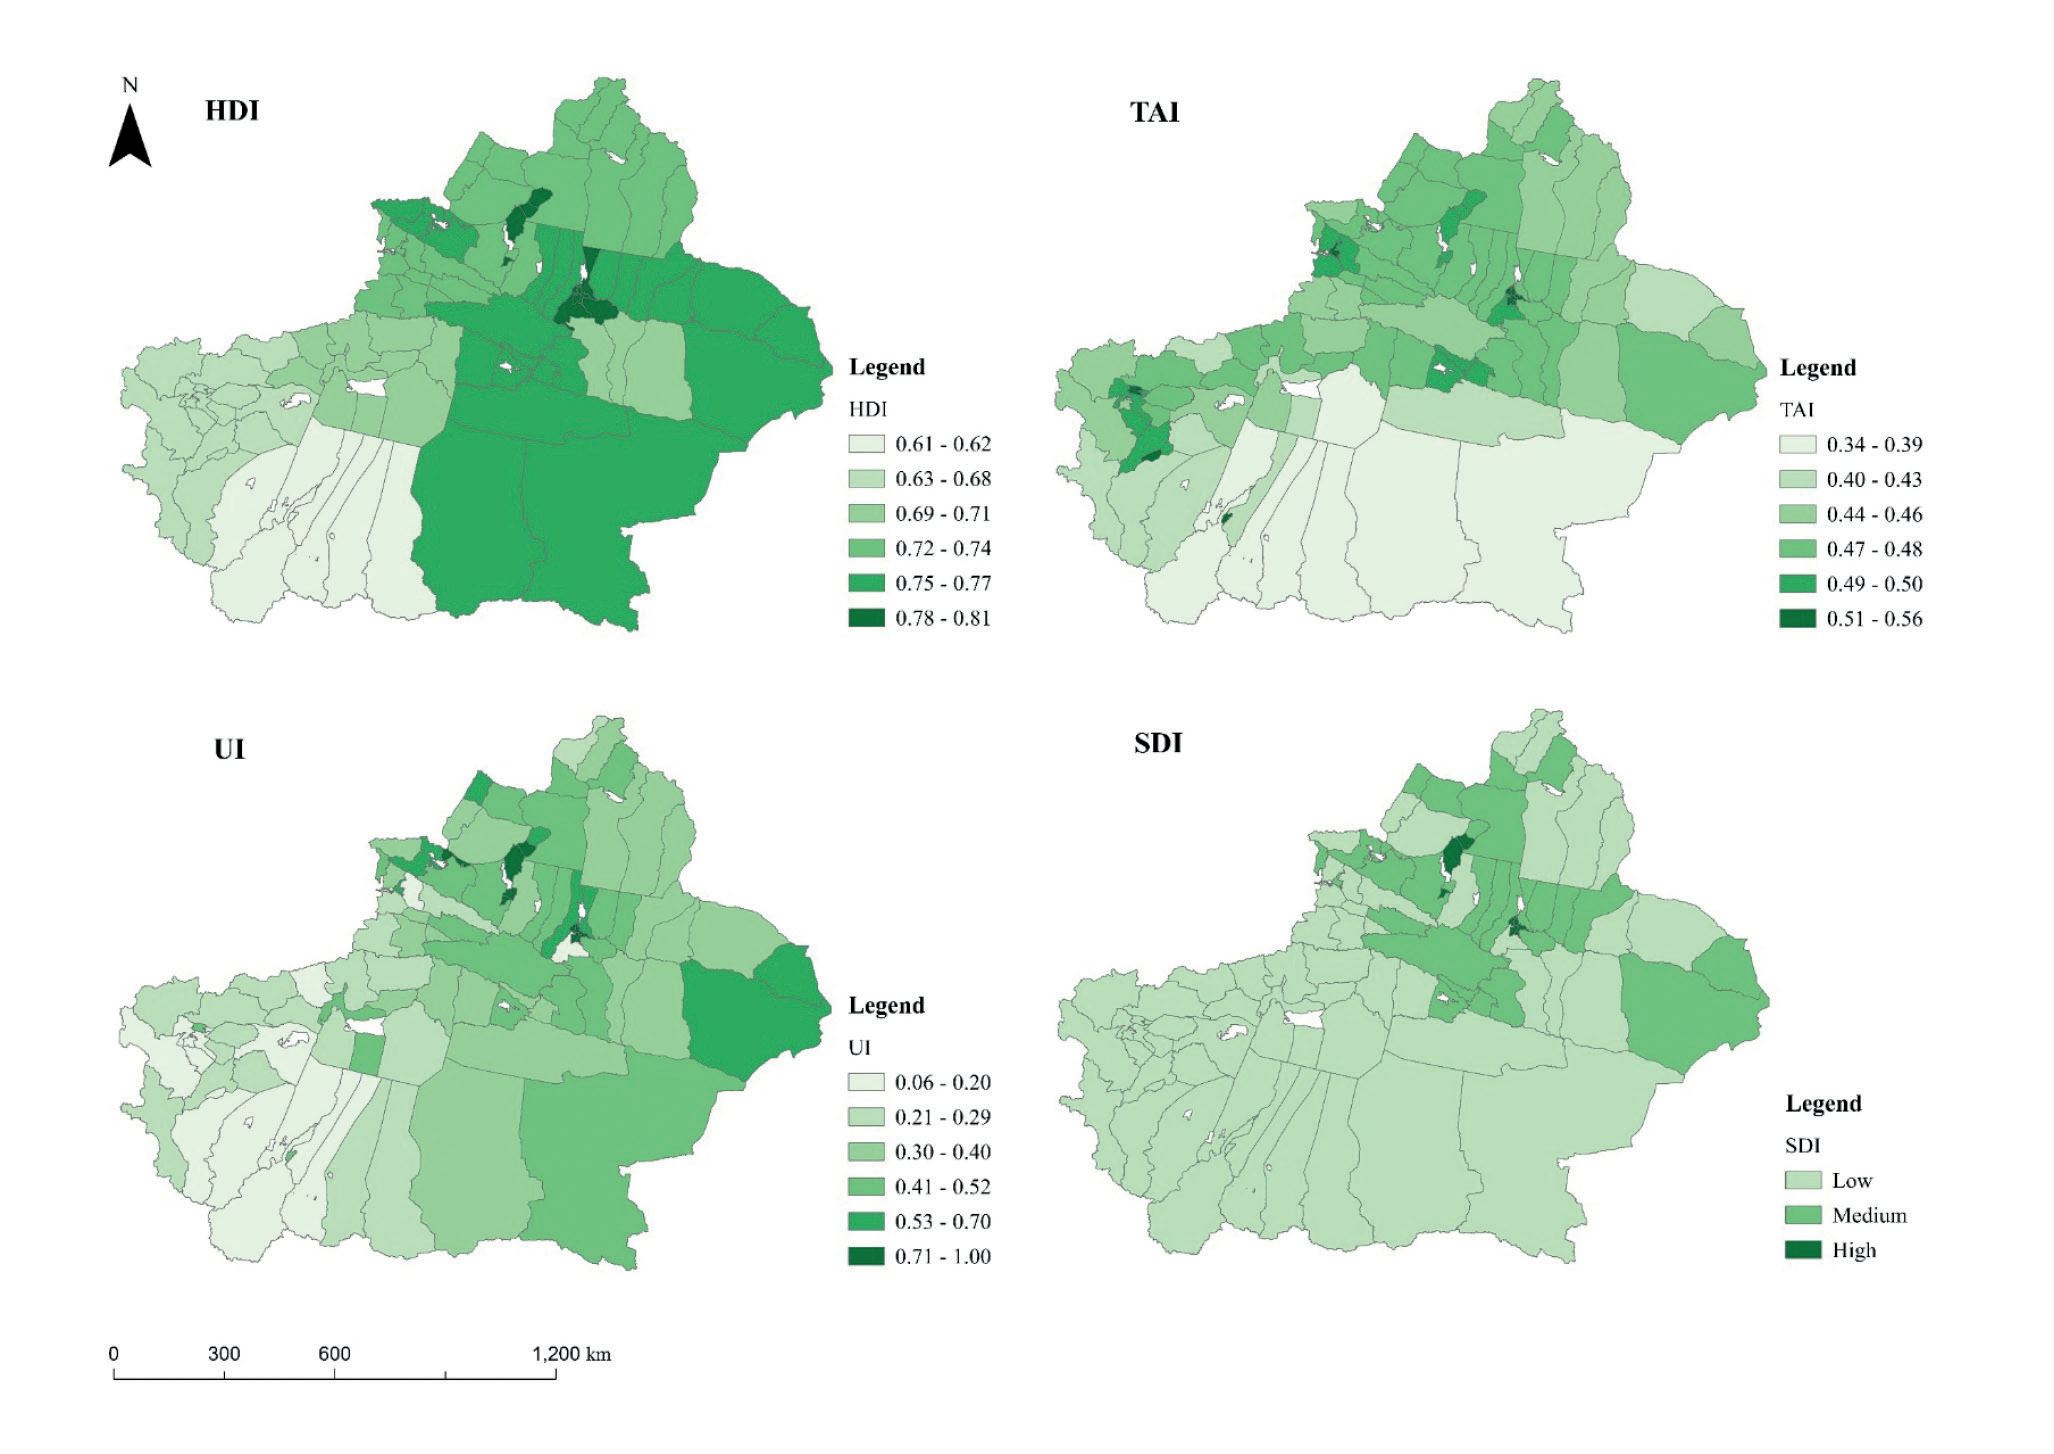
The third step, an SDI model based on the human development index (HDI), transportation access index (TAI), and urbanization index (UI), was established to complete the evaluation of the socio-economic development level of Xinjiang by taking counties as the research unit.
The fourth step is to establish a comprehensive resource and environmental carrying index (RECCI) model based on the HSI, RCI, and SDI, and to complete the comprehensive evaluation of the RECC in Xinjiang and the warning classification.
HSI Model
The human settlements suitability index is a mathematical synthesis of normalized RDLS, LVI, HI, and THI (see Table 1 for the calculation method of each index [43]), and the normalization method is as follows:
Table 1.
Calculation of the sub-indexes of human settlement.
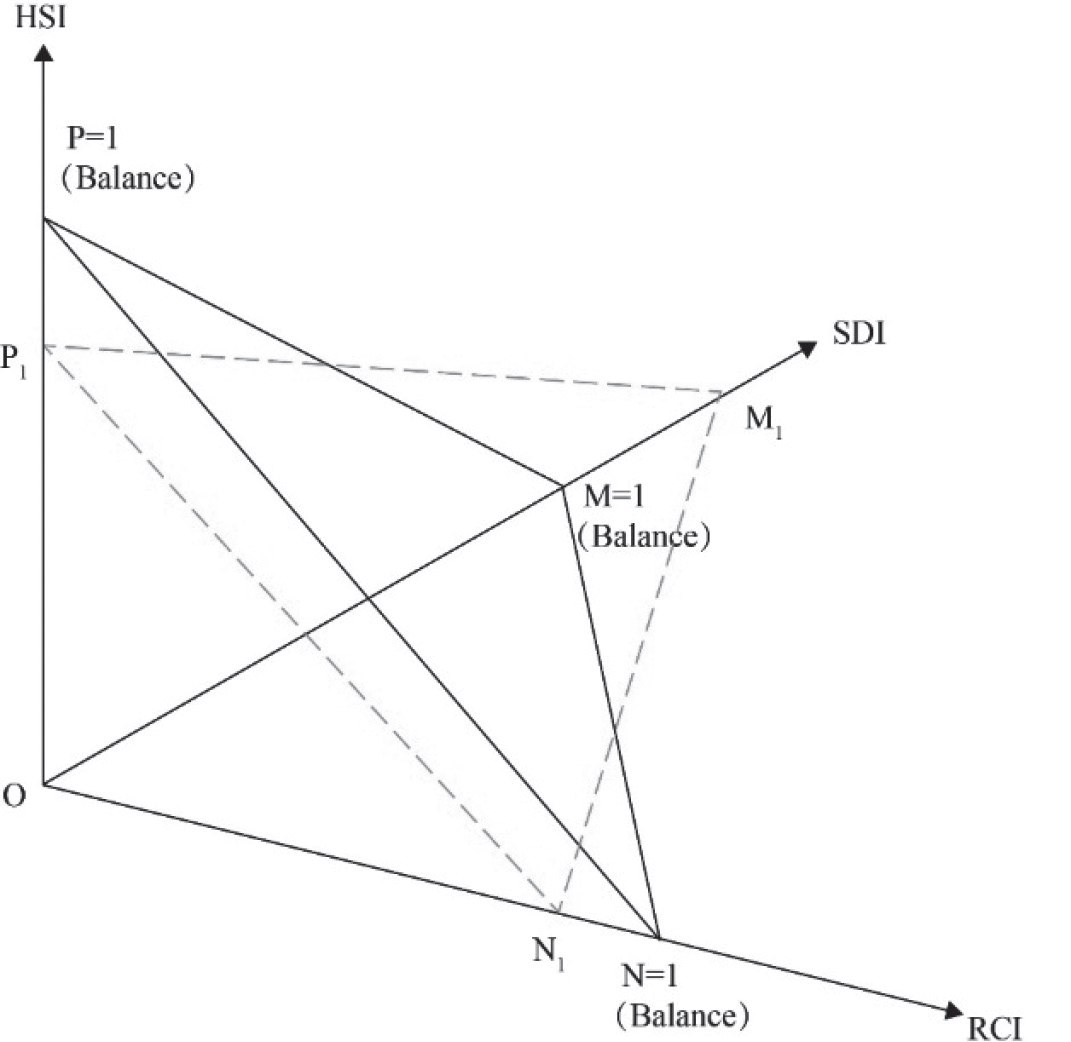
Recognizing the pivotal influence of topographic factors on human settlements, we constructed a triangular model to calculate the HSI. In this model, RDLS is the height, while LVI, HI, and THI collectively form the bottom. (Fig. 2). In order to have an index of 1 at equilibrium, the normalized HSI was leveled, i.e., mean normalized, and its calculation method is given in Eqs. (3)–(6).
In the equations, HSI is the human settlements suitability index after mean normalization; HSIone is the human settlements suitability index after normalization of HSIv by Eq. (1); k is the mean value of HSIone in the study area [43]. V1 is the volume of tetrahedron A1B1C1D1; V0 is the volume of tetrahedron ABCD; OA1, OB1, OC1, and OD1 are the actual values of the land use and vegetation index, the hydrological index, the temperature and humidity index, and the relief degree of the land surface normalized, respectively; OA, OB, OC, and OD are the normalized standard values of the land use and vegetation index, the hydrological index, the temperature and humidity index, and the relief degree of the land surface, respectively, and all are equal to 1.
Due to the large amount of data in the human settlements suitability sample based on the kilometer grid data, this study used the mean standard deviation grading method, which can maximize the difference between the values of the elemental attributes and the mean (Table 2). When HSI=1, it represents the average state of regional human settlements, and STD is the standard deviation of HSIone of the study area.
RCI Model
The resource carrying restriction index (RCI) is a mathematical amalgamation of the LCI, WCI, and ECI (Table 3 [44–46]). It is employed to depict the comprehensive carrying status of soil and water resources, along with the ecological environment at a regional level.
When the indices are fused, the excess or deficiency of the carrying status of one type of resource can cause information coverage on the carrying status of other types of resources. To eliminate this effect, this paper adopts the hyperbolic tangent function (tanh) to normalize the inverse of each carrying index. (Fig. 3).
Regarding the values of the weights WL WW WE, this paper divides them into three stages according to the ratio of urban population according to the mainstream research on the international urbanization process [47] and assigns numerical values to the three weights according to the actual process of urbanization in Xinjiang county-level administrative districts (Table 4). The specific calculation method for the resource carrying restrictions index is as follows:
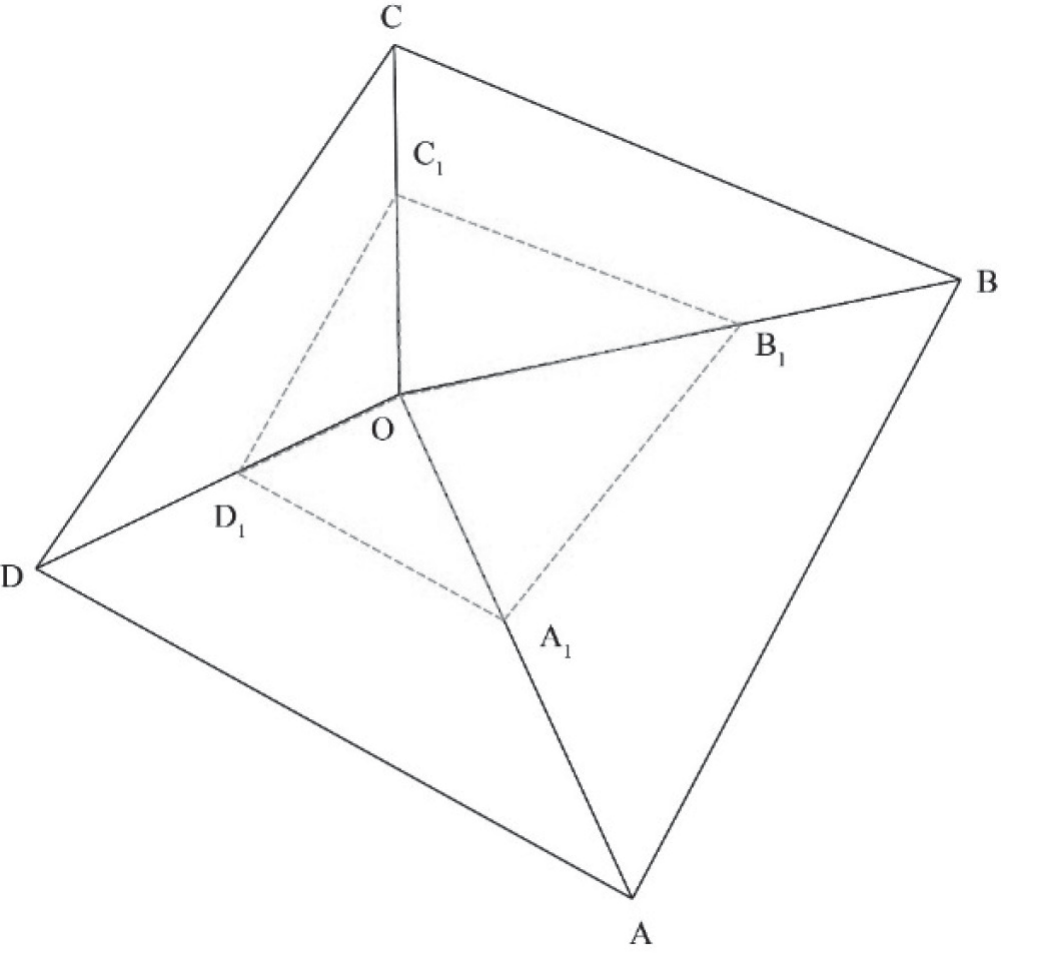
Table 2.
Human settlements suitability zoning criteria.
| Suitability zoning | Range of values |
|---|---|
| Unsuitable area | HSI < 1 – 0.5STD |
| Critical suitable area | 1 – 0.5STD ≤ HSI < 1+0.5STD |
| Suitable area | HSI ≥ 1 + 0.5STD |
When RCI = 1, this indicates the theoretical equilibrium state of resource carrying. According to a summary of previous studies, the resource carrying state is divided into three types of restrictions (Table 5).
SDI Model
Assessing socio-economic resilience typically entails a comprehensive examination of the overall advancement in regional economic, social, and infrastructural aspects. The socio-economic development index (SDI) combines three key indicators: the HDI, the TAI, and the UI. By combining these indices, the resilience of a region’s socio-economic development can be assessed holistically, reflecting not only the quality of life but also the level of accessibility and urban development, and the calculation of each index is shown in Table 6 [48].
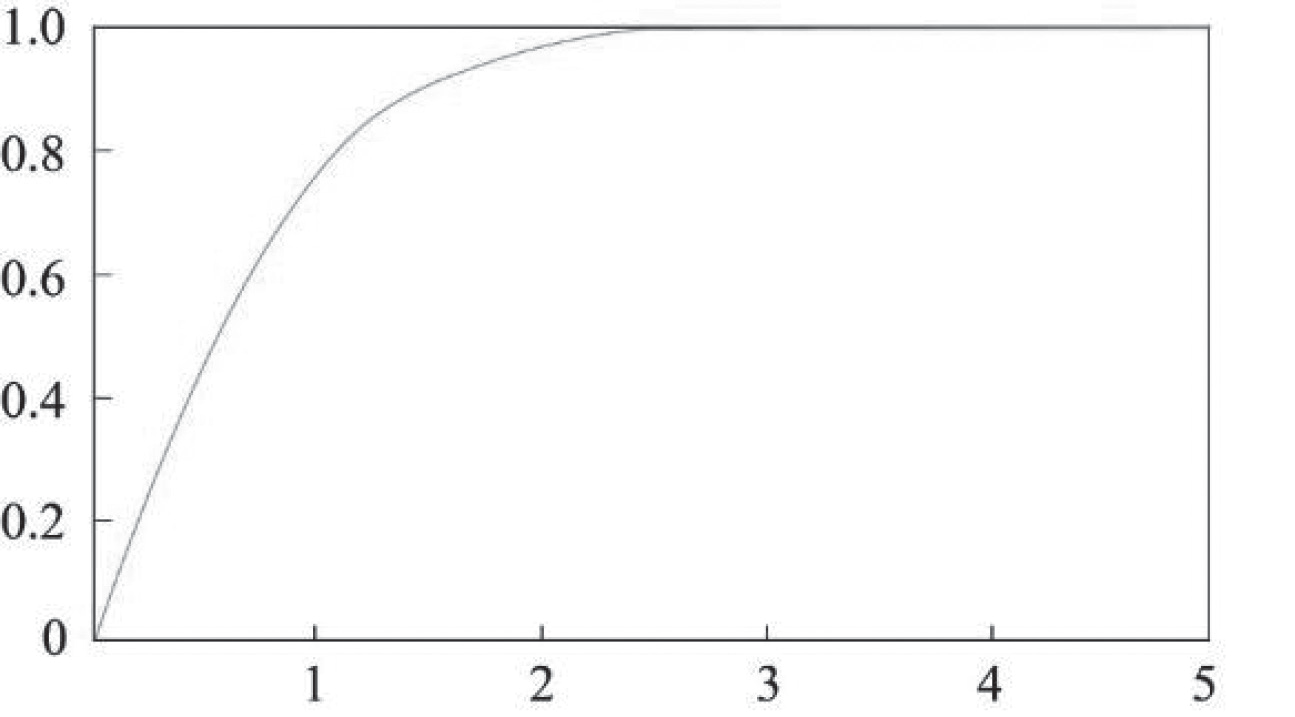
Table 3.
Calculation of the sub-indexes of resources carrying capacity.
Table 4.
Weights of three carrying indexes.
| Urbanization phase | Percentage of urban population | WL | WW | WE |
|---|---|---|---|---|
| Beginning stage | [0-30%] | 0.5 | 0.3 | 0.2 |
| Accelerated Stage | (30-70%] | 1/3 | 1/3 | 1/3 |
| Late Stage | (70-100%] | 0.2 | 0.5 | 0.3 |
Table 5.
Classification of the carrying capacity.
| Restricted classification | Range of values |
|---|---|
| Overload | RCI < 0.9 |
| Balance | 0.9 ≤ RCI < 1.1 |
| Surplus | RCI ≥ 1.1 |
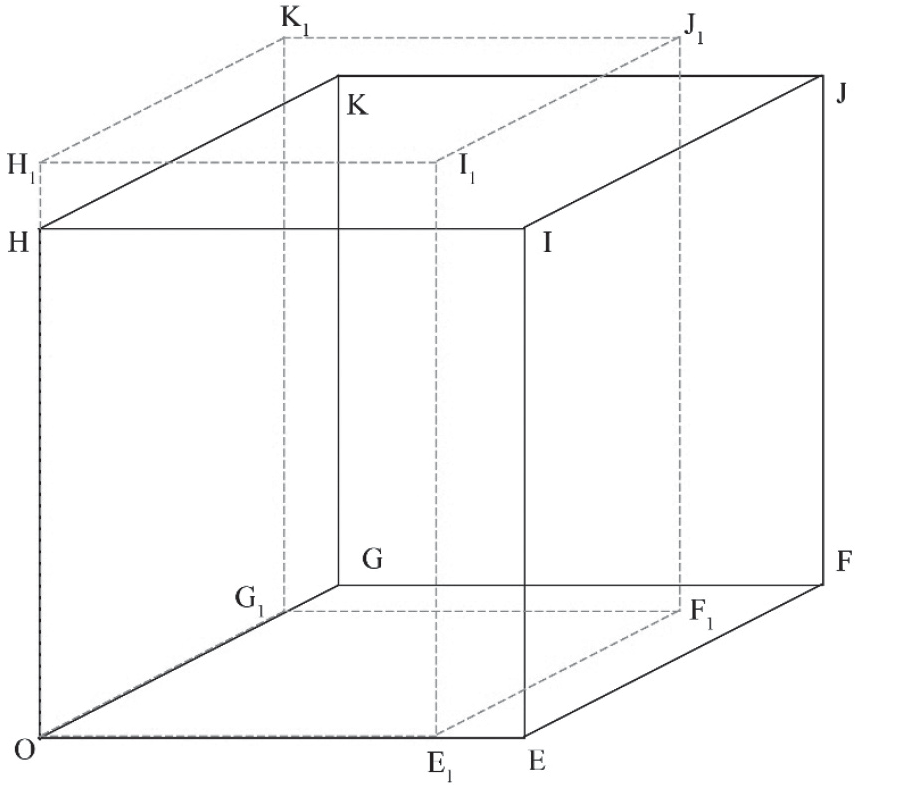
In order to reduce the coverage of the extremes of other indexes by each sub-index, this study establishes a 3D tetra model for the fusion (Fig. 4) and the mean normalization of the normalized HDI, TAI, and UI, and the calculations are as follows:
In the equations, SDI is the socio-economic development index after mean normalization; SDIone is the SDI after SDIv is normalized according to Eq. (1); k is the mean value of SDIone at the county level; V0 and V1 represent the volumes of the cubes OEFGHIJK and OE1F1G1H1I1J1K1, respectively; OE1, OG1, and OH1 are the actual values of HDI, TAI, and UI, respectively, after normalization; and OE, OG, and OH are the standard values of HDI, TAI, and UI, respectively, all of which are 1 after normalization.
When SDI=1, it indicates the average state of socioeconomic development of county-level administrative districts in Xinjiang. STD is the standard deviation of the SDIone of the study area. The difference between the values of the attributes of the elements and the mean is shown maximally through the mean standard deviation grading method (Table 7).
RECCI Model
The comprehensive resource and environmental carrying capacity index (RECCI) is based on a 3D tetra model that integrates the three criteria layers of the HSI, RCI, and SDI to quantitatively evaluate the RECC of county-level administrative districts (Fig. 5). When the RECCI is 1, it means that the RECC of county-level administrative districts in Xinjiang is in a balanced state. The specific calculation methods are as follows:
Table 6.
Calculation of the sub-indexes of socio-economic development.
In the equations, RECCI is the resource-environmental carrying index; V0 and V1 represent the volumes of tetrahedra OXYZ and OX1Y1Z1, respectively; OX1, OY1, and OZ1 are the actual values of HSI, RCI, and SDI, respectively; and OX, OY, and OZ are the standardized equilibrium values of HSI, RCI, and SDI, respectively, which are all equal to 1.
When RECCI = 1, it indicates the theoretical equilibrium state of the RECC of county-level administrative districts. According to the research of Mr. Feng Zhiming [49], combined with the actual carrying capacity level in Xinjiang, the comprehensive carrying state of resources and the environment is divided into three warning levels (Table 8).
GWR Model
The traditional Ordinary Least Squares (OLS) regression model assumes that the variables are homogeneous and fails to detect the spatial heterogeneity manifested by their influencing factors. The geographically weighted regression model proposed by Brunsdon [27] and Fotheringham [28] is based on different spatial bandwidths and kernel functions, combined with the Generalized Least Squares (GLS) method, in order to reveal spatial non-stationarity among the variables, and its expression is given in Eq. (18).
In the equation, (ui, vi) is the geographical coordinate of the ith county-level administrative region in Xinjiang; βk (ui, vi) is the regression parameter of the kth explanatory variable of i; β0 (ui, vi) is a constant term; m is the number of explanatory variables; and εi is the random error.
The selection of the spatial weighting function holds the utmost significance in geographically weighted regression (GWR) models. This function is employed to quantify the level of geospatial correlation, and its pivotal role extends to the precise estimation of model parameters. A fixed Gaussian function usually describes the weights of a geographic neighborhood in terms of a fixed standard deviation, while an adaptive quadratic function adjusts the weights according to the variation of distances between individuals in the geographic neighborhood. This paper compares the two to choose the best spatial weight function. Their expression is as follows:
Table 8.
Classification criteria for resource and environmental comprehensive carrying capacity.
| Indicator colors | Warning state | Range of values |
|---|---|---|
| Red | Overload | RECCI < 0.9 |
| Yellow | Balance | 0.9 ≤ RECCI < 1.1 |
| Green | Surplus | RECCI ≥ 1.1 |
In the equations, b denotes the bandwidth; dij denotes the distance between the sample point j and the regression point i; and Wij is the weight. The fixed Gaussian function is a continuous monotonically decreasing function, which can represent the decay speed of the weight when the distance increases.
In this paper, the AICc statistic is used to compare the two models, and when comparing the models, the smaller the AICc, the better the fit is.
Data Sources and Processing
Human settlement data included meteorological data, a digital elevation model (DEM), a normalized vegetation index (NDVI), land use data, and water network and lake data. Among them, the DEM was from the global 30 m resolution DEM data released by NASA, and the NDVI and land use data were from the Resource and Environment Science Data Centre of the Chinese Academy of Sciences. Meteorological data, such as temperature, relative humidity, and precipitation, were obtained from the Earth Resources Data Cloud Platform. The water network distribution data were converted to a 1 x 1 km raster scale by constructing a 1 x 1 km fishnet and using spatial analysis tools, such as ’intersect’, to calculate the density of the water network in the grid. Due to different data sources, the data in this paper were unified as Krasovsky_1940_Albers projection coordinates.
The data in resource carrying capacity studies mainly included water resource availability, per capita water consumption, crop production, net primary productivity (NPP), ecological consumption, and other data. The data on water resource availability, per capita water consumption, crop production, etc. were obtained from the Xinjiang Statistical Yearbook, and the NPP was obtained from MODIS data, released by the United States Geological Survey (USGS), which was mosaicked and projected to obtain the ecological supply (SNPP) data of Xinjiang county-level administrations after spatial statistics. The ecological consumption data were obtained from the agricultural and livestock production data in the Xinjiang Statistical Yearbook, and the biomass and carbon conversion coefficients were used to obtain the ecological consumption (CNPP) data of Xinjiang county-level administrative districts. Population data were obtained from the Seventh Population Census.
Socio-economic development data were mainly related to statistical data on urban population, vector data on roads, railways, waterways, and airports, and data on land use and population density. Among them, the urban population was derived from the results of the Seventh Population Census. Road and railway data were taken from DIVA-GIS, waterways were replaced by 50 m river data from Natural Earth, and road density, railway density, and waterway density were calculated in the same way as the water network density above. The airport data were obtained from OurAirports, and the shortest distance between roads, railways, and airports was calculated by extracting the center point of the grid and then using ‘near analysis’ to calculate the shortest distance from the center point to the three kinds of transport facilities. Land use data was taken from the Resource and Environment Science Data Centre of the Chinese Academy of Sciences (CAS), and the land urbanization index was calculated by calculating the proportion of urban land in each grid.
Results
Human Settlement Suitability Evaluation
On the basis of the analyses of the RDLS, LVI, HI, and THI, we quantitatively evaluated the human settlement suitability of Xinjiang. The evaluation results show that the maximum value of the HSI of Xinjiang reached 1.89, the minimum value was 0.89, and the average value was 1.00 (Fig. 6). The HSI of Xinjiang roughly shows the spatial distribution pattern of ‘Three mountains with high values, two basins with low values’ and the overall distribution is closely related to the topography of Xinjiang.
The unsuitable area for human settlement in Xinjiang comprises 42.34% of the total area, primarily concentrated in the southern region. This spatial distribution follows a ‘one center and one belt’ pattern, with ‘one center’ being the Taklamakan Desert region and ‘one belt’ being the Kunlun-Altun Mountains region. The RDLS in the unsuitable area ranges from 0.00–10.99, with a mean value of 2.08, and there is a large interregional difference in the degree of topographic relief caused by the extreme topographic differences between the Kunlun Mountains and the Taklamakan Desert. The extreme topographic differences of the former lead to a low level of human settlement, while the desert properties of the latter make it unsuitable for human settlement; the land use and vegetation index ranges from 0.00–0.30, with a mean value of 0.01. The land use type of the region consists of large areas of sandy land in the center and low-cover grassland as a ‘belt’. The bare rocky land, sandy land, and Gobi are distributed in a mismatched way in ‘one belt’, accounting for a total of 91.13%, with a low overall vegetation cover. The hydrological index of unsuitable areas ranges from 0.00–0.35, with a mean value of 0.03, and water resources are extremely scarce. The temperature and humidity index are between -2.05~61.26, with a mean value of 50.79, and the annual average is cold and uncomfortable. In summary, the areas that are unsuitable for human settlement in the 14 county-level administrative districts of Xinjiang are mainly restricted by ground cover and hydrological conditions.
The critical suitable area for human settlement in Xinjiang accounts for 36.61% of the total area and is distributed in the outer edge of the desert, valleys, and foothills in the Kizilsu Kirghiz Autonomous Prefecture, the Hotan, the Aksu, the Kashgar Region, and the western part of the Bayingolin Mongol Autonomous Prefecture (as a ‘sporadic patch’). The suitable area for human settlement also includes the city of Hami, the city of Turpan, the Changji Prefecture, Altay Prefecture, and the eastern part of Bayingolin Mongol Autonomous Prefecture, which is distributed on the outer edge of the mountain range. The relief degree of the land surface within the critical suitable area varies between 0.00 and 8.07, with a mean value of 2.91. The land use and vegetation index ranges from 0.00–0.31, with a mean value of 0.03, with most consisting of Gobi, sandy land, low-cover grassland, and bare rocky land, accounting for 79.22% of the total. The proportion of grassland and high-cover grassland is 79.22% in the Tianshan and Kunlun Mountain areas. In the Tianshan Mountains and Kunlun Mountains, the medium-coverage grassland and high-coverage grassland are densely distributed in the form of stars and dots, accounting for 13.92% of the total; the hydrological index ranges from 0.00–0.55 with a mean value of 0.10, and the temperature and humidity index ranges from 15.23–61.02, with a mean value of 44.86.
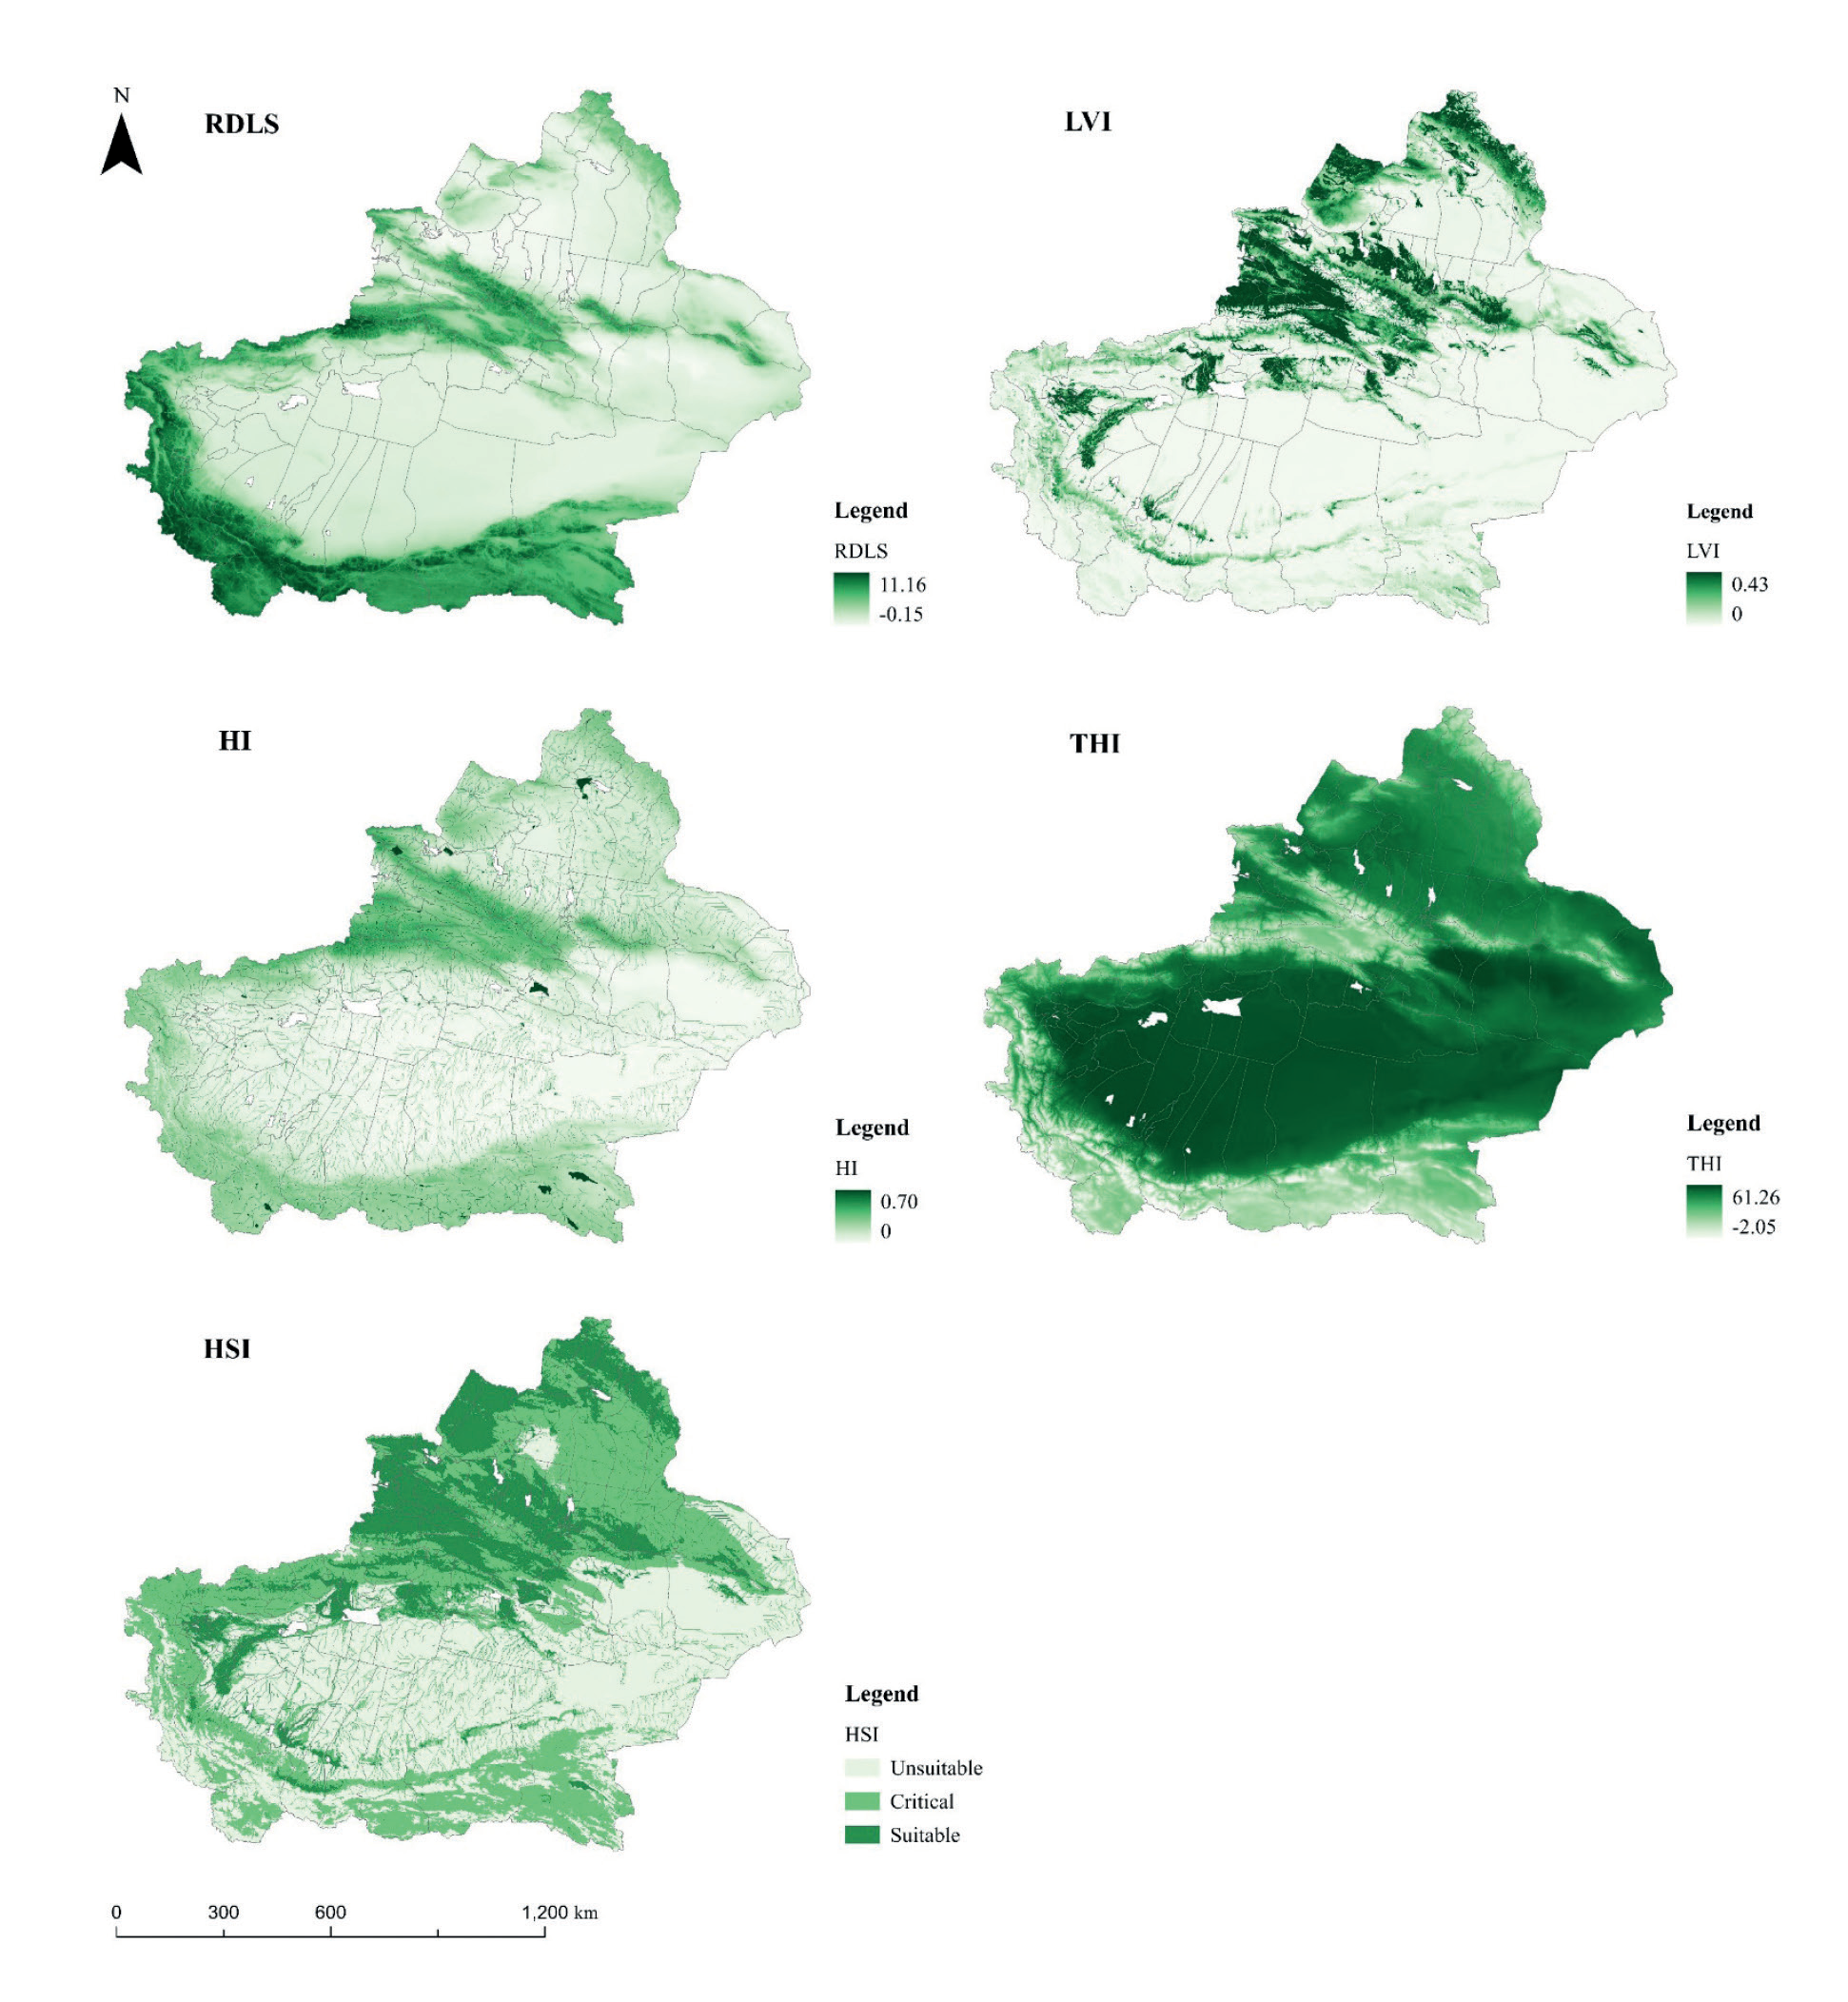
The suitable area for human settlement in Xinjiang accounts for 21.05% of the total area, and it is concentrated in the northern foothills of the Tianshan Mountains, where the climatic conditions are more favorable. There is a discontinuous strip-like distribution in the zone south of the Tianshan Mountains and north of the Taklamakan Desert. The RDLS of the suitable areas ranges from 0.00- 6.80, with a mean value of 2.14. The high-value areas north of the Tianshan Mountains are mainly distributed in the Junggar Basin, which mainly includes the Ili Kazakh Autonomous Prefecture, the Bortala Mongolian Autonomous Prefecture, the Changji Hui Autonomous Prefecture, Urumqi, and Karamay; the terrain is relatively flat and is suitable for humans to carry out production activities. The land use and vegetation index ranges from 0.00–0.43, with a mean value of 0.08. The hydrological index ranges from 0.00–0.70, with a mean value of 0.13, which is a relatively favorable hydrological condition in the study area. The temperature and humidity index ranges from 24.26–61.04, with a mean value of 46.82. Overall, the human settlement-suitable area primarily features grassland, arable land, and a small part of the watershed. Ecological conditions are good.
Resource Carrying Restriction Index Evaluation
Based on land resources, water resources, and ecological carrying capacity, 96 county-level administrative districts in Xinjiang were evaluated and classified in terms of resource and environmental limitations. The results show that the RCI of county-level administrative districts in Xinjiang is 1.09. Forty-eight county-level administrative districts are in surplus, 48 county-level administrative districts are in balance, and 5 county-level administrative districts are currently overloaded. In terms of spatial distribution, there is a surplus in the north and south and a balance in the center (Fig. 7).
Xinjiang’s RCI-overloaded areas include five county-level administrative districts, namely the Dushanzi District, Karamay District, Baijiantan District, Urhe District under the jurisdiction of Karamay City, and Kashgar City, with an area share of 0.50%, a population share of 5.24%, and a population density of 157 people/km2. The common points of this type of area are an arid climate, a poor natural environment, and (because of the local characteristics of the resources or industries), the population is very aggregated, resulting in resource carrying capacity being exceeded, leading to higher pressure on the resources. The limiting factor for the four districts of Karamay City is water resources, with a WCI as high as 12.90 (now seriously overloaded). The water supply source of Karamay City mainly consists of surface water from outside the region, water diversion projects, and groundwater within the region; it relies heavily on water resources from outside the region, with a high-risk coefficient of water resource security and substantial pressure on water resource carrying capacity. The LCI of Kashgar City is 2.07, the WCI is 1.67, and the ECI is 0.38. The main limiting factor is the land resource carrying capacity. Kashgar City has a small area of arable land, accounting for 4.01% of the total arable land in the Kashgar region, and the total calorie of arable land resource products accounts for 4.80%, but the population accounts for 17.41%, and the land resource carrying limitation is large.
The Xinjiang resource carrying capacity-balance area comprises 43 county-level administrative districts, which are mainly located in the central belt of Xinjiang, including Hami City, Turpan City, Aksu District, and county-level administrative districts in the Kashgar Region. The average value of RCI is 1.02, with an area share of 34.03%, a population share of 60.93%, and a population density of 27 people/ km2.
Xinjiang’s resource carrying capacity-surplus areas include 48 county-level administrative districts with an average RCI of 1.20, an area share of 65.47%, a population share of 33.83%, and a population density of 8 people/ km2. Most of the surplus areas in the northern Xinjiang region are richer in resources, with a higher carrying capacity and higher actual populations, while the surplus areas in the southern Xinjiang region have a lower carrying capacity and lower actual populations.
Socio-Economic Development Adaptation Evaluation
The results of Xinjiang’s socio-economic adaptability show that the mean value of the socio-economic development index (SDI) of Xinjiang’s county-level administrative districts is 1.00: 58 county-level administrative districts are in low-level areas, 30 county-level administrative districts are in medium-level areas, and 8 county-level administrative districts are in high-level development areas. In terms of spatial distribution, low levels of socio-economic development predominate in southern Xinjiang, while low to medium levels predominate in northern Xinjiang (Fig. 8).
The SDI of low-level areas in Xinjiang is generally less than 1.05, with a mean value of 0.97, with an area share of 78.16% and 55.60% of the population clustered in such areas. The level of urbanization in this category is low, with most of them having an urbanization rate of less than one-third. 70.69% of county-level administrative districts are dominated by primary industry and have a low level of urbanization, 20.69% of county-level administrative districts are at a low level of the HDI, and 8.62% of county-level administrative districts are constrained by transport accessibility, mainly in the three major counties of the Bayingolin Mongol Autonomous Prefecture (Yuli, Ruoqiang, and Zhemo counties). The land is vast and sparsely populated, and the transport infrastructure is not well developed.
The socio-economic development index of medium-level areas generally ranges from 1.05–1.34, with a mean value of 1.14, 21.44% of the area, and 28.32% of the population residing there. This type of area is rich in natural resources and has a high potential for development, but the lower level of urbanization restricts socio-economic development.
The socio-economic development index of high-level development areas ranges from 1.34–1.92, with a mean value of 1.65, mainly in the cities of Urumqi and Karamay, with an area of only 0.40% and 16.08% of the population living there. High-level areas have a relatively well-developed infrastructure and a mean urbanization rate of 86.89%.
Comprehensive Evaluation of the RECC and Warning Classification
Based on the 3D tetra model, the HSI, RCI, and SDI are comprehensively calculated, and the comprehensive carrying level of the RECC of Xinjiang is derived. According to previous studies, the comprehensive carrying level is divided into three types: overload, balance, and surplus, which are expressed as a red warning zone, a yellow warning zone, and a green (no) warning zone (Fig. 9, RECCI). According to the different conditions, subject to constraints, it can be further divided into 13 subtypes (Fig. 9, Subtype). The comprehensive evaluation of the RECC of Xinjiang shows that two county-level administrative districts are in overload, 37 county-level administrative districts are in balance, and 57 county-level administrative districts are in surplus, and the comprehensive status of the RECC as a whole is good. In terms of spatial distribution, northern Xinjiang is better than southern Xinjiang.
The average value of the RECCI in the red warning area is 0.84, which contains two county-level administrative districts, namely the Urho District in Karamay City and Shaya County in the Aksu Region (Fig. 9). The area accounts for 1.22% of the total and 2.11% of the population; the population density is 8.70 people/ km2. Urho District is constrained by both the human settlement and its resource carrying capacity. The natural conditions are relatively poor, the resource endowment is insufficient (with more restricted water resources), and the RECC is only 0.82. Shaya County, on the other hand, is subject to multiple constraints in terms of human settlement, resource bearing, and socio-economic development; the RECC is seriously overloaded.
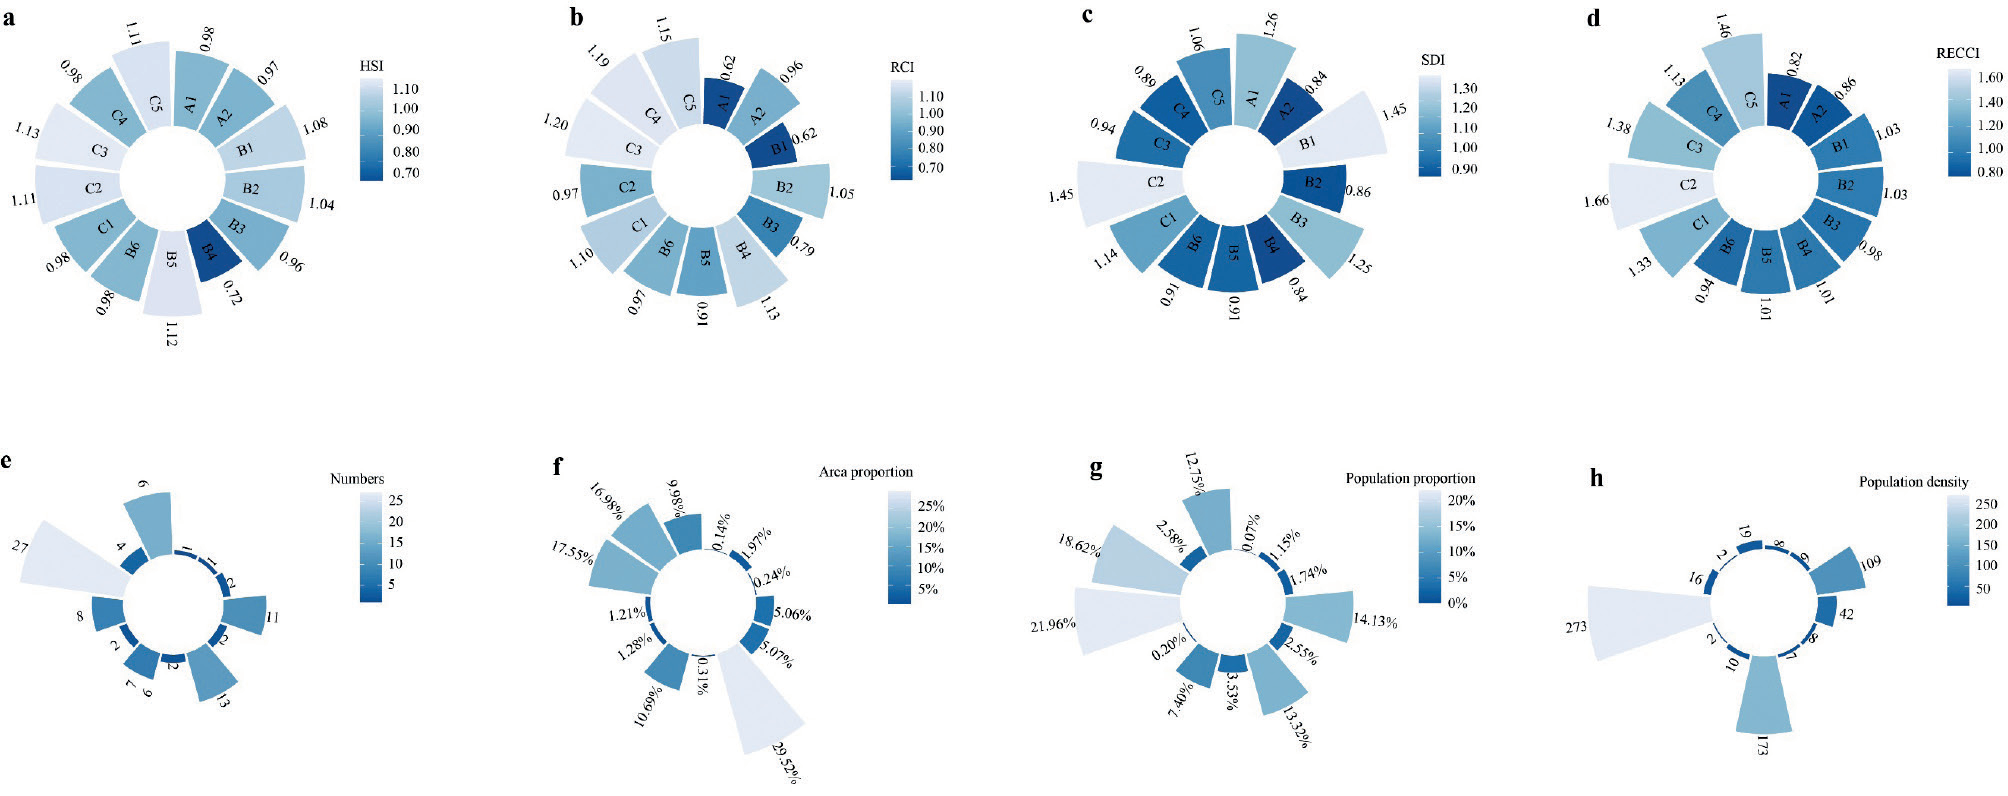
The average value of the RECCI for the yellow warning zone is 1.00, and it includes 37 county-level administrative districts, mainly in the four southern border prefectures. The area accounts for 50.89% of the total, with 42.67% of the population distributed in this type of area, and the population density was 12.58 people/ km2. Twenty-two county-level administrative districts were limited by the human environment, 13 county-level administrative districts were limited by the carrying capacity of resources, and 33 county-level administrative districts were limited by socio-economic development. According to the subtype statistical results (Fig. 10), the population density in regions characterized as HS-restricted (B4) is the lowest, at seven people/km². In contrast, in regions characterized as RS-restricted (B5), the population density is the highest, reaching 173 people/km². It indicates that, within the yellow warning zone in Xinjiang, where economic development is similarly constrained, the unsuitability of the human settlement has a more negative impact on human aggregation compared to resource scarcity.
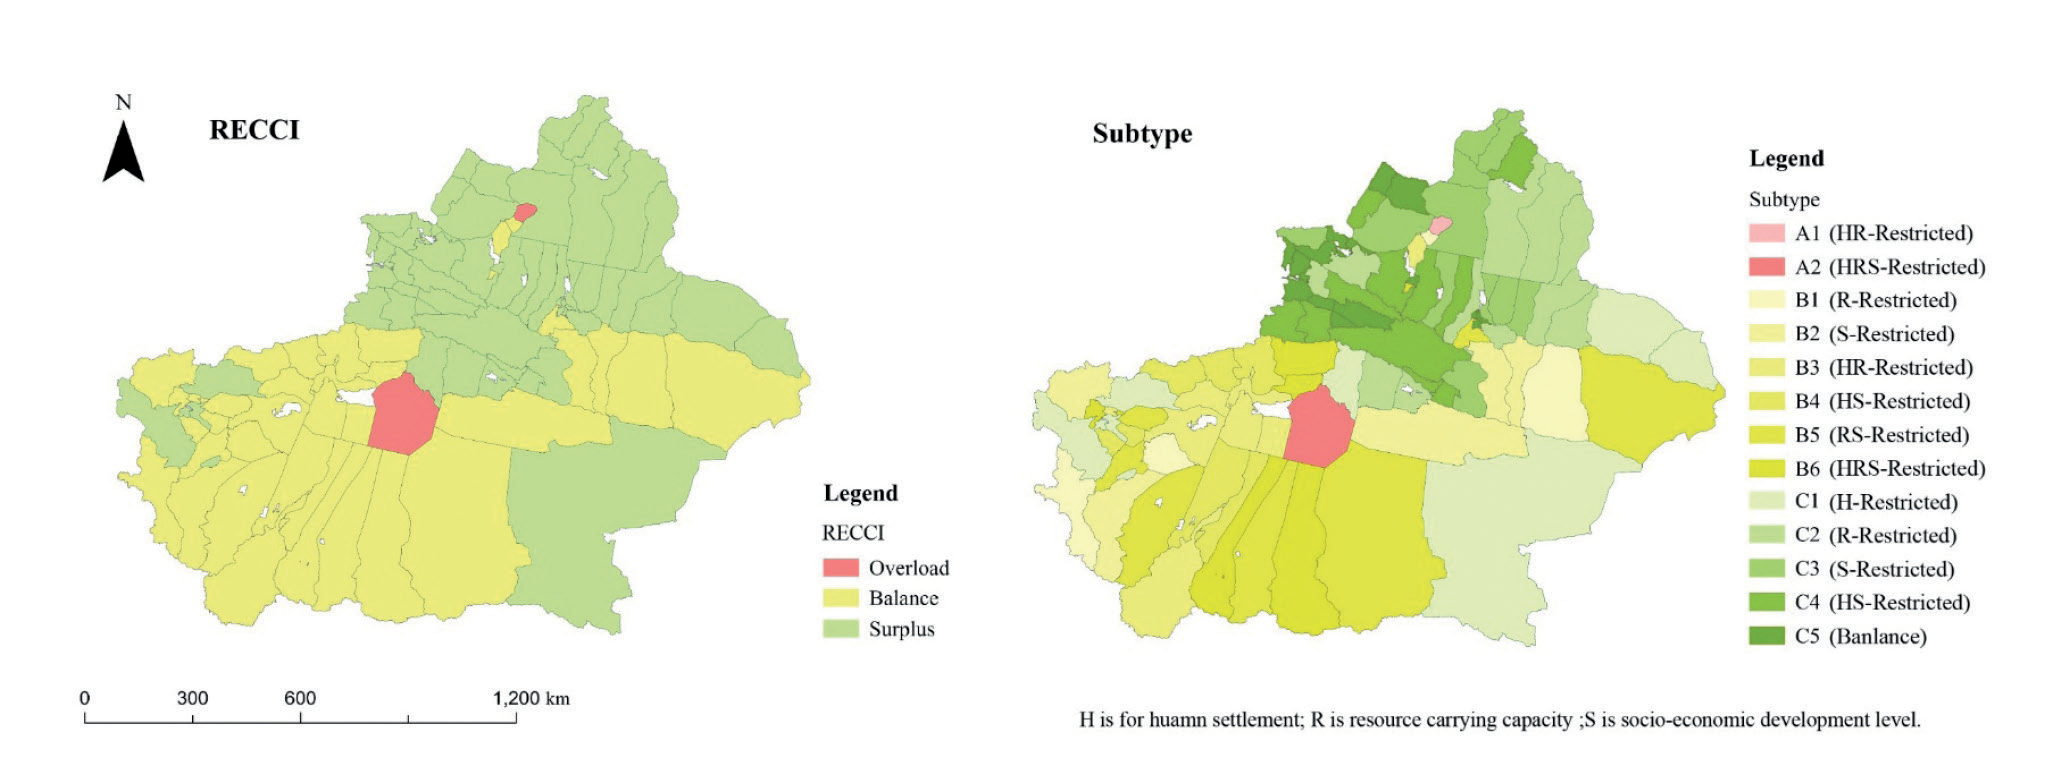
The average value of the RECCI of the green (no) warning zone is 1.42, including 57 county-level administrative districts, accounting for 47.00% of the total area, and accommodating 56.11% of the population, resulting in a population density of 17.91 people/km². This type of area is mainly concentrated in the Junggar Basin, north of the Tianshan Mountain, and the area is highly endowed with resources. The urbanization process is relatively fast. There are six county-level administrative districts constrained by the settlement, eight county-level administrative districts constrained by resource carrying capacity, and 31 county-level administrative districts constrained by socio-economic development. Sixteen county-level administrative districts have balanced and coordinated the development of environment-resource-society with no obvious shortcomings. According to the results of the subtype statistics, in the green no-police zone, the SR-restricted type (C3) county-level administrative districts have the largest number of districts, totaling 27, and the largest share of the area (18.62%). The R-restricted type (C3) has the largest share of the population, with a population density of 273 people/km2.
Spatial Variation of the RECC
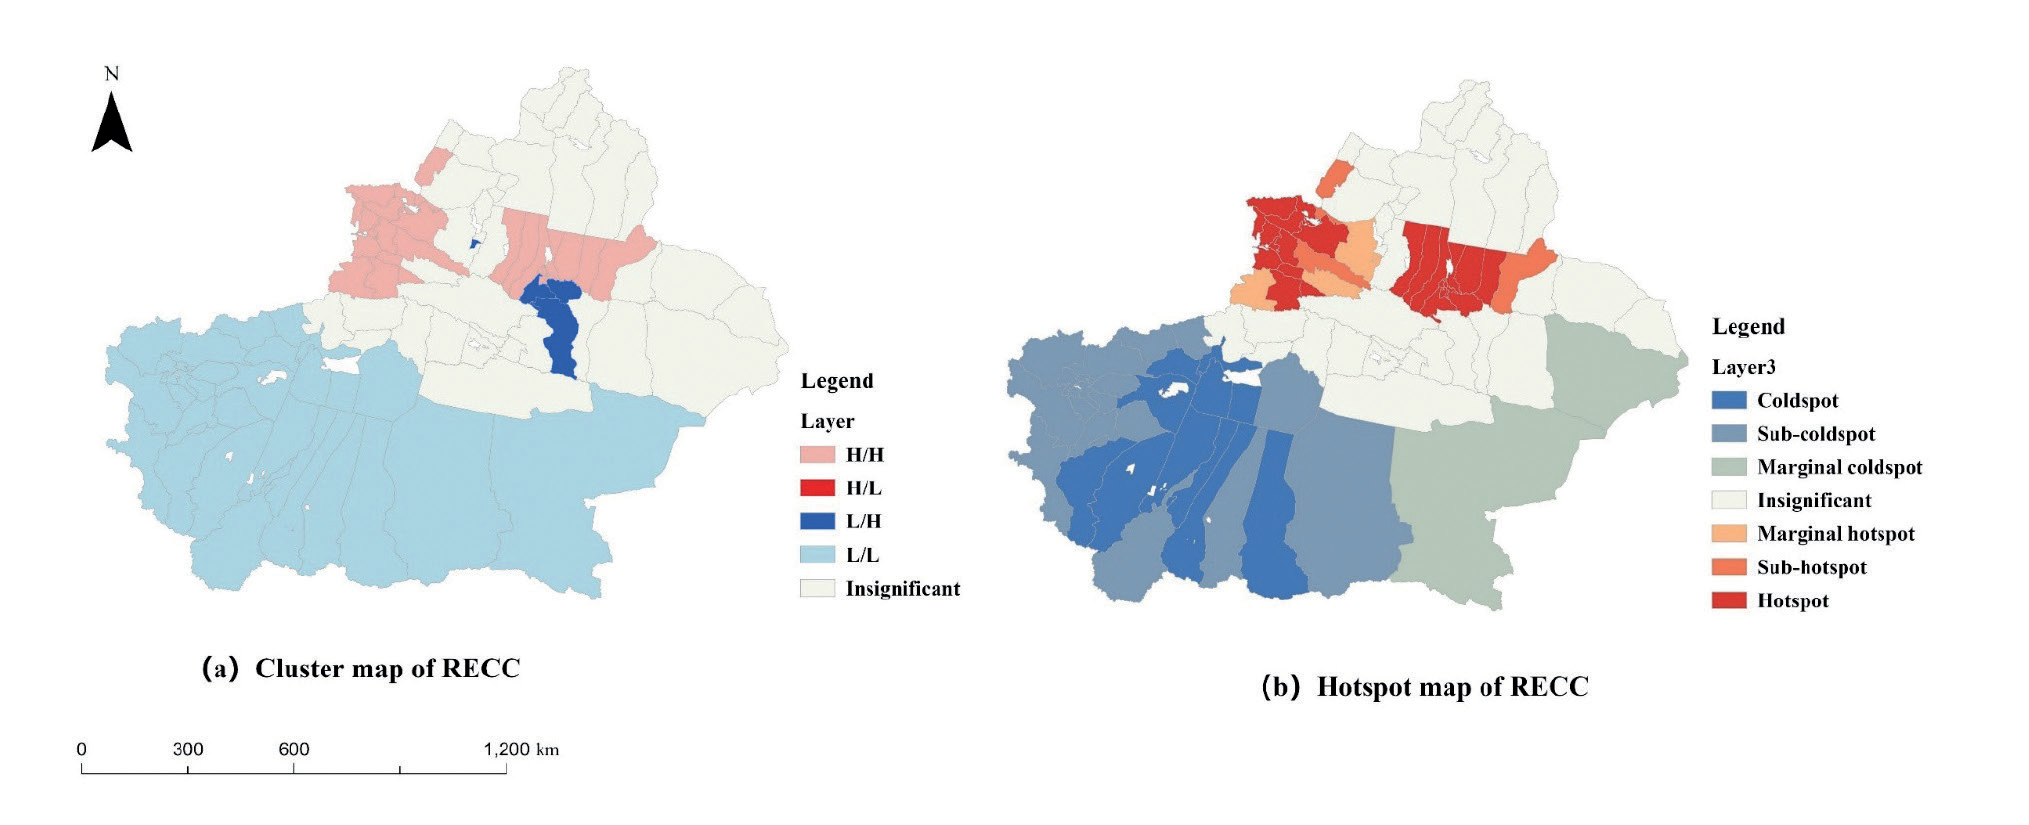
In order to explore the spatial clustering effect of carrying capacity on a unified scale, the human settlement suitability index at the 1 km scale was converted to the county scale using the area-weighted averaging method, in accordance with the applicability principle of carrying capacity analysis. The GeoDa spatial analysis tool was used to establish the spatial relationship matrix, and the queen neighborhood was used to determine the spatial weights. Global spatial autocorrelation analysis was used to reveal the spatial distribution aggregation characteristics of the suitability of human settlement – resource carrying restriction – socioeconomic development. From the results of global spatial autocorrelation analysis, it can be seen that the P-value is much less than 0.01, which passes the significance test at the 1% level. The Moran’s Index is greater than 0, which indicates that there is a positive spatial agglomeration, among which the positive spatial agglomeration of human settlement appropriateness is the most significant. It can be seen that if a county-level administrative region in Xinjiang has a high level of the RECC, the neighboring regions usually have a high level of the RECC.
Cluster analysis of RECC reveals that there are 26 county-level administrative districts classified as H-H, comprising 27.08% of the total. 31 county-level administrative districts classified as L-L are predominant, constituting 36.46% of the total, distributed in Southern Xinjiang. The L-H type is relatively scarce, concentrated in Urumqi and Turpan. H-L clustering is not present, while an additional 35 regions show insignificant clustering and are randomly distributed (Fig. 11a).
A hotspot analysis of Xfinjiang’s RECC was carried out and classified into six categories, namely hotspots, sub-hotspots, marginal hotspots, marginal coldspots, sub-coldspots, and coldspots (Fig.11 b). The spatial distribution pattern of “hot in the north and cold in the south” is consistent with the LISA map of RECC. Two core hotspot zones, Urumqi-Changji Kazakh Autonomous Prefecture and Ili Kazakh Autonomous Prefecture-Bortala Mongolian Autonomous Prefecture, are formed, with a total of 23 county-level administrative districts. Sub-hotspot areas and marginal hotspot areas are fewer in number, four each, and surround the core hotspot areas. Core coldspot zones are formed at the borders of the Hotan, Kashgar, and Aksu regions, totaling 11 county-level administrative districts. There are 19 county-level administrative districts in the sub-coldspot zone, concentrated in the Kizilsu-Kirghiz Autonomous Prefecture and Kashgar Region. There are two marginal coldspot zones in Ruoqiang County and Yizhou District.
Analysis of the Drivers of the RECC
The next step is to apply the GWR model to calculate the regression coefficients of each factor. In order to avoid the bias of the estimation results caused by the mutual influence of each index, the Variance Inflation Factor (VIF) was introduced to test the covariance of each dependent variable. The Variance Inflation Factor of the nine dependent variables (except relief degree of land surface) is less than 5, indicating that there is no multicollinearity problem among these nine factors.
Based on the screened drivers, after determining the relevant parameters, the fitting results of the corresponding drivers were obtained by inputting the GWR model; the overall results included the AICc and the adjusted R2, which reflected the credibility of the GWR. The fixed Gaussian function R2 is 0.91, the adjusted R2 is 0.88, and the AICc value is 89.78, while the adaptive two-square function R2 is 0.96, the adjusted R2 is 0.93, and the AICc value is 62.11. Comparing the two spatial weighting functions, it can be seen that the adaptive two-square function has the highest R2 and adjusted R2, and the AICc value is smaller, which makes the fitting accuracy better. In this paper, the results of the GWR model with an adaptive bi-square function are selected for further analysis and interpretation.
ArcGIS Pro software was used to produce spatial distribution maps of GWR regression coefficients for each variable at different locations (Fig. 12). The regression coefficients of the land use and vegetation index are positive in all county-level administrative districts (the regression coefficients are 0.216394~0.536903), and from the spatial distribution of the regression coefficients, the impact of the land use and vegetation index on the carrying capacity of the resource environment is more obvious in the central and southeastern parts of the city. The Bayingolin Mongol Autonomous Prefecture shows the most obvious performance. The hydrological index presents positive and negative effects in the study area, the negative effects mainly being in Urumqi City, the Changji Hui Autonomous Prefecture, and the Altay region, probably due to the overexploitation of water resources. When the hydrological index is high, it may trigger the overexploitation and use of water resources, exceeding the range of sustainable use and resulting in the overloading of water resources which, in turn, negatively affects the environmental carrying capacity of resources. The temperature and humidity index present both positive and negative effects, with the negative effect concentrated in the northern Xinjiang region and the positive effect mainly in southern Xinjiang. The temperature and humidity index show both positive and negative effects, with the negative effect mainly concentrated in the northern region and the positive effect mainly in the southern region.
The water resource carrying index (WCI) shows a negative effect in all county-level administrative districts. This indicates that the higher the WCI, the more restrictive the water resource carrying capacity is, and the lower the resource carrying capacity is. In terms of the spatial distribution of regression coefficients, the degree of influence of WCI on RECC presents the characteristics of high in the north and low in the south. Kashgar, Hotan, Aksu, and Kizilsu Kirghiz Autonomous Prefectures are most affected by the WCI. The land resources carrying index (LCI) has the greatest influence and shows a negative effect (regression coefficients from -1.109065 to -0.07744) in all the county-level administrative districts. Among these, the Kashgar, Kizilsu Kirghiz Autonomous Prefecture, and Hotan regions are most affected by the LCI, indicating that, compared with other regions, the vigorous development of modern agriculture and the enhancement of arable land resource production output in such regions will substantially increase the level of the RECC. The ecological resource carrying index shows both positive and negative effects. The positive values (56%) are mainly distributed in the county-level administrative districts in the eastern region of Xinjiang, and the positive effects are most obvious in the county-level administrative districts of Bayingolin Mongol Autonomous Prefecture, Turpan City, and Hami City. This may be due to the fact that these areas have higher agroecological consumption, which leads to a more restrictive ecological carrying capacity, but the agricultural output value pulls in economic growth, which, in turn, raises the RECC. Negative values (44%) are mainly dispersed across the county-level administrative districts in the east, and the negative impact is most dispersed across the county-level administrative districts in the Hotan area. The more restrictive the ecological carrying capacity is, the smaller the RECC is.
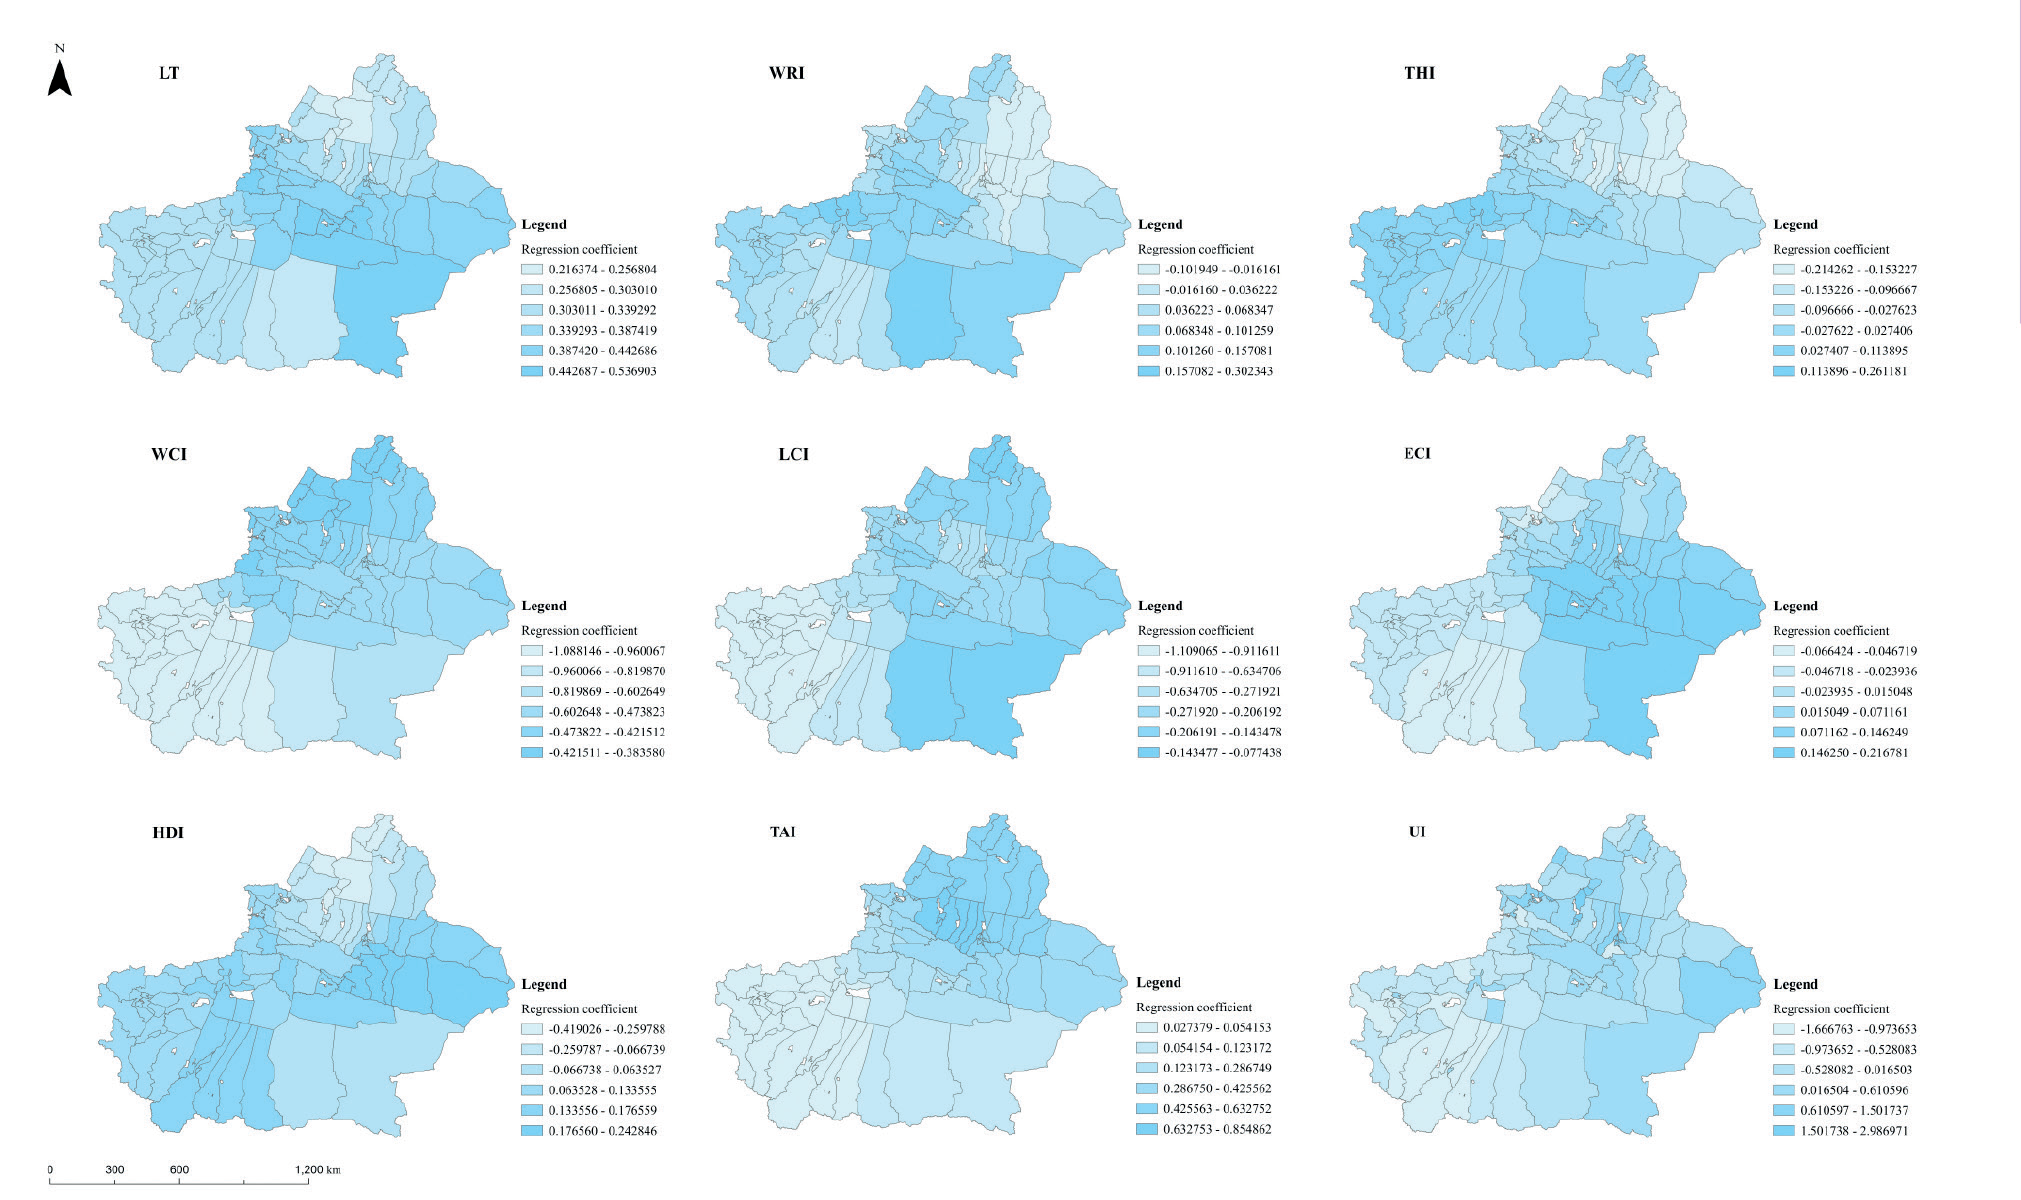
The human development index (HDI) shows both positive and negative effects; the positive value (78%) is mainly distributed in the county-level administrative districts on the southern border, and the progress of the human development level plays a positive moderating effect on the RECC. The negative value (22%) is mainly distributed in the counties in and around Kelamayi City, whose leading edge in education, longevity, and economy mostly relies on the petroleum industry. The transport access index (TAI) shows a positive effect in all the counties and administrative districts. The more developed the transport, the stronger the carrying capacity of resources and the environment. The regression coefficient decreases from northeast to southwest, and high values gather at the junction of the Tacheng area, Karamay City, and Changji Hui Autonomous Prefecture, where accelerating the construction of the transport network and improving transport accessibility will significantly increase the RECC. The influence of the urbanization index (UI) on the RECC is relatively large, with large differences (regression coefficients range from 0.822545 to 2.14710), and 60% of county-level administrative districts in Xinjiang are in the middle stage of accelerated urbanization. Urbanization has a significant impact on socio-economic development, which, in turn, plays an important role in regulating the RECC.
Discussion
Evaluation of the Applicability of Indicators and 3D Tetra Models
This paper constructs a 3D tetra model for the comprehensive evaluation of the RECC based on the places, resource elements, social conditions, and interactions required for human survival and development. The model contains three criteria layers: human settlement, resource carrying capacity, and socio-economic development. Specifically, topography and climate are the cornerstones of human settlement and play a dominant role in the level of human settlement, while ground cover and hydrology have the functions of increasing relative humidity and the oxygen content of the air, improving the local micro-environment, and enhancing the landscape, thus influencing the habitability of the region [50]. Soil and water resources and the ecological environment are the important resource elements needed for the survival and development of human beings, reflecting the limits of the development of a region, especially the carrying capacity of water resources, which is the most important factor for human survival and development. In particular, the carrying capacity of water resources is related to the sustainable development of arid zones. Socio-economic development plays a regulating role in RECC, which can be evaluated by indicators such as the level of human development, the degree of accessibility, and the rate of urbanization. Data fusion calculations are carried out by different models within the criterion layer, and, finally, a three-dimensional equilibrium model is constructed to synthesize the criterion layer and express the carrying capacity of each county-level administrative region more clearly.
Resource and Environmental Carrying Capacity and Driving Force Research
Clarifying the magnitude of the role of driving factors in the RECC of Xinjiang is of great significance for improving the RECC according to local conditions and realizing the sustainable development of the region. In related research, Ren Qingchen [51] used a geodetic detector to calculate the proportion of arable land area in 2020. This contributes much more to the RECC of Xinjiang than other factors, followed by the proportion of the output value of the secondary industry to the gross domestic product (GDP) and the proportion of the primary industry to GDP. It is a commonality with the results that the water resource carrying index, urbanization index, and land resource index contribute more to this study. At the same time, it reflects that agriculture occupies a dominant position in Xinjiang’s industry, and so it should adhere to the strategy of stabilizing grains, optimizing cotton, strengthening fruits, promoting livestock, and promoting special features, accelerating the construction of a modern agricultural industrial system, and further enhancing the resource carrying capacity. However, the spatial heterogeneity of each factor in different locations is not reflected, so this paper applies GWR models to explore spatial non-stationarity [40] in order to elucidate the local mechanism of the factors’ actions and to visually express what the dominant factors are in different locations.
Shortcomings and Prospects
The RECC of the Xinjiang Production and Construction Corps (the Corps) was not calculated due to limitations in data acquisition. The Corps has resource flows and economic interactions with localities and is closely connected geographically. When calculating the regression coefficients of the driving factors using the GWR model, the spatial relationships are calculated as weights [52]. Since the data that could be provided by the Corps was not considered in the calculation of the RECC (therefore ignoring the spatial relationship between the Corps and neighboring places), the resulting regression coefficients may be somewhat different from the actual figures. In the future, detailed data from the Corps will be obtained to analyze its comprehensive carrying capacity of resources and the environment, so as to obtain more accurate regression coefficients.
Secondly, in the process of model synthesis, 1km raster data and county-level administrative area data are calculated uniformly, and the scale conversion will lead to errors in the results. In the future, the empirical bias will be corrected with the help of inductive and deductive reasoning methods, and a more accurate upscaling conversion model will be constructed to improve the conversion accuracy through in-depth exploration. This endeavor will provide powerful support for the comprehensive measurement of carrying capacity and is expected to provide scientific decision-making support for an in-depth understanding of the regional RECC, as well as for the promotion of coordinated development of regional populations, resources, and the environment.
Recommendations for Improving RECC
Results based on the GWR model show that the WCI, UI, and LCI have the strongest driving force, which indicates the direction for improving the RECC. The WCI has the strongest contribution in Kizilsu Kyrgyz Autonomous Prefecture, Hotan Region, Kashgar Region, and southwestern Aksu. Aksu, in particular, is rich in terms of its own water resources, but the booming development of water-intensive industries, such as irrigated agriculture and oil and gas processing, has led to a water resource carrying index of 1.86, which is currently overloaded. These regions should make water resources a rigid constraint on industrial development, adjust their water-use structure, reduce the total amount of water used in agriculture, and promote water-saving irrigation and the development of recycled water-use technologies.
Conclusions
Considering the interactive relationship between resource and environmental base, socio-economic development, and population development, a 3D tetra model is constructed in accordance with the research concept of ‘human settlements suitability zoning – resource carrying restriction classification – socio-economic development adaptability grading – resource environmental carrying capacity warning grading’. Based on the above modeling method and a kilometer grid with county-level administrative districts as the basic research unit, and combined with GWR analysis, an empirical study about the comprehensive assessment of the Xinjiang RECC and its driving factors was carried out. The study shows that:
1. On a comprehensive view, 57 county-level administrative districts in Xinjiang are in a surplus state, accounting for 47.00% of the total area. Correspondingly, nearly 3/5 of the population resides in these regions. The comprehensive status of RECC is generally good and northern Xinjiang is better than southern Xinjiang, which is in line with the background conditions.
2. The human settlement environment poses restrictions on 30 county-level administrative districts in Xinjiang, socio-economic development imposes a more substantial constraint on the level of the RECC of Xinjiang, and 65 county-level administrative districts are constrained by socio-economic development. Resource carrying capacity constitutes a restriction on the level of the RECC of 23 county-level administrative districts in Xinjiang, of which water resource restrictions are more obvious. In particular, water resources in the cities of Karamay and Turpan carry state pressure. The carrying capacity of ecological as well as land resources does not yet pose a threat to regional development. Of all the subtypes, the R-restricted type (C2) exhibits the highest proportion of population share and the highest population density of 273 people/km2. The H-restricted type (C2) exhibits the smallest proportion of population share and the lowest population density of 2 people/km2. It indicates that the level of human agglomeration in Xinjiang is more dominated by the habitat.
3. According to the results obtained from the GWR model, the influence degree of each factor on the RECC of Xinjiang varies significantly, exhibiting evident spatiality. Overall, the WCI drives Xinjiang’s RECC the most, especially in Kashgar, Kizilsu Kirghiz Autonomous Prefecture, Hotan, and Aksu regions. Secondly, the UI and the LCI profoundly affect the RECC of Xinjiang. Spatially, the LCI has the highest variability, followed by the TAI and the UI.

