

Introduction
Against the backdrop of increasingly prominent global environmental change and sustainable development issues, agricultural non-point source pollution (ANPSP), as an important factor affecting water quality and threatening ecosystem health and human well-being, has received widespread attention in research [1]. The complexity of ANPSP lies in its diffuse nature, multi-source contributions (e.g., livestock breeding, fertilizer runoff, rural domestic waste), and synergistic interactions with hydrological processes, making it particularly detrimental to riverine ecosystems in intensive agricultural regions [2]. Agricultural non-point source pollution mainly comes from several categories, including livestock and poultry breeding, planting, rural life, and aquaculture. Among them, the livestock and poultry breeding industry is an important source of agricultural non-point source pollution, which poses a great threat to the environment by producing feces, sewage, and foul odor gases [3]. Animal husbandry waste not only contains rich organic matter but also key nutrients such as nitrogen and phosphorus. If they enter water and soil through unreasonable discharge channels, it will lead to serious water and soil pollution [4, 5].
Since the 1990s, environmental pollution caused by China’s livestock and poultry breeding industry has increasingly become a focus of social attention. Governments and research institutions at all levels have conducted extensive pollution research, risk assessment, exploration, and practice of prevention and control strategies in multiple regions [6]. European and American countries, due to their early start and high degree of scale in the aquaculture industry, have established relatively complete pollution monitoring systems and technical specifications for aquaculture. The United States has passed the Clean Water Act to strictly manage centralized aquaculture farms, requiring them to apply for a national pollutant reduction system permit and develop a Comprehensive Nutrient Management Plan (CNMP) [7], focusing on the protection and resource management of feces, sewage, soil, feed, and other aspects. The European Union regulates pollution issues in the aquaculture industry through the Nitrates Directive and other relevant regulations [8]. For example, the European Community Nitrate Control Standards set standards for animal units per hectare and limit standards for using livestock manure wastewater for agriculture. In terms of scientific research, European and American scholars have utilized advanced monitoring techniques and model simulations to deeply explore the environmental impact and emission reduction technologies of nutrients such as nitrogen and phosphorus in livestock and poultry manure, such as environmentally friendly treatment methods such as biofilters and anaerobic digestion [9].
Although China has successively introduced a series of technical specifications and policies such as the “Technical Specifications for Pollution Prevention and Control in the Livestock and Poultry Farming Industry”, “Technical Specifications for Returning Livestock and Poultry Manure to the Field”, and “Technical Specifications for the Application of Biomass Fertilizer” after 2000 [10], there are still some problems in practical operation. For example, some breeding farms lack reasonable planning and management, resulting in poor effectiveness of manure treatment facilities. The ecological restoration and protection regulations in the Qinhe River Basin also emphasize the importance of protecting ecological water use and preventing water pollution. These policy documents provide legal evidence and policy support [11], which helps to promote environmental protection in the lower reaches of the Qinhe River. Therefore, it is necessary to strengthen the environmental protection management of large-scale livestock and poultry farms, reduce the overall emissions of agricultural source pollution, and promote the fundamental improvement and enhancement of agricultural environmental quality. Zhang Huamei used the export coefficient model and standard pollution load method to simulate the spatiotemporal distribution of non-point source pollution in the Nanxi Lake Basin and found that land use is the main source of TN pollution, while TP mainly comes from agricultural activities and livestock breeding [12]. Xie Jingchao estimated the emissions of TN and TP from agriculture, animal husbandry, and rural life in 32 counties in the year 2015 by using the pollutant emission coefficient method. The spatial distribution characteristics of its emission intensity were studied by using GIS spatial analysis methods. The equivalent pollution load method was used for the pollution evaluation and pollution source analysis, and the results showed a significant difference in the total load of agricultural non-point source pollutants [13]. Based on China’s unique geographical and socio-economic conditions, researchers have focused on researching and developing technologies for the resource utilization of aquaculture waste, such as organic fertilizer production and biomass energy development. They have also explored pollution prevention and control strategies suitable for localization, such as ecological aquaculture models and integrated aquaculture planting systems, striving to achieve a win-win situation between economic benefits and environmental protection. Previous studies have highlighted the government’s policies and technological innovations in reducing pollution from livestock and poultry. Research on SCEPCE driven by the digital economy shows that environmental taxes, incentives, and technology effectively reduce pollution [14]. Research in developing countries has confirmed that digitization can improve monitoring and efficiency [15], providing key insights for pollution control in rapid urbanization and industrialization [16].
Currently, there is relatively little research on the evaluation of agricultural non-point source pollution emissions and the characteristics of pollution sources in the lower reaches of the Qin River, and the spatiotemporal dynamics of these changes remain unclear. This article takes the lower reaches of the Qin River as the research area, including 6 counties and cities in Jiyuan City and Jiaozuo City, including Wuzhi County, Boai County, Wen County, Mengzhou City, and Qinyang City. By integrating ArcGIS technology and the pollution coefficient method and using advanced spatial analysis methods such as zoning statistics, the total emissions and intensity of total nitrogen (TN), total phosphorus (TP), and chemical oxygen demand (COD) in various regions of the lower reaches of the Qin River from 2001 to 2021 were systematically estimated. The pollution coefficient method is based on the relationship between the unit emissions of known emission sources and their corresponding activity levels and estimates pollutant emissions under different activity scenarios through coefficients. This method is widely used in many regional environmental studies, especially when data is incomplete or cannot be directly monitored, as it can provide reasonable emission estimates.
This research identifies the spatial and temporal dynamics of total nitrogen (TN), total phosphorus (TP), and chemical oxygen demand (COD) emissions in the region from 2001 to 2021. By integrating ArcGIS technology and the pollution coefficient method, this study systematically estimates pollutant emissions across different counties in the lower Qin River Basin, an area lacking prior comprehensive pollution evaluations. The pollution coefficient method, widely used in regional environmental studies, helps estimate emissions where direct data is unavailable. Provide practical and feasible suggestions for strengthening the region’s pollution control and environmental supervision. This study analyzed the TN, TP, and COD emissions in the lower reaches of the Qin River Basin (2001-2021) using ArcGIS and the pollution coefficient method, addressing the lack of prior assessment. The lack of a scientifically effective agricultural non-point source pollution management strategy provides solid data support and a decision-making basis.
General Situation and Data Sources
General Situation
The Qinhe River Basin belongs to two provinces, Shanxi and Henan (111°55′E-113°30′E, 35°11′N-37°08′E), and its main stem originates from Erlang Shengou, south of Huoshan in Qinyuan County, Shanxi Province. As an important branch of the Yellow River between Sanmenxia and Huayuankou, it flows from north to south through 16 counties and cities before merging into the Yellow River in Wuzhi County, Henan Province. The Qinhe River Basin is a complete natural unit that includes “mountains, hills, and plains”, with uniqueness, typicality, and representativeness [17].
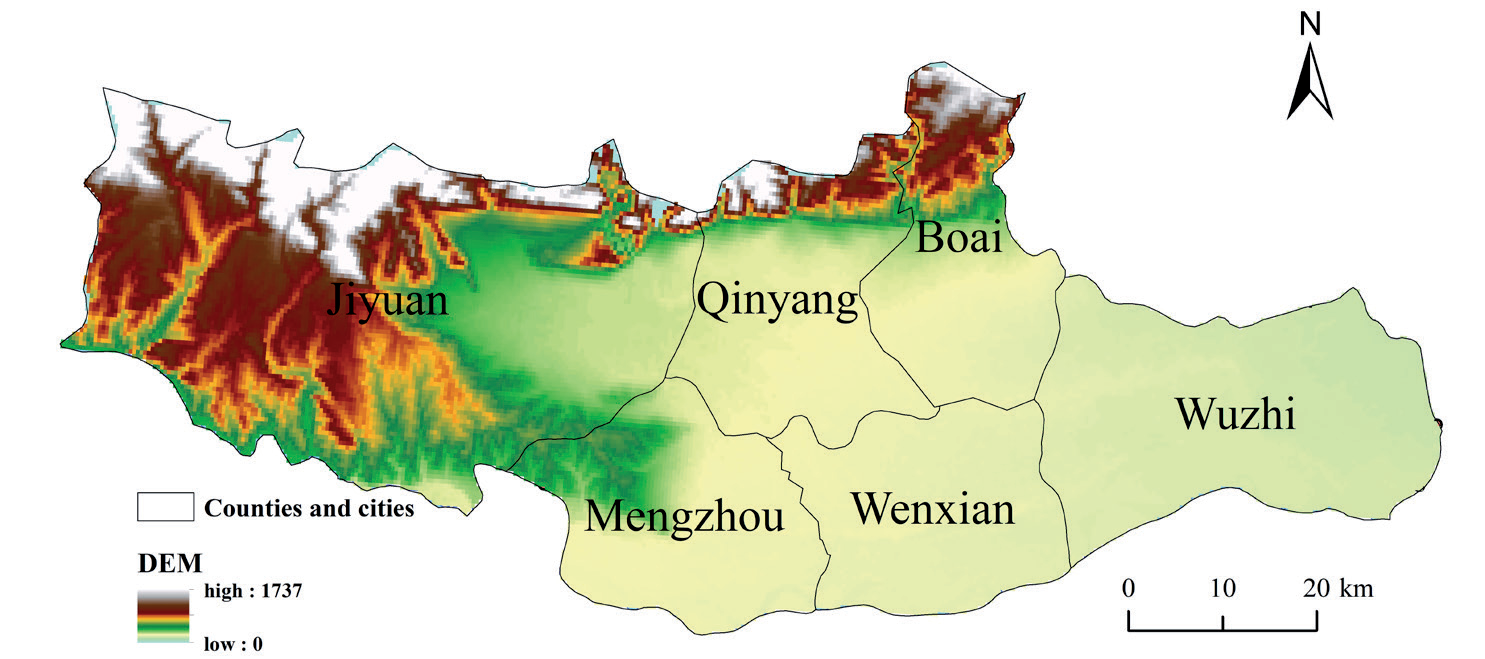
The lower reaches of the Qinhe River are a plain area with a concentrated population, contiguous cultivated land, complete irrigation facilities, and intensive agriculture, making it an important core area for grain production in our province (Fig. 1). On the other hand, although the scale, intensification, and modernization of the livestock and poultry breeding industry have promoted the improvement of economic benefits, the large amount of waste, such as feces, it produces has put enormous pressure on agricultural resources. If these wastes are improperly handled, they directly affect farmland quality and sustainable utilization [18].
Data Sources
The data collected in this study includes the sowing area of crops, nitrogen and phosphorus fertilizer use, livestock and poultry breeding quantity, and rural permanent population in Henan Province from 2001 to 2021. The data is sourced from the Henan Provincial Statistical Yearbook, the China Urban Rural Development Database, and the statistical yearbooks of various counties and cities. This data is all sourced from official websites, possessing high authority and wide applicability; however, there are also some potential uncertainties and data gaps. Firstly, some counties and cities may have delayed or missing data updates in their statistical yearbooks. Secondly, as some data are obtained through sampling surveys or estimates, this may lead to certain errors. Finally, regional differences in the standards and methods of data statistics, especially concerning the statistics of livestock and poultry breeding quantities, mean that some regions may use different calculation methods, resulting in inconsistencies. To mitigate the impact of these uncertainties on the research results, this study rigorously calculated and processed the data, using weighted averaging and regional correction methods to fill in missing values where possible. Nevertheless, the incompleteness of the data and potential errors still need to be considered in the analysis results, and relevant limitations should be acknowledged in the discussion of the results.
Materials and Methods
This study refers to the latest “Handbook on Accounting Methods and Coefficients for Pollutant Emissions from Statistical Investigation of Emission Sources” (referred to as the “Handbook”) issued by the Ministry of Ecology and Environment of the People’s Republic of China in June 2021, from https://www. mee.gov.cn, which includes the calculation methods and related coefficients for TN, TP, and COD emissions from four types of pollution sources: rural life, agricultural planting, livestock and poultry breeding, and aquaculture.
According to the accounting method in the Handbook, the discharge of rural domestic sewage pollutants in the study area is estimated using the following formula:
In the formula, La refers to the discharge of pollutants from rural domestic sewage in the research area (unit: t); W refers to the amount of pollutants generated in the research area (unit: t); V refers to the proportion of administrative villages in the research area that treat domestic sewage; Q refers to the comprehensive removal rate of pollutants; P refers to the rural permanent population in the research area (unit: 10000 people); K refers to the intensity of pollutant production in the research area (unit: g/person/day);
The emission of pollutants from the planting industry refers to the accounting method in the Handbook, and the calculation formula is:
In the formula, Qj refers to the j-th pollutant emission (loss) from the planting industry in the research area (unit: tons); Aj refers to the total sowing area of crops in the study area (in hectares); Egj refers to the water pollution logistics loss coefficient of the j-th item during crop cultivation in the research area (unit: kg/ha); Ay refers to the area of the research area garden (in hectares); Eyj refers to the water pollution logistics loss coefficient of the j-th item in the study area (unit: kg/ha); qj refers to the unit area usage of nitrogen-containing fertilizers (phosphorus-containing fertilizers) used in the planting industry in the research area in a certain year (unit: kg/ha); q0 refers to the unit area usage of nitrogen-containing fertilizers (phosphorus-containing fertilizers) used in the planting industry in the research area in 2017, in kilograms per hectare.
The emissions of pollutants from livestock and poultry farming are calculated using the middle-level pollution accounting method in the Handbook, and the calculation formula is:
In the formula, Wij refers to the pollutant emission of item j in the i-th category of livestock and poultry breeding in the research area (unit: t); Qi refers to the inventory/output of Class i large-scale livestock and poultry farms in the research area (unit: head/feather); Sijg refers to the pollutant emission coefficient of item j in large-scale breeding of Class i livestock and poultry (unit: kg/head (feather)); Qj refers to the inventory/ output of Class j livestock and poultry farmers in the research area (unit: head/feather); Sijy refers to the j-th pollutant emission coefficient of Class i livestock and poultry farmers (unit: kg/head (feather)); and Wj refers to the pollutant emissions of item j from livestock and poultry breeding in the research area (unit: t).
The pollutant emissions from aquaculture are calculated using the intermediate discharge accounting method in the Handbook, and the calculation formula is as follows:
In the formula, Qj refers to the j-th pollutant emission from aquaculture in the research area (unit: t); q refers to the production of aquatic products from aquaculture in the research area (unit: t); and ej refers to the j-th pollutant emission coefficient of aquaculture in the research area (unit: kg/t). The pollutant emission coefficients of each pollution source are shown in Table 1.
Results and Discussion
Analysis of Temporal Changes in Agricultural Non-Point Source Pollution
Overall (Fig. 2), from 2001 to 2021, TN emissions in the lower reaches of the Qinhe River exhibited a significant downward trend (P<0.01, Mann Kendall test), while TP and COD displayed an initial increase followed by a decrease. TN, TP, and COD decreased by 46.83%, 15.03%, and 25.97%, respectively, from 2001 to 2021. TP and COD showed a significant increasing trend from 2001 to 2006 (P<0.01), while TN demonstrated a slight increase from 2004 to 2006. Compared to the 2001-2006 period, TN, TP, and COD all experienced a significant decline in 2007, with decreases of 7.45%, 15.19%, and 15.71%, respectively. Simultaneously, COD generally exhibited a slow downward trend after 2007. From 2001 to 2006, emissions of TP and COD rose significantly, attributed to the rapid expansion of agriculture and intensification of livestock breeding in the early 2000s, a time characterized by limited environmental regulation and monitoring. The subsequent decline in emissions post-2007, particularly in TN and COD, reflects the gradual implementation and enforcement of stricter environmental policies. Notably, the strong policy push during the 12th Five-Year Plan period (2011-2015), which emphasized sustainable agricultural practices, waste treatment facilities, and more stringent regulations on chemical fertilizers and livestock manure management, profoundly impacted the reduction of pollutant emissions. Another influential factor was the change in agricultural practices. Over the study period, transitioning from traditional, high-input, low-efficiency farming to more sustainable agricultural practices played a crucial role in mitigating non-point source pollution. The shift towards integrated farming systems, improved crop rotation practices, and a greater reliance on organic fertilizers has contributed to reducing the overall nutrient load entering water bodies.
Table 1.
Emission factors of non-point source pollutants from different agricultural activities.
| Rural life | Name | TN | TP | COD |
|---|---|---|---|---|
| Pollution intensity/(g/(person * d)) | 1.01 | 0.10 | 23.24 | |
| Comprehensive removal efficiency/% | 47 | 46 | 62 |
| Agricultural planting | Emission coefficient during agricultural sowing process/(kg/km2) | Garden emission coefficient/(kg/km2) | ||
|---|---|---|---|---|
| TN | TP | TN | TP | |
| 2.976 | 0.234 | 4.071 | 0.176 | |
| Aquaculture | TN (kg/t) | TP (kg/t) | COD (kg/t) |
|---|---|---|---|
| 2.087 | 0.048 | 14.279 |
During the 11th Five-Year Plan period, establishing total control targets for major pollutant emissions nationwide [19] clearly illustrates a downward trend in pollutant emissions. Environmental policies, particularly implementing pollution charging mechanisms [20], have significantly contributed to reducing pollution emissions, underscoring the importance of selecting precise policy tools [21]. Nevertheless, research has indicated a complex issue: solely relying on environmental legislation is insufficient to significantly diminish regional pollution emissions, with its effectiveness heavily reliant on strict law enforcement. In provinces with relatively severe local pollution, environmental regulations can play a pivotal role in environmental improvement [22]. This suggests that, in addition to policy-making, the rigor of policy implementation is also a crucial factor influencing the effectiveness of pollutant emission reduction. Comparing emissions from different sources of the same pollutant, changes were noted in the proportions: livestock and poultry sources>planting sources>rural living sources>aquaculture sources. Regarding COD emissions from various pollution sources, livestock and poultry breeding sources contribute the largest share and exhibit a trend of first increasing and then decreasing. Rural living sources show a consistent yearly decrease, while aquaculture sources illustrate a pattern of initially increasing and then decreasing emissions.
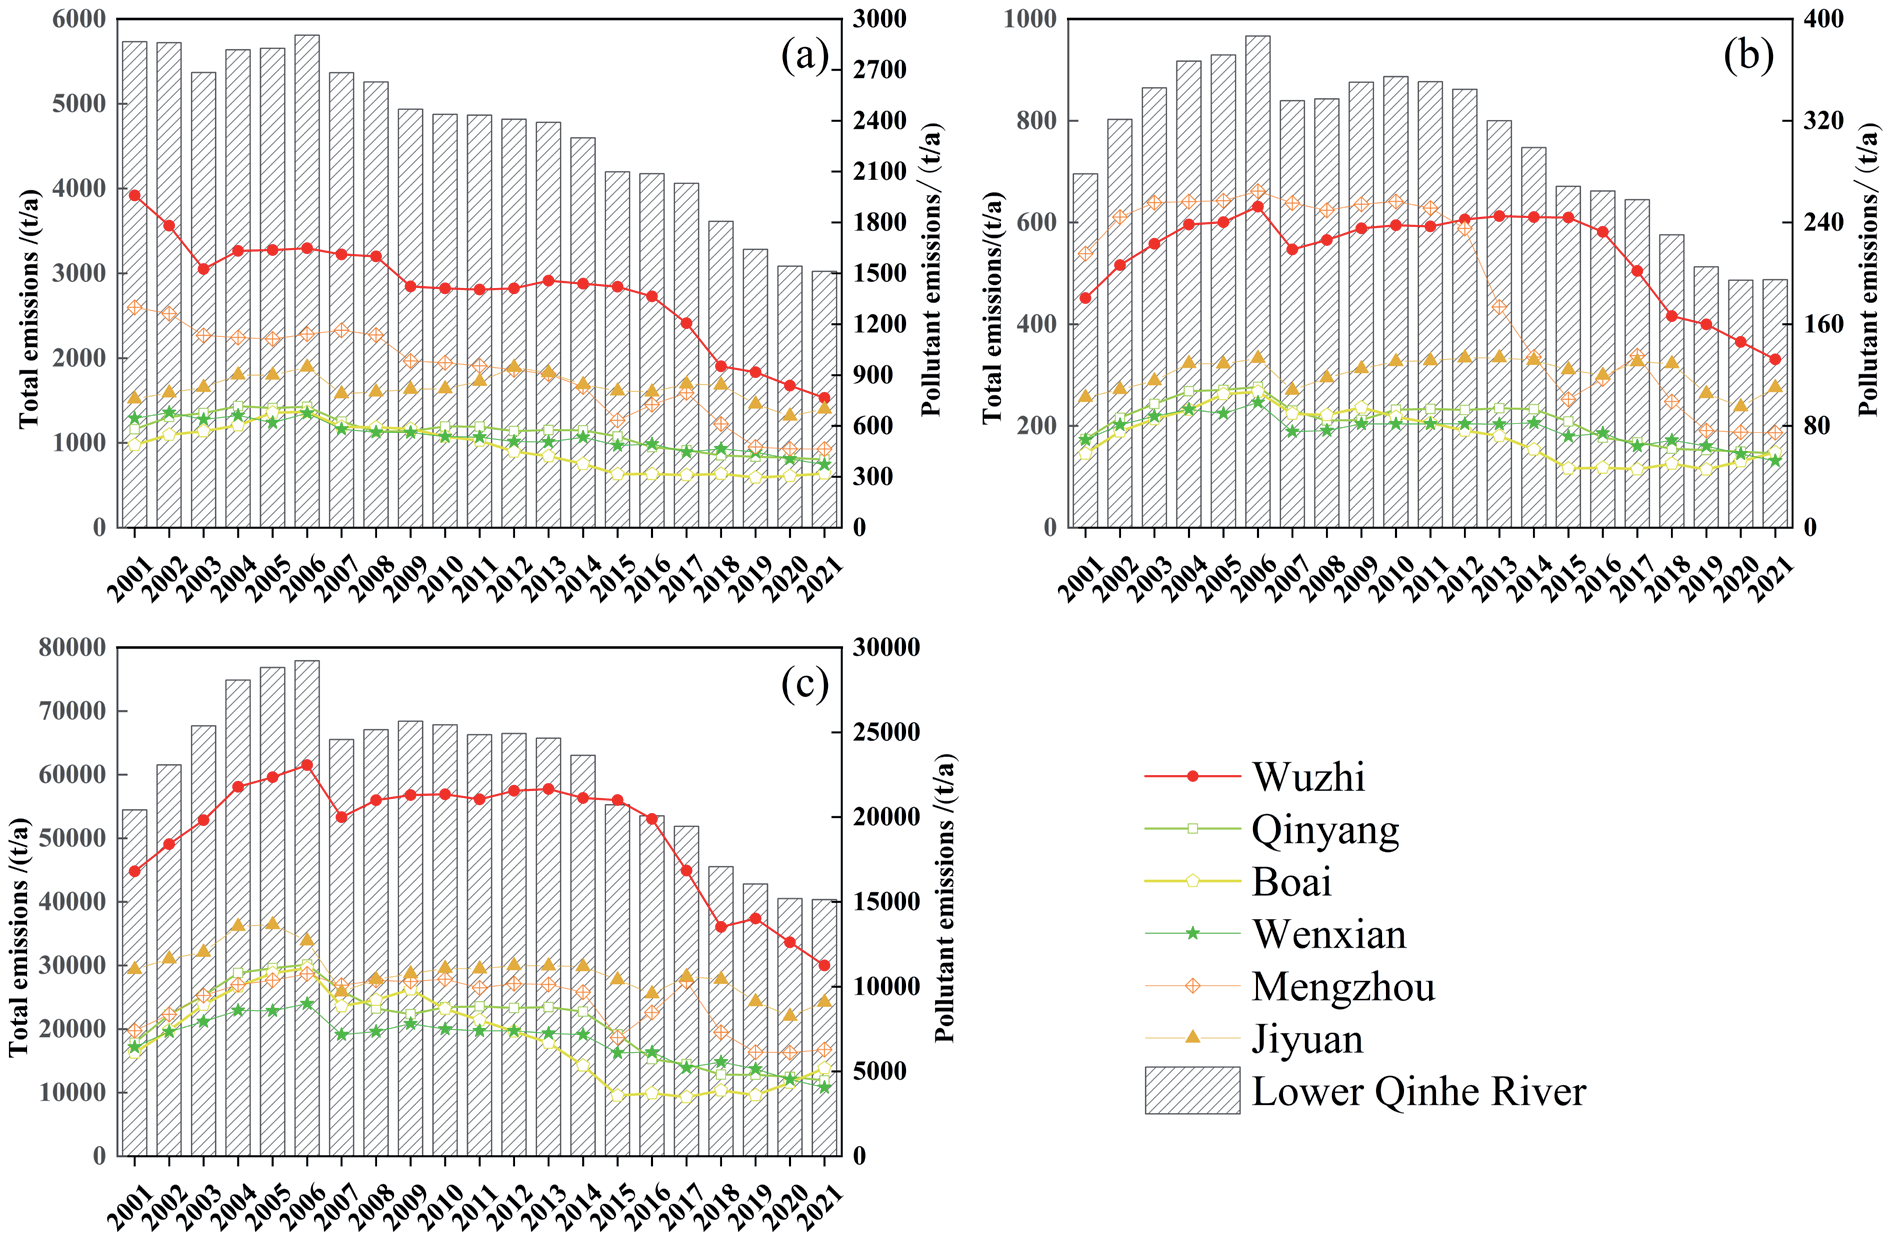
From the perspective of various counties and cities in the lower reaches of the Qin River, TN, TP, and COD exhibited a significant downward trend (P<0.01) (Fig. 3). The TN emissions in Wuzhi County from 2001 to 2021 were higher than those in other counties and cities; TN emissions in Mengzhou City and Jiyuan City are relatively moderate, showing significant fluctuations in reduction. Overall, TN emissions in Qinyang, Boai, and Wen counties reveal a slow downward trend with little change. Wuzhi County and Mengzhou City experienced significant growth before 2006 but remained stable afterward, then displayed a downward trend. TP emissions in Qinyang, Boai, Wen County, and Jiyuan have shown a stable trend, with slight fluctuations in Jiyuan City. The differences in COD emissions among various counties and cities resemble those of TN. Wuzhi County demonstrates a trend of first increasing and then decreasing, while other counties and cities remain stable and slowly decline. Recently, Wuzhi County has actively guided farmers in adjusting their agricultural structure and developing characteristic and efficient agriculture. For example, the development of pillar industries such as edible mushrooms, vegetables, the “Four Major Medicines”, and livestock and poultry. From the perspective of agricultural non-point source pollution, the impact of livestock and poultry breeding on the environment is mainly reflected in solid waste, wastewater, and foul odor gases. Regarding the beef cattle industry, Wuzhi County has been designated as a demonstration county for implementing beef cattle industry projects under the development funds of modern agricultural production in the province. The project includes constructing ten standardized beef cattle farms. Agricultural activities are one of the main sources of pollutants such as TN, TP, and COD emissions. With the expansion of agricultural production scale and the advancement of agricultural technology, the use of fertilizers and pesticides has increased, directly leading to an uptick in the emissions of these pollutants [23]. However, over time, the government and society have increasingly placed importance on environmental protection, taking a series of measures to control and reduce agricultural nonpoint source pollution [24]. For example, to promote the coordinated development of animal husbandry and the ecological environment, Wuzhi County has implemented scientific planning of animal husbandry farms and encouraged ecological breeding models. They optimize the agricultural industry structure, reduce the cultivation of high-input fertilizer-dependent crops, and instead increase investment in agricultural water conservancy and water-saving irrigation facilities. At the same time, they enhance farmers’ awareness and participation in agricultural ecological environment protection, jointly promoting the sustainable development of agriculture.
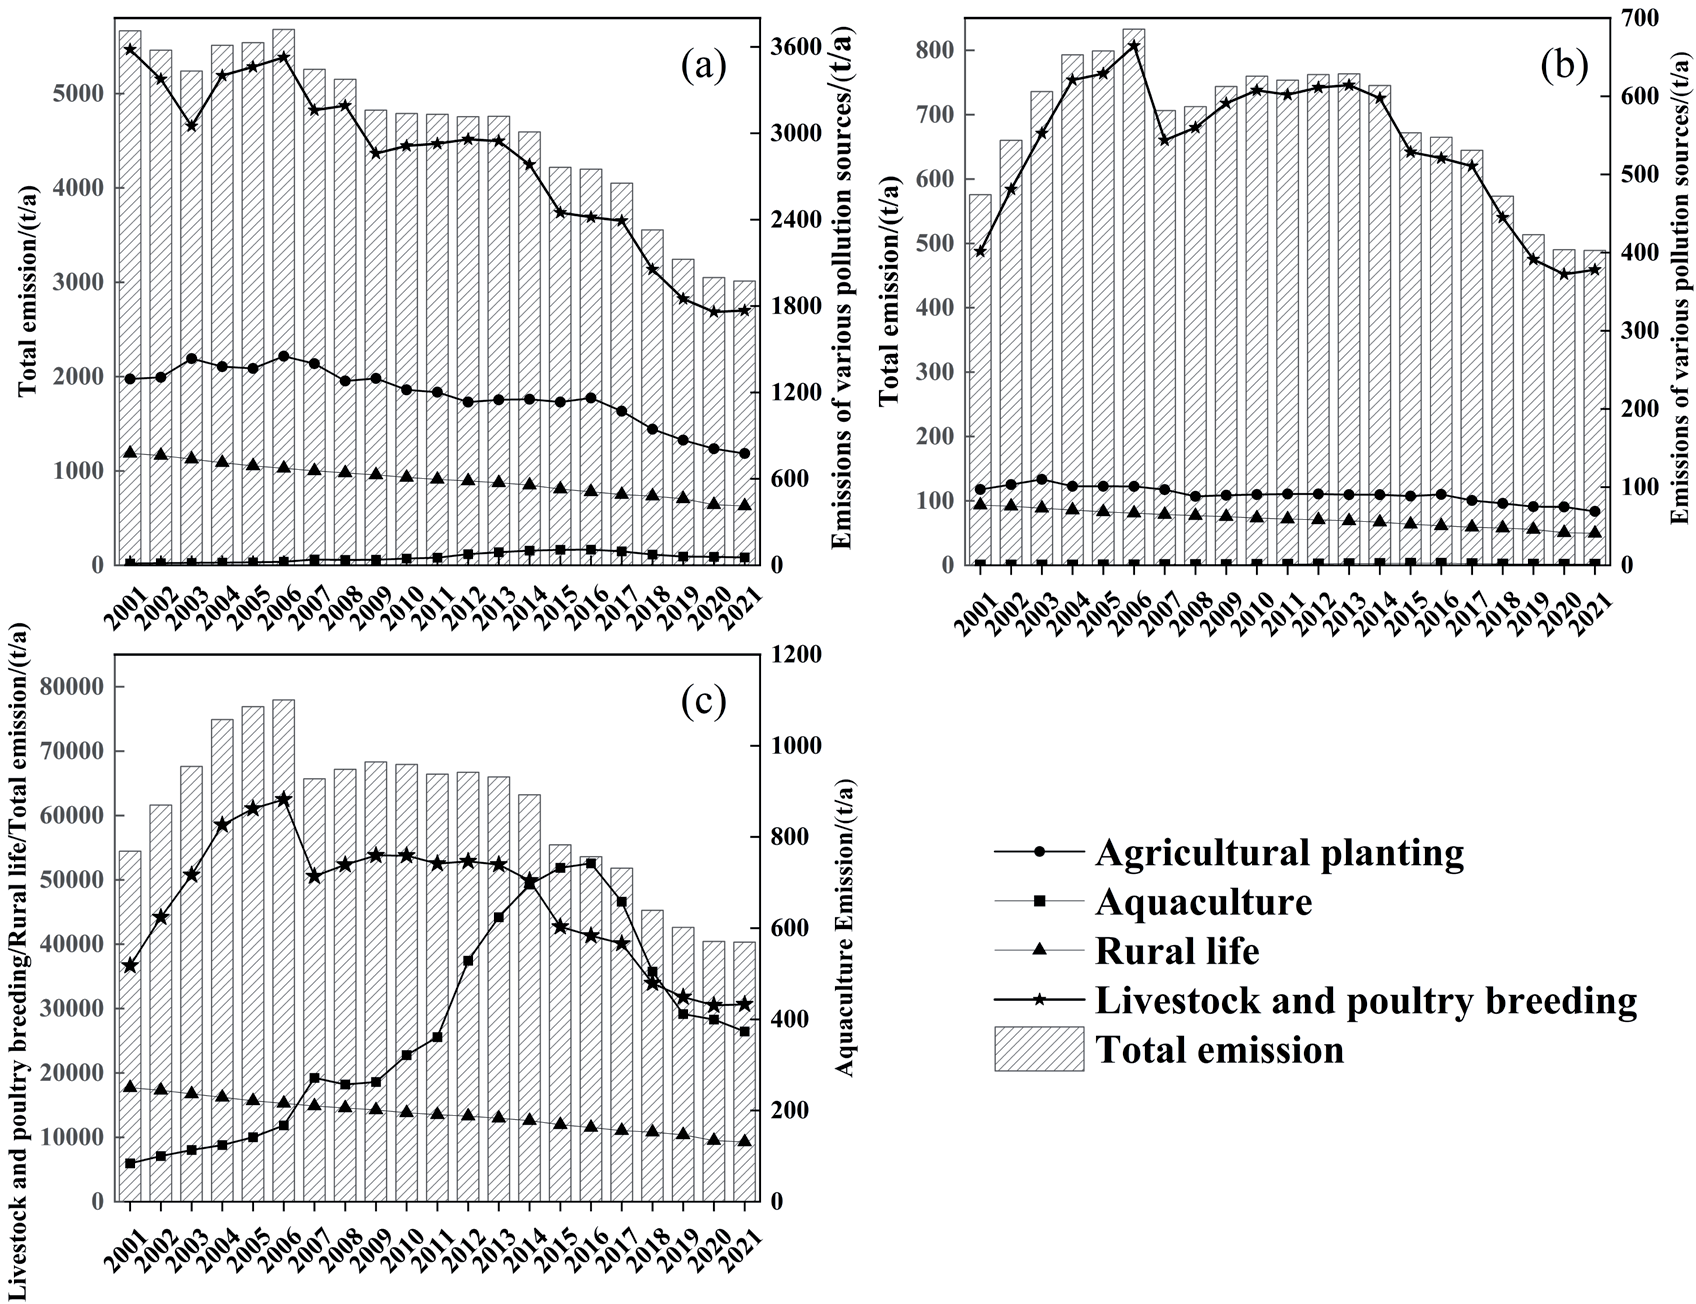
Table 2 shows that the contribution of pollution load emissions in the study area is highest in the livestock and poultry breeding industry, followed by the planting industry, rural living sources, and the aquaculture industry. From the trend of time changes, livestock and poultry farming are the main sources of agricultural nonpoint source pollution in the lower reaches of the Qinhe River, and a decreasing trend is shown. According to the Ministry of Agriculture and Rural Affairs, as of 2021, the equipped rate of manure treatment facilities in large-scale breeding farms in Henan Province has exceeded 95%, and the comprehensive utilization rate of livestock and poultry manure in the province has reached a high level of 82%, from https://nynct.henan.gov.cn. However, due to the high resource utilization and treatment cost, the pollution caused by livestock and poultry manure has not been effectively controlled [25]. From a cost perspective, livestock and poultry manure’s treatment and resource utilization involve collection, storage, treatment, and reuse. These links not only require corresponding infrastructure and technical support but also require significant financial investment. It is a difficult and key point, especially in the sewage treatment process, due to its high energy consumption and significant environmental impact [26]. In addition, small and medium-sized breeding farms often find it difficult to adopt efficient treatment techniques due to financial and technological limitations. Unreasonable policy design is also an important factor. Although the government has implemented measures such as financial support and policy guidance [27], the pollution caused by livestock and poultry manure has not been effectively controlled due to high resource utilization and treatment costs.
Spatial Variation Characteristics of Agricultural Non-Point Source Pollution
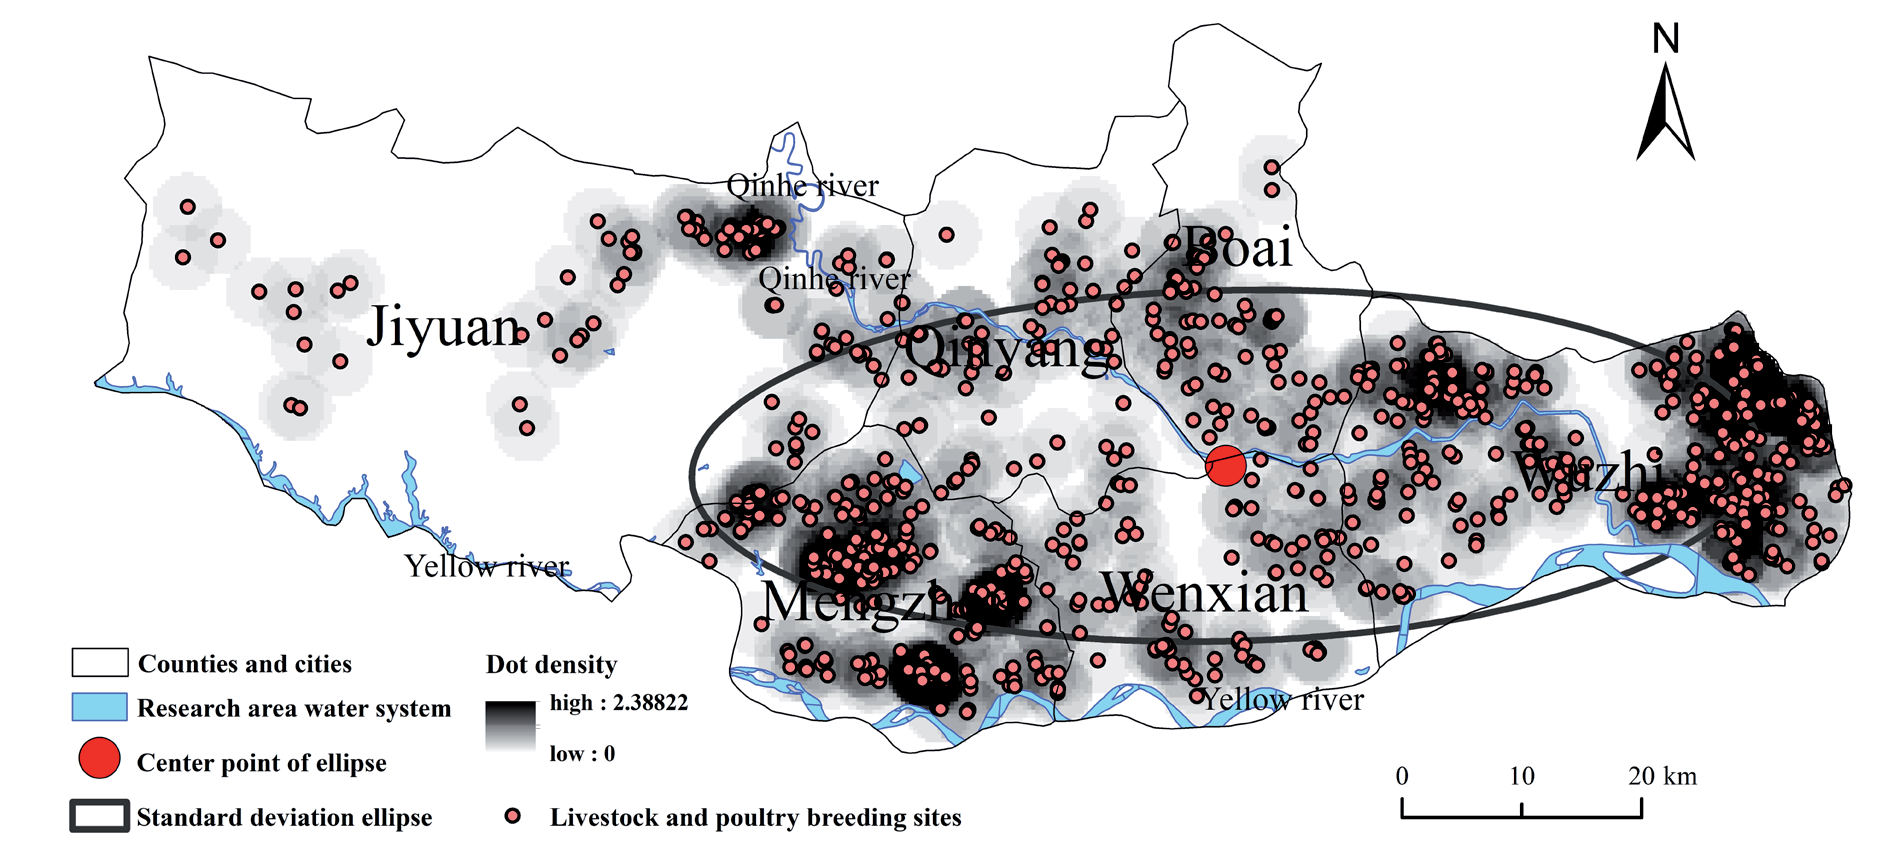
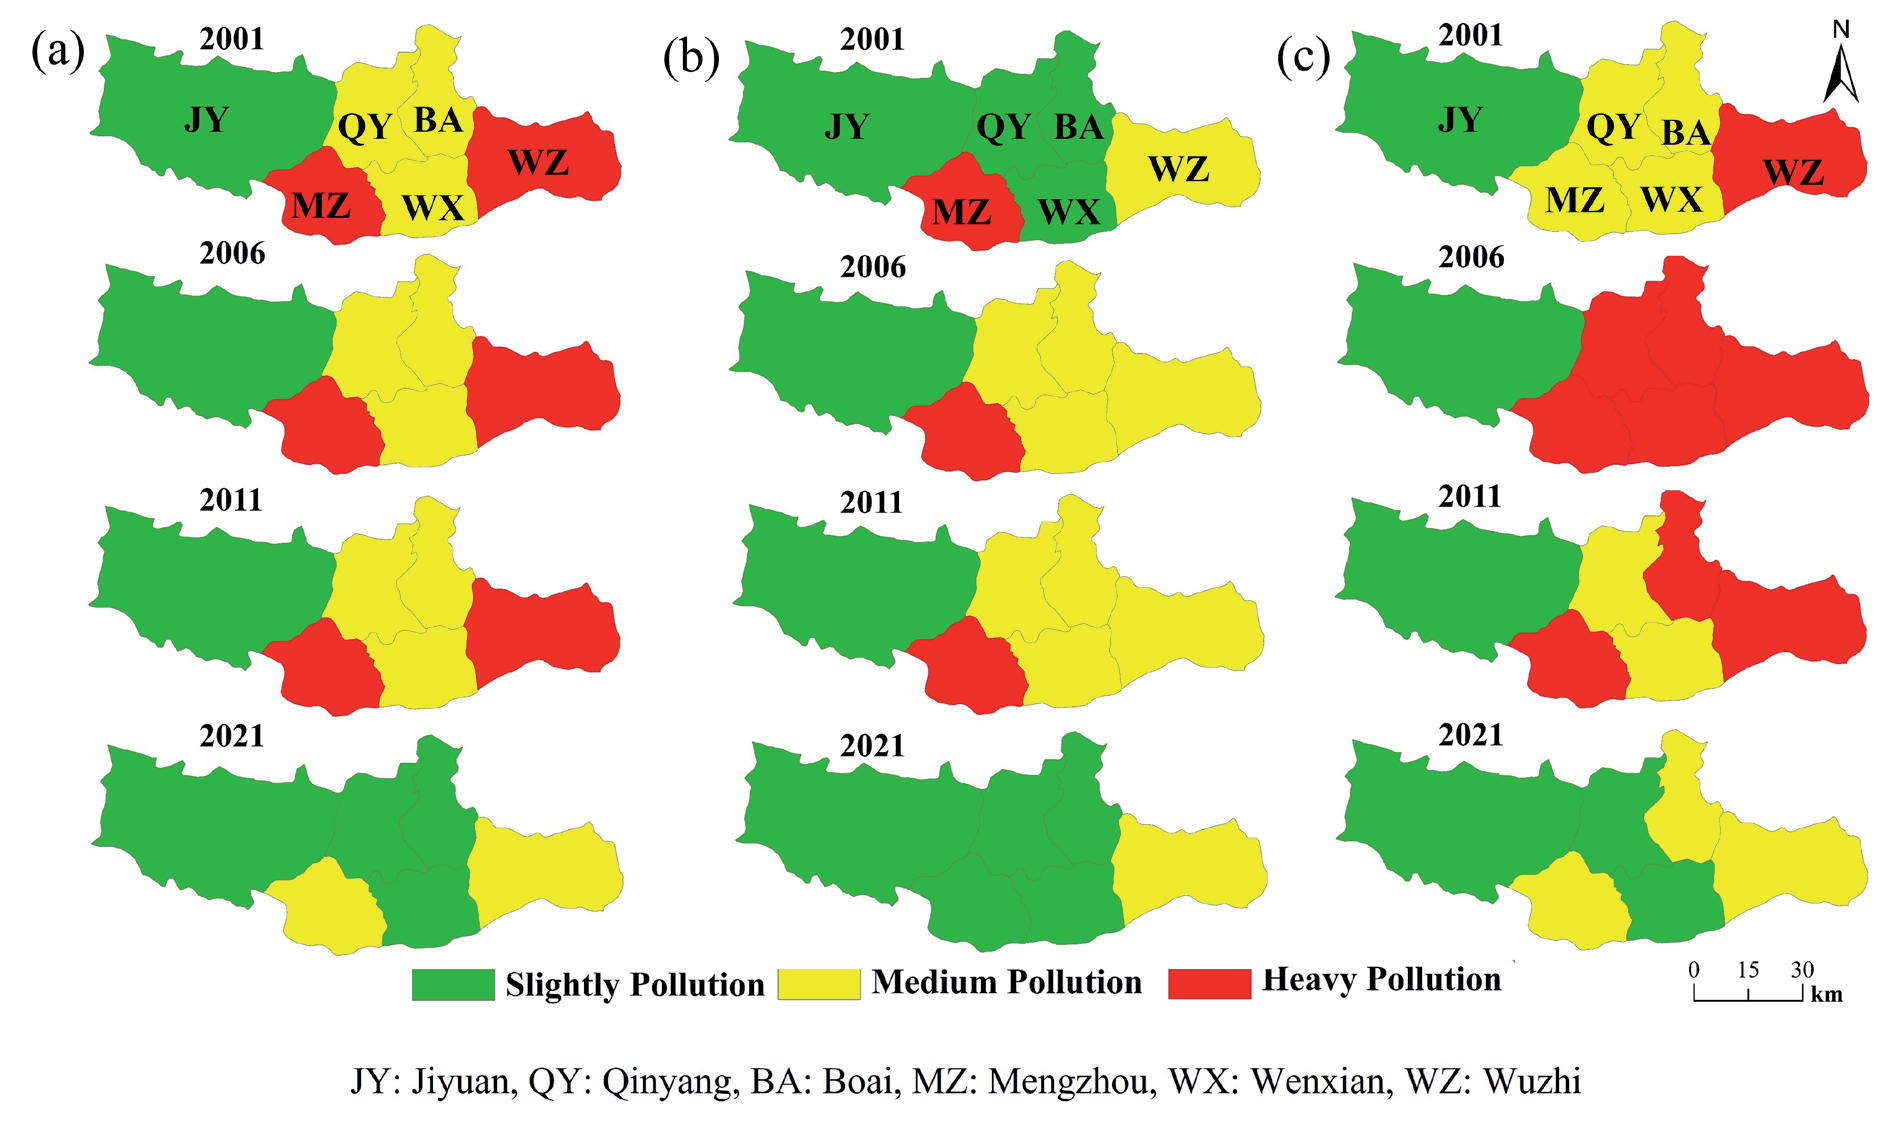
Based on GIS data analysis of pollutant emission intensity per unit area from 2001 to 2021, according to the distribution characteristics of livestock and poultry breeding in the research area (Fig. 4), and combined with the characteristics of water pollution emissions in the Yellow River Basin [28]. The pollution emission intensity per unit area in the lower reaches of the Qin River (Fig. 5) is divided into three levels [29]: heavily polluted areas (TN emissions exceeding 1500 kg/km², TP emissions exceeding 300 kg/km², COD emissions exceeding 20000 kg/km²), moderately polluted areas (750<TN<1500 kg/km², 2150<TP<300 kg/km2, 10000<COD<20000 kg/km2), lightly polluted areas (100<TN<750 kg/km2, 50<TP<150 kg/km2, 5000<COD<10000 kg/km²).
Table 2.
Emissions and contribution ratios of TN, TP, and COD pollutants in 2021.
Fig. 4.
The distribution of livestock and poultry farms in the research area (the location distribution of each farm is based on the author’s on-site investigation).
From the distribution maps of TN, TP, and COD pollution emission intensity in various counties and cities in the lower reaches of the Qin River, it is evident that there are significant spatial differences in agricultural non-point source pollution emissions in different regions. Overall, the pollution intensity is showing a downward trend. In the spatial distribution of TN emission intensity in 2021, Wuzhi County and Mengzhou City are located in moderately polluted areas, while Boai County, Wen County, Qinyang City, and Jiyuan City are located in lightly polluted areas. In the spatial distribution of TP emission intensity in 2021, Wuzhi County is located in a heavily polluted area, Boai County, Wen County, Qinyang City, and Mengzhou City are located in a moderately polluted area, and Jiyuan City is located in a lightly polluted area. Regarding COD emissions intensity, Wuzhi County, Boai County, and Mengzhou City are located in moderately polluted areas, while Wen County, Qinyang City, and Jiyuan City are located in lightly polluted areas. From a spatial distribution perspective, the TN emission intensity remained balanced from 2001 to 2011, with heavy and moderate pollution areas remaining unchanged. By 2021, Wuzhi County and Mengzhou City were downgraded to moderately polluted areas, while others were downgraded to lightly polluted areas. Jiyuan City uses biological agents to control agricultural non-point source pollution. This method includes converting household organic waste and livestock manure into organic fertilizers and plant protectants to replace harmful chemical fertilizers and pesticides, improving farmland drainage systems, and adopting more environmentally friendly farming methods [30]. These measures help reduce runoff and erosion, not only reducing the concentration of total nitrogen and total phosphorus but also lowering the treatment costs, supporting efficient and sustainable agricultural economic development [31].
From 2001 to 2021, the areas with moderate to severe TP emissions gradually decreased, while the areas with moderate pollution initially increased and then decreased, and the areas with mild pollution first decreased and then expanded. The area of heavily polluted sites with COD emissions increased and then decreased from 2001 to 2021, reaching its peak in 2006. The moderate and mild areas decreased first and then increased. From 2001 to 2021, the TN pollution intensity in the lower reaches of the Qinhe River showed a trend of first increasing and then decreasing. Overall, the TN pollution emission intensity in Wuzhi and Mengzhou is generally high, with an average of 1617 kg/hm2 and 1635 kg/hm2, respectively. The pollution emission intensity in Jiyuan and Qinyang is relatively low, with an average pollution intensity of 438.16 kg/hm2 and 957.32 kg/hm2, respectively. The TP pollution intensity in the lower reaches of the Qinhe River shows a trend of first increasing and then decreasing. Overall, the TP pollution emission intensity in Wuzhi and Mengzhou is generally high, with an average of 248.07 kg/hm2 and 340.56 kg/hm2, respectively. The pollution emission intensity in Jiyuan and Qinyang is relatively low, with an average pollution intensity of 64.41 kg/hm2 and 142.95 kg/hm2, respectively. The COD pollution intensity in the lower reaches of the Qinhe River shows a trend of first increasing and then decreasing. Overall, the COD pollution emission intensity in Wuzhi and Mengzhou is generally high, with an average of 22018.87 kg/km2 and 16181.43 kg/km2, respectively. The pollution emission intensity in Jiyuan and Wen County is relatively low, with an average pollution intensity of 5791.24 kg/km2 and 12950.59 kg/km2, respectively. The trend of “first increasing, then decreasing” in TN, TP, and COD pollution intensities aligns with the region’s broader narrative of agricultural development. Initially, rapid agricultural intensification and expansion likely led to uncontrolled pollution emissions. The subsequent decline could reflect the implementation of pollution control measures, such as stricter regulations on livestock waste management, adoption of green agricultural technologies, and efforts to promote ecological farming practices. The concentration of intensive livestock and poultry farms in Wuzhi and Mengzhou is a major driver of TN and TP emissions. The improper management of manure and wastewater from these farms leads to nutrient overloading in the environment, contributing to water eutrophication and soil degradation. Excessive fertilization in these areas exacerbates TN and TP pollution. The lack of optimized fertilizer application techniques results in runoff during rainfall, contributing to non-point source pollution in water bodies. High COD pollution intensity indicates that organic matter pollution is from agricultural runoff, livestock waste, and potentially untreated rural domestic sewage. This highlights the need for better waste treatment infrastructure in rural areas. Intensive agriculture uses fertilizers, pesticides, and centralized farming to exacerbate pollution. Through efficient resource management and pollution control, it is necessary to promote precision fertilization, crop rotation, manure resource utilization, and sustainable and intensive transformation [32].
Strengthening Pollution Control in High-Intensity Areas: Wuzhi and Mengzhou require stricter regulations to control waste discharge from large-scale intensive livestock and poultry farms. Advanced manure treatment technologies and ecological clean breeding models should be promoted to minimize environmental impacts [33]. A real-time monitoring system for wastewater discharge from large-scale aquaculture farms can be established, incorporating TN/TP online monitoring data into the environmental credit evaluation system. The Danish “centralized pretreatment + regional pipeline network transportation” model can be adopted, and the government can bear a certain proportion of the pipeline network construction cost to achieve centralized collection of manure from breeding farms within a radius of 10 km [34]. A tiered environmental tax system can be implemented to reduce income tax by 30% for compliant emission enterprises [35].
Spatial Planning and Density Optimization: In high-pollution areas, the density of animal husbandry operations should be carefully managed to prevent localized environmental degradation. Designate a no-breeding area 3 km away from the main stream of the Qin River and 1km away from its tributaries, and control the livestock carrying capacity in the core area below 2.5 pig equivalents per hectare. The Netherlands established a “red, yellow, and green” zoning system through the Spatial Planning Act and implemented a breeding rights trading system for the overly dense Brabant province, resulting in a 28% reduction in ammonia emissions in the basin within 5 years [36]. It is suggested that a trading platform for spatial carrying capacity indicators be introduced, allowing enterprises to achieve compliant development by purchasing environmental capacity quotas in adjacent low-density areas.
Adoption of Green Agricultural Technologies: Farmers should be encouraged to adopt green technologies, such as precision agriculture, organic farming practices, and controlled-release fertilizers, to reduce nutrient runoff and improve resource efficiency. We can promote variable fertilization systems based on soil NPK sensors and develop localized fertilization model databases. As more than half of the elderly farmers in the region have low acceptance of smart devices, the cost of slow-release fertilizers is 220-350 yuan/mu higher than conventional urea, and there is a lack of regional agricultural technology service network support. We can establish a three-level training system consisting of “technical promoters, demonstration farms, and field schools” [37]. Pilot the “Green Technology Insurance” in Wuzhi County, where the government, collective, and individuals each bear a certain proportion of the risk losses of new technology applications.
Promoting Harmless Treatment of Livestock Manure: Retail investors and small-scale farmers should be incentivized to adopt the harmless treatment of manure and resource utilization. This could include composting, biogas production, and other recycling technologies that turn waste into valuable resources [38]. Establish regional manure treatment cooperatives for individual investors and small-scale breeders. The investment payback period for small-scale biogas projects (50 m³) is as long as 8-10 years, and the processing cost increases sharply when the transportation radius exceeds 15 km. We can learn from the German approach and require energy companies to prioritize the purchase of farm biogas, implement a quality certification system for biogas residue and slurry, and increase the profit margin of small-scale biogas stations to 12% [39].
Watershed-Scale Management: Implementing total nitrogen and phosphorus control at the watershed level is essential to address pollution comprehensively [40]. Integrated watershed management approaches can optimize land use, regulate nutrient inputs, and enhance water quality across the entire region. Build a pollution rights trading alliance covering the lower reaches of the Qin River basin and implement monthly water quality section assessments. The current Water Pollution Prevention and Control Law does not specify the ecological compensation standards across administrative regions. Abnormal differences in upstream and downstream monitoring data have led to 38% of boundary disputes, and fluctuations in environmental capacity during the dry season have resulted in an imbalance in total allocation. Reference can be made to the Rhine River management by establishing a cross-border pollution traceability system through the ICPR committee, using “pollution fingerprinting” technology to achieve a 65% reduction in TN emissions within the basin [41]. Suggest introducing blockchain technology to build an immutable cross-regional monitoring data platform.
Fig. 5.
Temporal and spatial distribution of a) TN, b) TP, and c) COD emission intensity in the study area.
Enhancing Environmental Awareness: Raising the environmental awareness of farmers and rural communities is crucial for achieving sustainable agricultural practices. Policy incentives, training programs, and financial subsidies can encourage farmers to adopt environmentally friendly practices.
Evolution Characteristics of the Agricultural Non-Point Source Pollution Structure
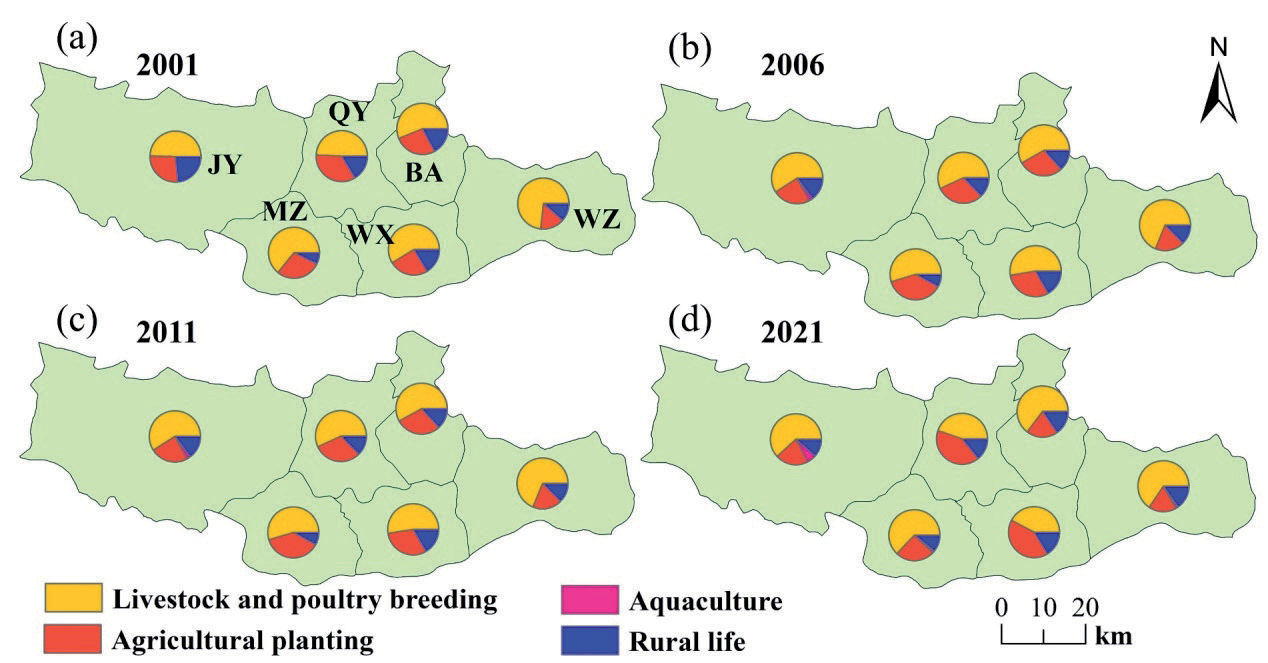
The main contributors to agricultural non-point source pollution in TN in the lower reaches of the Qinhe River are livestock and poultry breeding. As shown in Fig. 6, from 2001 to 2021, the TN emissions generated by livestock and poultry farming in various counties and cities were generally above 50%, and some counties and cities reached over 70%, showing a decreasing trend. Agricultural planting and rural life are the other two main factors contributing to the TN source in the lower reaches of the Qinhe River. In 2001, the proportion of livestock and poultry breeding in Wuzhi County was the highest, reaching 73.3%, followed by Mengzhou City, Wen County, and Boai County, reaching 64%, 58.6%, and 56%, respectively. In 2006, the emissions from various sources of TN reached their peak. In 2007, the General Office of the State Council issued the “Opinions on Strengthening Rural Environmental Protection Work” [42], vigorously promoting the control of rural domestic pollution, strengthening the prevention and control of pollution from livestock, poultry, and aquaculture, controlling agricultural non-point source pollution, and focusing on solving prominent environmental problems in rural areas. In 2021, the proportion of livestock and poultry farming in Wen County decreased the most, dropping to 42.1%, while in Wuzhi County it decreased to 65.5%. In 2021, TN emissions from rural living sources in Wen County were the highest, reaching 16.36%. In 2021, TN emissions from agricultural planting in Wen County were the highest, reaching 41.3%.
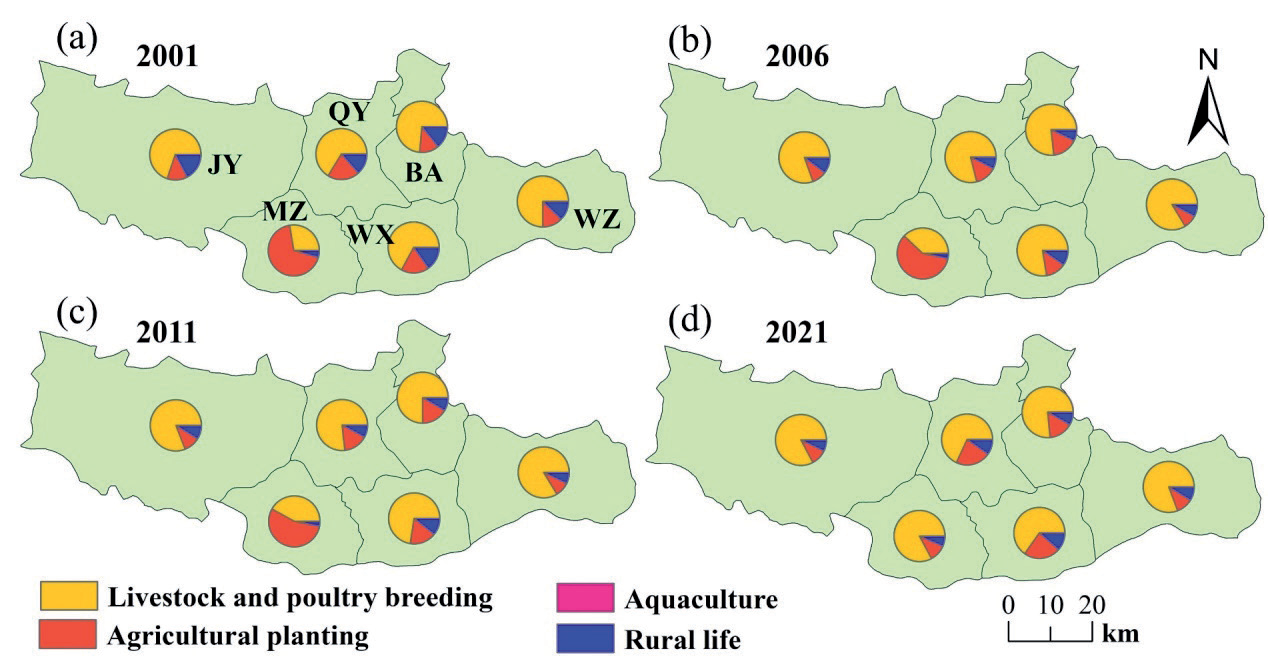
Fig. 7 shows the distribution characteristics of TP source structure in the dominance of livestock and poultry breeding in TP emissions. The data shows that livestock and poultry breeding are the primary contributors to TP emissions across the counties and cities in the lower reaches of the Qinhe River. This indicates the need for targeted management practices and advanced technologies in the livestock sector to mitigate environmental impacts. The consistently high contributions in Wuzhi County and the significant growth in Mengzhou City emphasize the regional variability and the need for differentiated governance strategies tailored to local circumstances.
Wuzhi County consistently had the highest proportion of TP emissions from livestock and poultry breeding, peaking at 85.6% in 2011. This indicates a strong dependence on livestock-based agriculture in the county. Such high proportions suggest an urgent need to implement stricter regulations, promote ecological breeding models, and invest in manure treatment and nutrient recycling technologies. Mengzhou City, on the other hand, exhibited a more dynamic pattern, with TP emissions from livestock and poultry breeding increasing sharply from 27.52% in 2001 to 82.68% in 2021. This trend suggests a rapid intensification of livestock and poultry breeding in Mengzhou City, possibly due to policy or economic drivers favoring livestock production. The rapid growth has raised concerns about inadequate infrastructure for waste management and potential environmental degradation; therefore, it is necessary to take necessary measures to control pollution levels.
Wen County, with the lowest TP emissions proportion at 65.24% in 2021, shows a relatively balanced agricultural structure compared to the other areas. However, the Fig. 7 is still significant, indicating that livestock and poultry breeding remain a major pollution source. From 2001 to 2021, the TP emissions from livestock and poultry breeding in the lower reaches of the Qinhe River generally followed a pattern of “first increasing, then decreasing”. This trend likely reflects the initial intensification of livestock and poultry breeding without adequate pollution control measures, followed by some level of intervention or adaptation of pollution management practices. The increasing trend in Mengzhou City throughout the period contrasts with the “increase-decrease” trend in other areas. This suggests that Mengzhou City either lagged in implementing effective pollution control measures or experienced accelerated development in livestock and poultry breeding [43], leading to higher emissions over time.
In high-emission areas like Wuzhi County, strict control of large-scale intensive livestock and poultry breeding, promotion of manure treatment technologies, and resource utilization measures are critical to curb emissions. Spatial planning to optimize the density of livestock and poultry breeding is also essential [44]. In Mengzhou City, where emissions have shown continuous growth, it is crucial to prioritize investments in green breeding technologies, establish centralized waste treatment facilities, and incentivize farmers to adopt sustainable practices. For Wen County, with relatively lower emissions, efforts should focus on maintaining the balance between agricultural activities and environmental protection [45], ensuring that TP emissions remain manageable while promoting agricultural productivity.
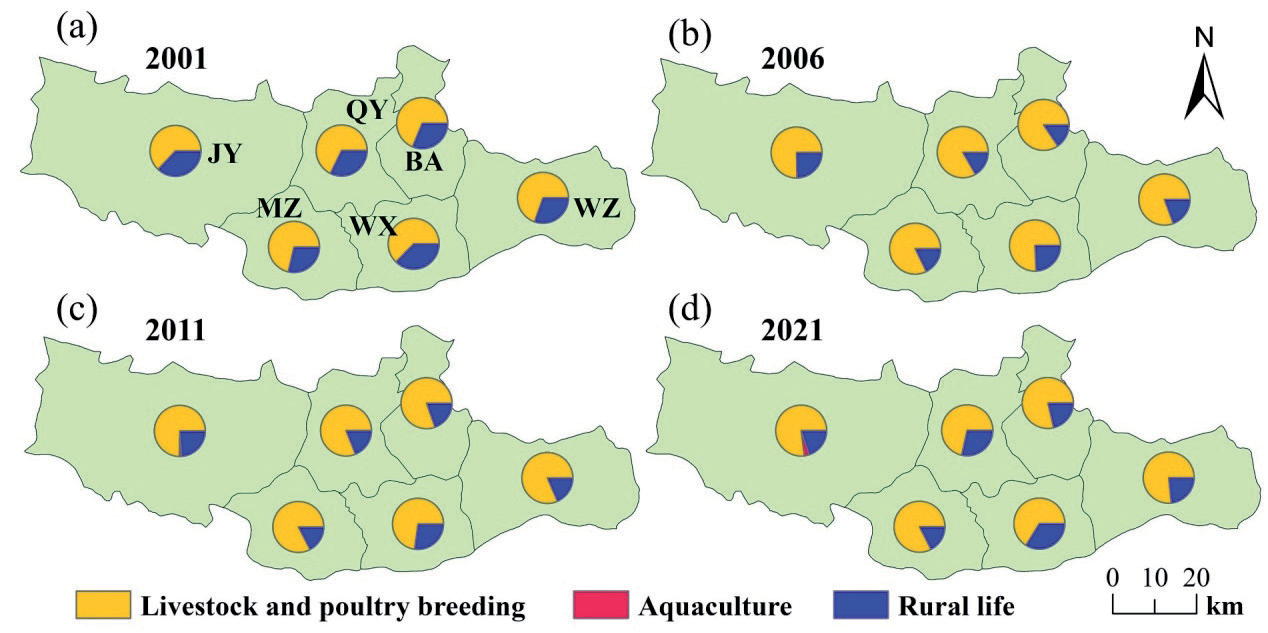
Fig. 8 shows the distribution characteristics of the source structure of COD in agricultural non-point source pollution in the lower reaches of the Qin River. It can be seen that livestock and poultry breeding and rural life are the main sources. The COD emissions generated by livestock and poultry breeding in the lower reaches of the Qin River account for more than 62% of the total emissions, while the COD generated by aquaculture is negligible. The proportion of livestock and poultry breeding to rural life remained stable from 2001 to 2021.
Conclusions
Through in-depth analysis of the continuous years of various administrative regions in the lower reaches of the Qin River, the total nitrogen (TN), total phosphorus (TP), and chemical oxygen demand (COD) emissions from four major areas, including livestock and poultry breeding, agricultural planting, rural life, and aquaculture, were quantitatively estimated. Systematically revealed the spatiotemporal distribution characteristics of different types of agricultural nonpoint source pollution and their respective impacts on the environment, and summarized the following conclusions:
Between 2001 and 2021, TN emissions from agricultural non-point source pollution in the study area showed a steady downward trend, while the emissions of TP and COD first increased and then decreased. Compared to 2001, the total emissions of TN, TP, and COD in 2021 decreased by 47.25%, 29.9%, and 25.92%, respectively.
From a spatial distribution perspective, the emission intensity of TN, TP, and COD reached its peak in 2006, especially the COD emission intensity, which accounted for 61.65% of the heavily polluted areas and was the primary pollutant in the study area. By 2021, the coverage area of heavily polluted areas had significantly decreased, and all had been reduced to moderately or mildly polluted areas. According to the classification of pollutant emission intensity, Mengzhou City is a heavily polluted area for TN and TP, with TN emission intensity exceeding the average level of the lower reaches of the Qin River by 47.78% and TP reaching as high as 87.17%. Mengzhou City and Wuzhi County have severe COD pollution, with COD emission intensities exceeding the average level by 14.62% and 55.97%, respectively.
From the perspective of pollution source composition and pollutant distribution, the contribution rate of livestock and poultry farming is the largest in TN emissions in the lower reaches of the Qin River, followed by planting, rural living sources, and aquaculture. The livestock and poultry breeding industry ranks first for TP and COD emissions, followed closely by rural living sources and aquaculture. Livestock and poultry farming contribute over 50% to TN, TP, and COD emissions. In terms of total pollutant emissions, COD emissions far exceed TN and TP, with their average contribution rates of 91.7%, 7.15%, and 1.15%, respectively.
Therefore, it is urgent to strengthen the management of livestock and poultry breeding pollution in the research area, especially in terms of reducing COD emissions. Especially in small-scale breeding farms, we actively promote technologies such as “returning manure and water on-site” and high-temperature composting, combined with planting and breeding, strictly regulate the scale of livestock and poultry breeding and manure treatment facilities, and convert livestock and poultry breeding waste into feed, not only solving the problem of waste treatment but also providing new feed resources for the breeding industry, ultimately promoting the circular utilization of rural living resources.
Because the lowest level of statistical yearbook data is based on county-level units, it is difficult to capture the heterogeneity of township-level pollution sources, which may bring uncertainty to the actual situation in the region. Secondly, the spatial resolution of pollution intensity maps is limited by the boundaries of administrative units and the interannual climate changes of pollutant migration, such as river flow and rainfall, which restrict the fine analysis of cross-regional pollution diffusion.
Future research can attempt to introduce data sources with higher spatial resolution, which can be combined with remote sensing technology and geographic information systems. Regarding the impact of pollutant migration, climate and hydrological models can be introduced to analyze the influence of interannual variations in river flow and precipitation on pollutant diffusion.

