Introduction
Agricultural non-point source pollution (AGNPS) has jeopardized the safety of the water environment and sustainable agricultural development worldwide. This is mainly generated by the irrational use of means of production [1], which is affected by human activities [1]. Land use, as one of the main areas for human activities, may have an impact on the AGNPS. In recent years, global land use has resulted in dramatic changes in landscape patterns, which in turn have led to the fragmented distribution of land parcels [2]. Agricultural production activities on dispersed land resulted in a small-scale and fragmented distribution of land parcels [3], especially in China. Land fragmentation (LF) may have some impact on AGNPS. However, few scholars have conducted in-depth analyses regarding their relationship. Therefore, the study of the relationship and the impact intensity of LF on AGNPS is of great significance for water protection and agricultural development.
With the rapid development of agriculture, scholars have conducted numerous studies on AGNPS caused by different sources of pollution and different pollutants. Some scholars have studied the AGNPS generated by cultivation [4-6], while others have measured the AGNPS generated by cultivation and livestock farming [7, 8]. None of the above studies on AGNPS considered rural life as a source of pollution. In the study of pollutant types, some scholars considered that pollution was concentrated on nutrients such as nitrogen and phosphorus [9-11]. Some researchers measured total nitrogen (TN), total phosphorus (TP), and chemical oxygen demand (COD) emissions [12, 13]; other scholars measured TN, TP, and ammonia nitrogen (NH3-N) emissions [14]. In most of the above studies, scholars simultaneously considered TN and TP pollutants and neglected to measure COD or NH3-N. However, the main sources of AGNPS include the four pollutants: TN, TP, COD, and NH3-N. COD is mainly caused by domestic wastewater and agricultural discharges. NH3-N is mainly nitrogenous waste from human activities such as chemical fertilizers and livestock farming. NH3-N [15] and COD [16] were also important indicators for evaluating the water environment. Through the review of the literature, the above studies did not consider the pollution sources or pollutant types comprehensively enough, making it difficult to measure AGNPS accurately. AGNPS causes atmospheric, water, soil, and microbial pollution, which is harmful to the human environment and adversely affects people's health. In the existing studies, few scholars have comprehensively analyzed pollution sources and pollutant types.
The relationship between AGNPS and land use change has been a focus of scholars' attention. Initially, scholars mainly concentrated on the connection between AGNPS and land use types. Some scholars have found that pollutant output was closely related to agricultural land [17], forest land [18], and other types of land. The ratio of cropland to forest could directly affect the concentration of nitrogen. Furthermore, forest land, as a "sink" landscape, had a significant interception effect on pollutants in rivers [19]. Different land use types are spatially distributed and combined to form different landscape patterns, and landscape patterns have an important effect on the efficient utilization of water resources [20]. With the depth of research, scholars introduced the landscape pattern index into the related research. This index can reflect characteristics of land spatial structure configuration. Researchers focused on the correlation between it and non-point source pollution. Scholars [21] found that TN was mainly influenced by patch density (PD), while TP was closely related to the cropland interspersion and juxtaposition index (IJI). From the view of landscape patterns, analyzing the relationship between regional outputs of AGNPS pollutants and LF can reflect the management of land use. Exploring the relationship and impact intensity of land fragmentation on AGNPS was helpful in realizing the precise control of pollution, but few scholars have studied this.
Overall, research on AGNPS and land fragmentation still faces the following challenges. (1) Research on AGNPS is not comprehensive enough in terms of sources and types of pollutants to analyze the sources of pollution from multiple perspectives. (2) Presently, few scholars have noticed the relationship and impact intensity of land fragmentation on AGNPS.
Therefore, this study measured AGNPS emissions using inventory analysis and the equivalent pollution load method and comprehensively analyzed its dynamic changes and sources. In addition, this paper explored the impact intensity of land fragmentation on AGNPS. The main innovations are as follows: (1) On the basis of the existing research, four pollutants produced by three sources were calculated comprehensively. (2) This study discussed the relationship and impact intensity of land fragmentation on AGNPS by using Spearman correlation analysis and random forest models.
The rest of the paper is structured as follows: Section 2 presents the status of the study area. Section 3 describes the methodology and data sources. Section 4 describes the results of this study. Section 5 discusses the differences between this study and other studies and provides corresponding policy recommendations. Section 6 summarizes the main conclusions.
Study Area
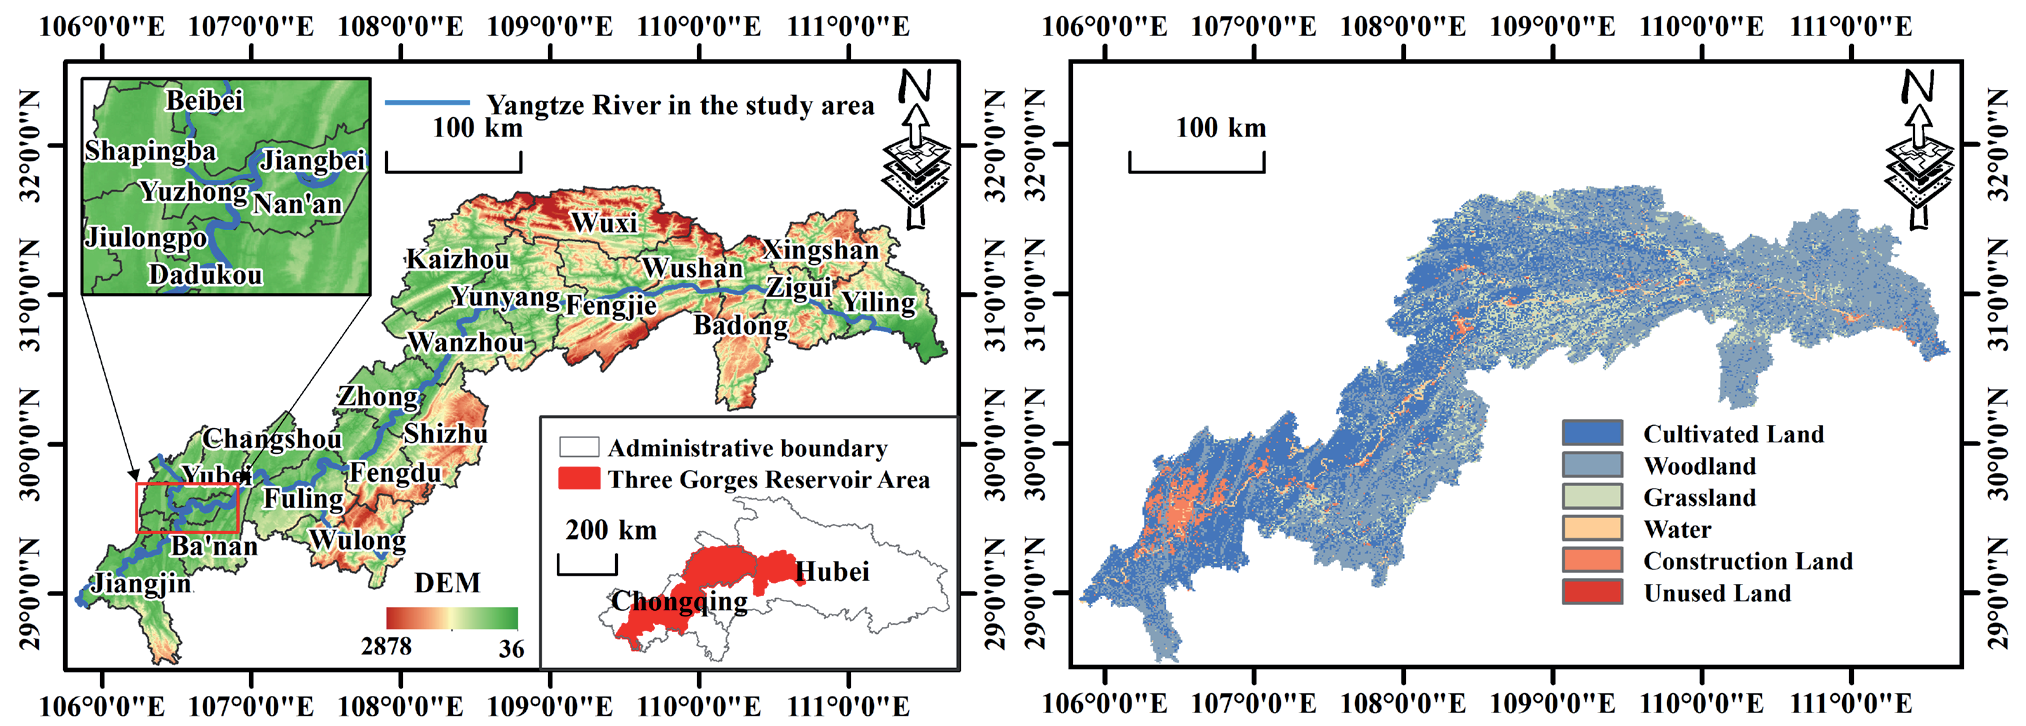
The Three Gorges Reservoir Area (TGR) is the area flooded by the Three Gorges Project of the Yangtze River. It is located in the combination of the Sichuan Basin and the plains of the middle and lower reaches of the Yangtze River. Primarily, it includes one district and three counties in the Hubei Province and ten counties and twelve districts in Chongqing (Fig. S1). The reservoir area is a vital freshwater resource and ecological reserve area in China. The TGR has abundant rainfall with an average annual precipitation of 1,036 millimeters, and it has an average annual temperature of 16 degrees Celsius. The reservoir area is diverse in natural resources and suitable for the comprehensive development of agriculture, forestry, animal husbandry, and fishery.
From the land use perspective, forests, croplands, and grasslands in the TGR together comprise more than 80% of the entire area, and the land use has changed dramatically in recent years. A large amount of land has been inundated, relocated, resettled, and reconstructed. The area of cropland has decreased dramatically, while that of forestland, construction land, and water area has increased year by year, which may increase land fragmentation. From the water environment perspective, treatment has improved AGNPS in the TGR; however, challenges still remain. Among them, the irrational use of chemical fertilizer is the larger problem of AGNPS. In 2020, the application of agricultural fertilizer in the TGR reached 657,000 tons, and pesticide use was 12,000 tons, with an average fertilizer use intensity of 319.14 kg/ha. China does not currently have a uniform limit for fertilizer use intensity, but it already exceeds the 225 kg/ha safety limit set by developed countries. Therefore, a comprehensive analysis of the sources and pollutants of AGNPS in the TGR is the key to controlling AGNPS from the source.
Materials and Methods
Measurement of Agricultural Non-Point Surface Pollution
Inventory Analysis
Inventory analysis refers to the investigation, data acquisition, and quantitative analysis of raw materials, energy, and emissions to the environment consumed by a product, process, or activity throughout its life cycle in the identified product system, according to the material balance and energy balance. According to previous research results [22] and the current situation of the study area, the AGNPS was divided into three categories: planting industry, livestock farming, and rural livelihoods. The pollutants included COD, TN, TP, and NH3-N. The specific accounting method is shown in Table S1.
In this paper, the regional AGNPS emissions were calculated by taking districts and counties as the accounting units. It was calculated as follows:
In equation (1), Qi is the discharge of ANGPS of pollutant i; Qdi represents the discharge of rural domestic sewage pollution from pollutant i; Qwi denotes the amount of rural domestic waste pollution emissions of pollutant i; Qli represents the emission of pollutant i from livestock and poultry farming; Qri is the plantation emissions of pollutant i.
Equivalent Pollution Load Method
In the evaluation of pollution sources, scholars have mostly adopted the equal-scaled pollution load method to standardize the volume of pollution sources. That is, various pollutant emissions are transformed into a uniform and comparable volume so that they can be compared on the same scale. Then, the main pollutants, main pollution accounts, and total pollution loads are determined.
The equivalent pollution load Pi for pollutant i is:
In equation (2), Coi is the threshold concentration of pollutant i. Threshold concentrations of COD, NH3-N, TN, and TP were adopted from the Class V standard (COD ≤ 40 mg/L, TN ≤ 2.0 mg/L, TP ≤ 0.4 mg/L, and NH3-N ≤ 2.0 mg/L) in the "Environmental Quality Standard for Surface Water" (GB3838-2002).
The equivalent standardized pollution load Pn of the source is:
In equation (3), n represents the pollutant type.
The regional equivalent pollution load P is:
In equation (4), m denotes the regional pollution sources number.
The total equivalent regional load PiTotal for pollutant i is:
The pollution load ratio Kn of the source in the region is:
The pollution compliance ratio KiTotal of pollutant i in the region is:
Assessment of Land Fragmentation
Selection of Evaluation Indicators
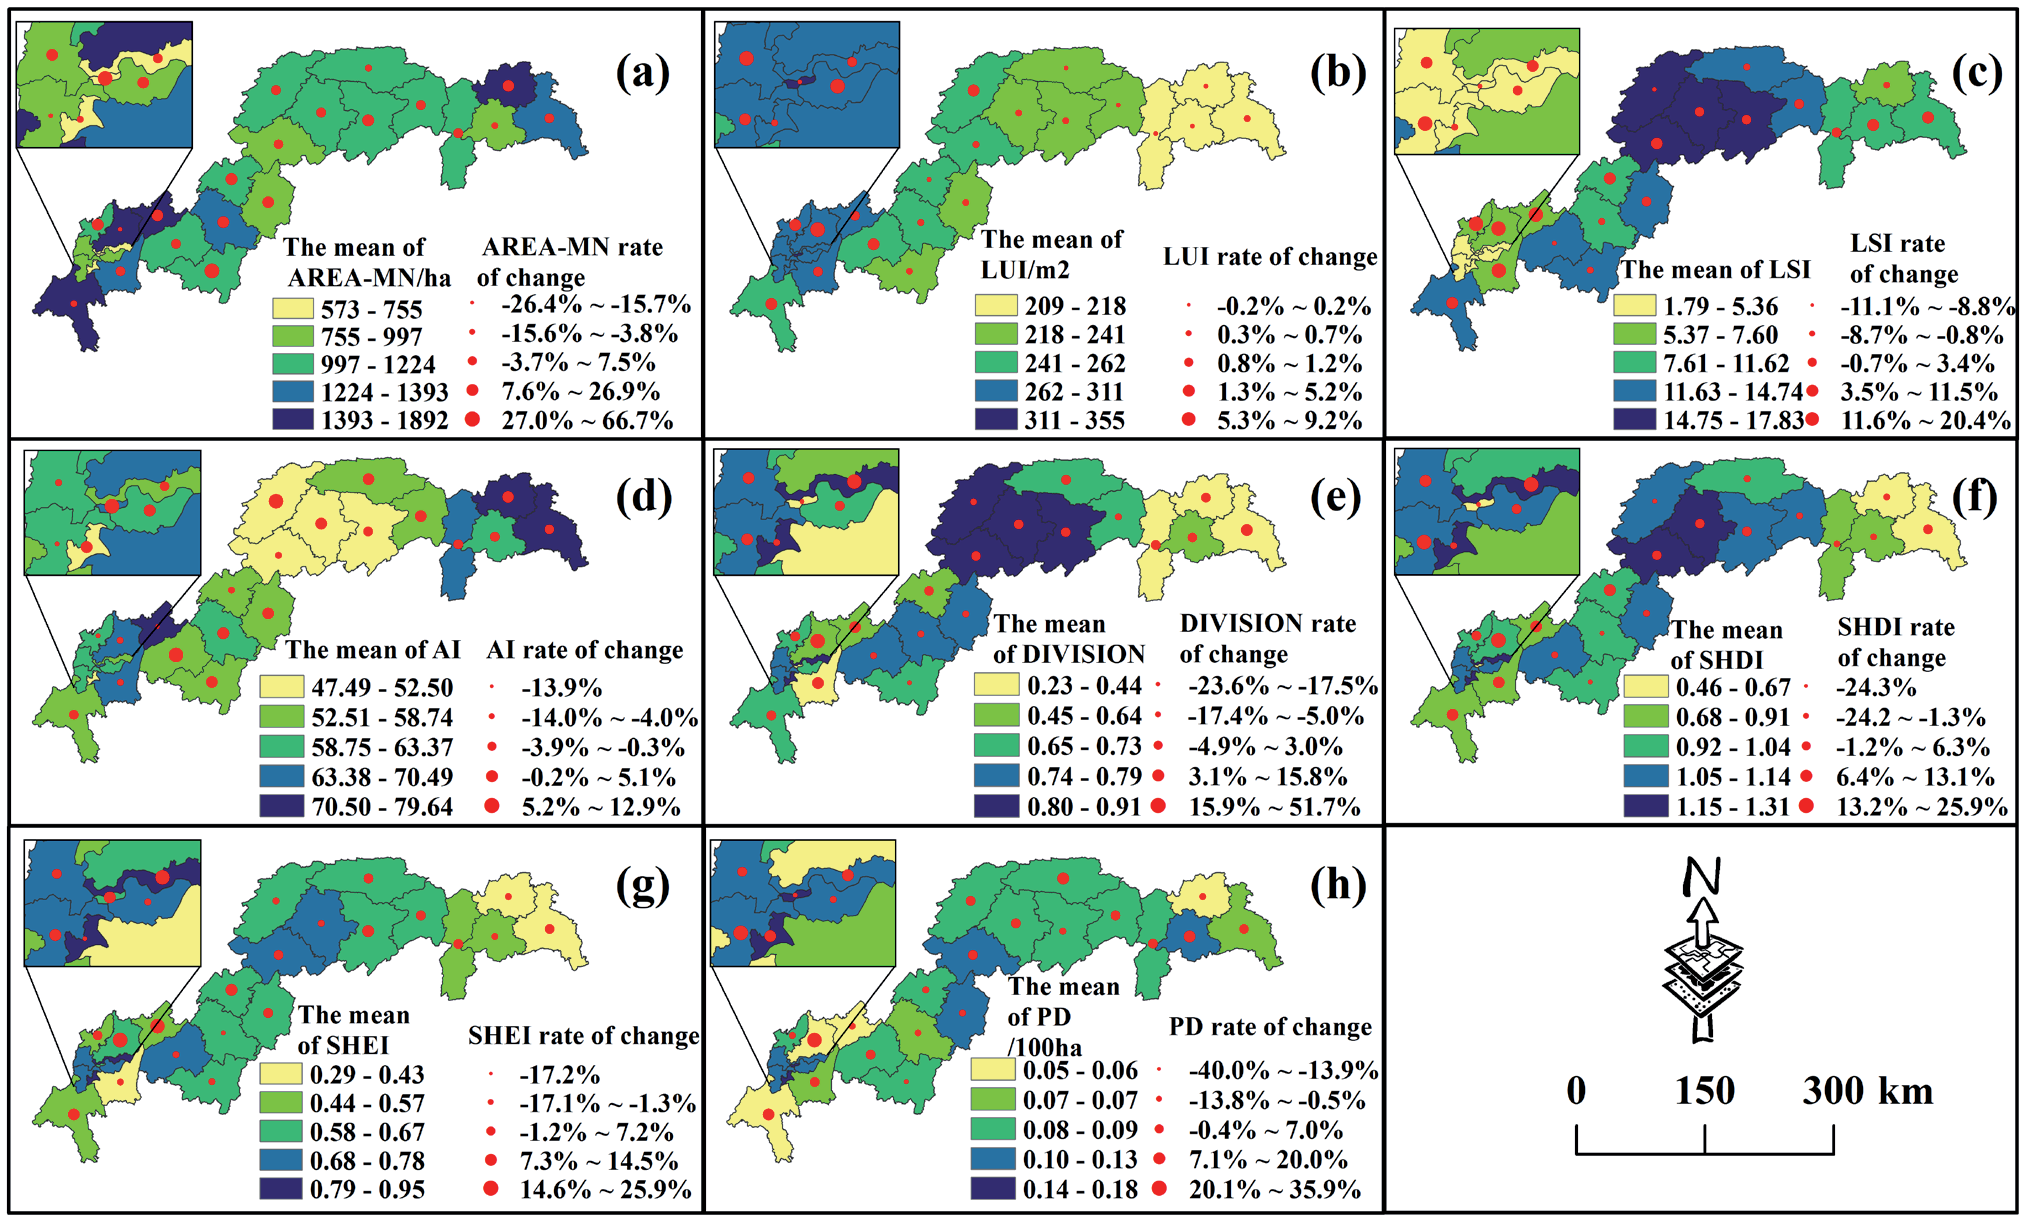
Drawing on the research ideas of landscape ecology, this study characterized land fragmentation from four aspects: scale, utilization, spatiality, and diversity (Table 1). It then selected the appropriate indicators to characterize land fragmentation at the county scale (Fig. 1). The specific idea was as follows: From the perspective of scale, AREA-MN and parcel density (PD) can reflect the complexity, heterogeneity, and fragmentation of the terrain, respectively. In terms of land use, the land use index (LUI) can reflect the land use intensification degree based on all land types. By categorizing the land use degree, the implications of human activities on the land system can be quantified [23]. Land shape index (LSI) can comprehensively and quantitatively analyze the complexity of the area and overall distribution of various types of land. From the view of spatiality, the connectivity among parcels of different land types can be represented by the aggregation index (AI). The value of AI is negatively correlated with the dispersion of the parcel. On the other hand, the landscape division index (DIVISION) is the opposite of AI. DIVISION is positively related to the discrete nature of parcels. From a diversity perspective, SHDI can reflect the diversity of the different types of parcels’ distribution, and the larger the value, the more types of parcels are distributed. The degree of uneven distribution of parcels can be represented by Shannon’s evenness index (SHEI).
Table 1.
Evaluation index system of land fragmentation.
Calculation of the Comprehensive Index of Land Fragmentation
This paper first used Fragstat4.2 software to calculate the land use vector map from 2010 to 2020. Then, eight land fragmentation indices were obtained. Second, the TOPSIS comprehensive evaluation method was used to obtain a comprehensive index of land fragmentation.
Correlation Analysis
This paper used SPSS 27.0 software to analyze the Spearman correlation between the pollution emissions of COD, TN, TP, and NH3-N and the indices of land fragmentation. A p-value of less than 0.05 indicates statistical significance.
Random Forest Model
The random forest model is a machine-learning algorithm proposed by Breiman [24]. As a natural nonlinear modeling tool, it has the advantages of rapid training speed, strong model generalization ability, high accuracy, simpler implementation, and the selection of its samples and features is characterized by randomness. In this study, the random forest model was used to measure the importance of the four pollutant-influencing factors.
Data Sources
Data sources in this study are described in Table S2. The land use data were derived from the Resource and Environment Science and Data Center, with an accuracy of 1km. Additionally, the rural production and life data were derived from the Chongqing Statistical Yearbook and the Yichang Statistical Yearbook. Some of the missing data was determined by interpolation.
The pollutant emission coefficients of different cities refer to the Manual of Accounting Methods and Coefficients for Emission Source Statistical Survey and Production and Emission Discharge issued by the Ministry of Ecology and Environment in 2021. Table S3 shows the specific coefficients.
Results
Analysis of AGNPS Results
Spatiotemporal Characteristics of AGNPS Emissions
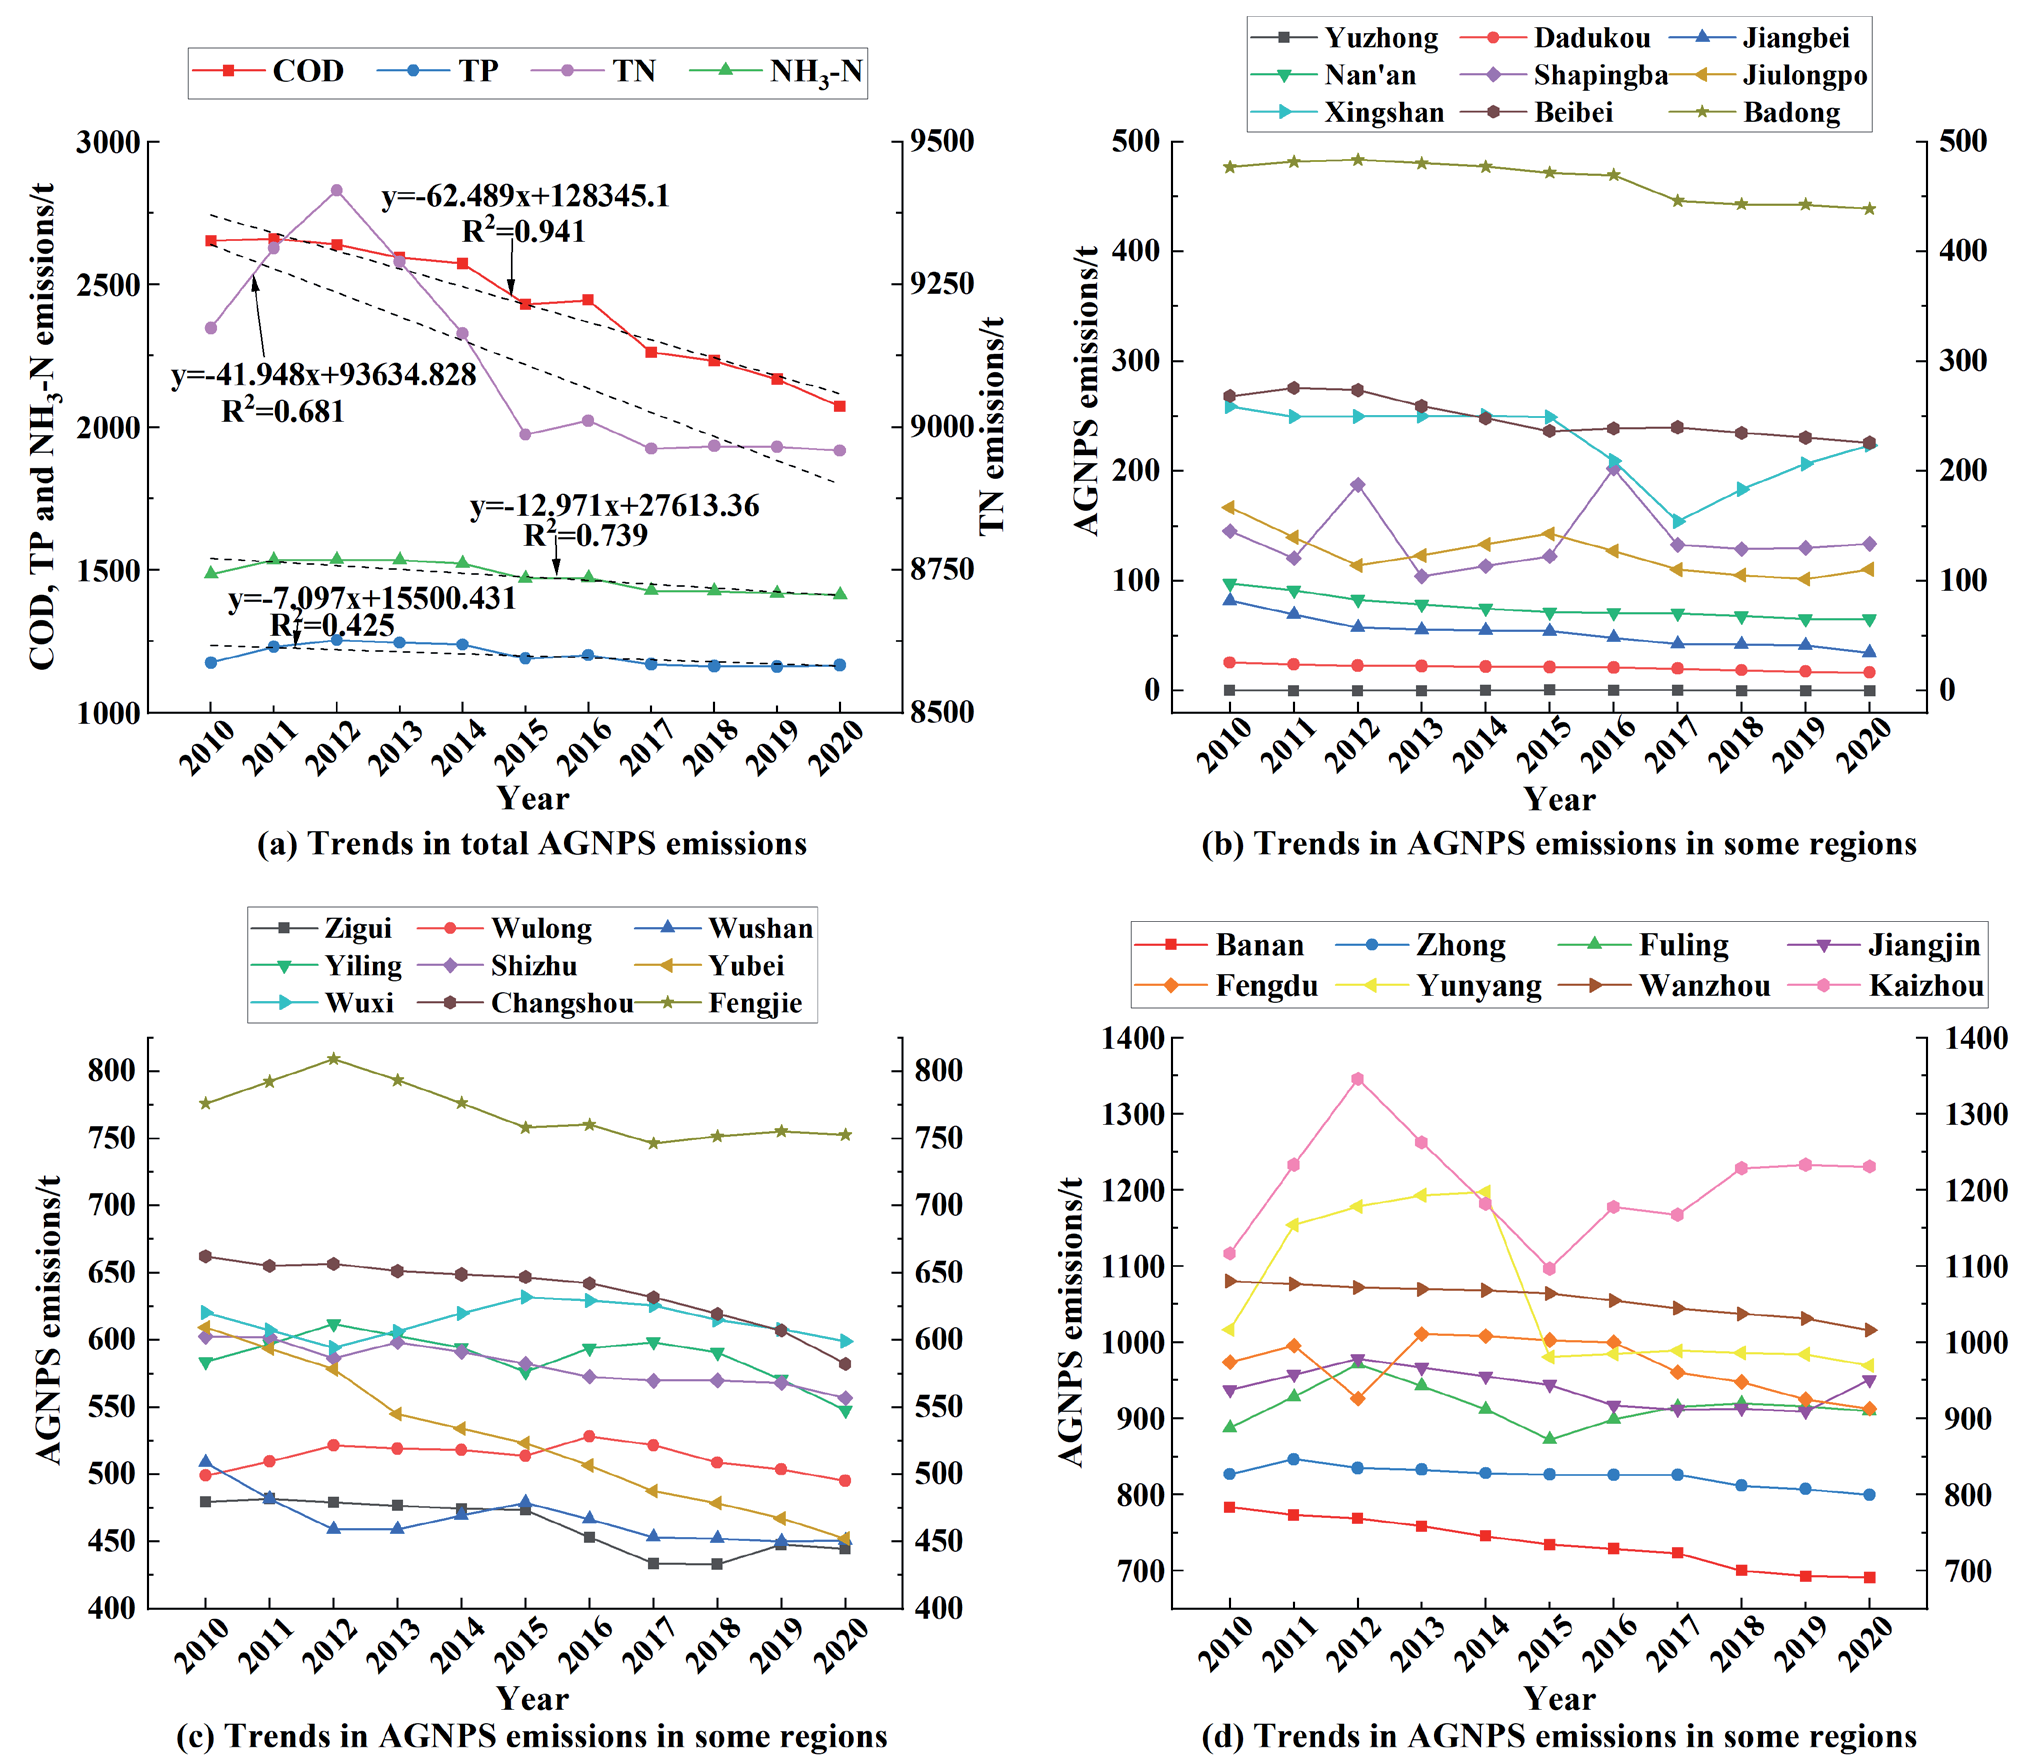
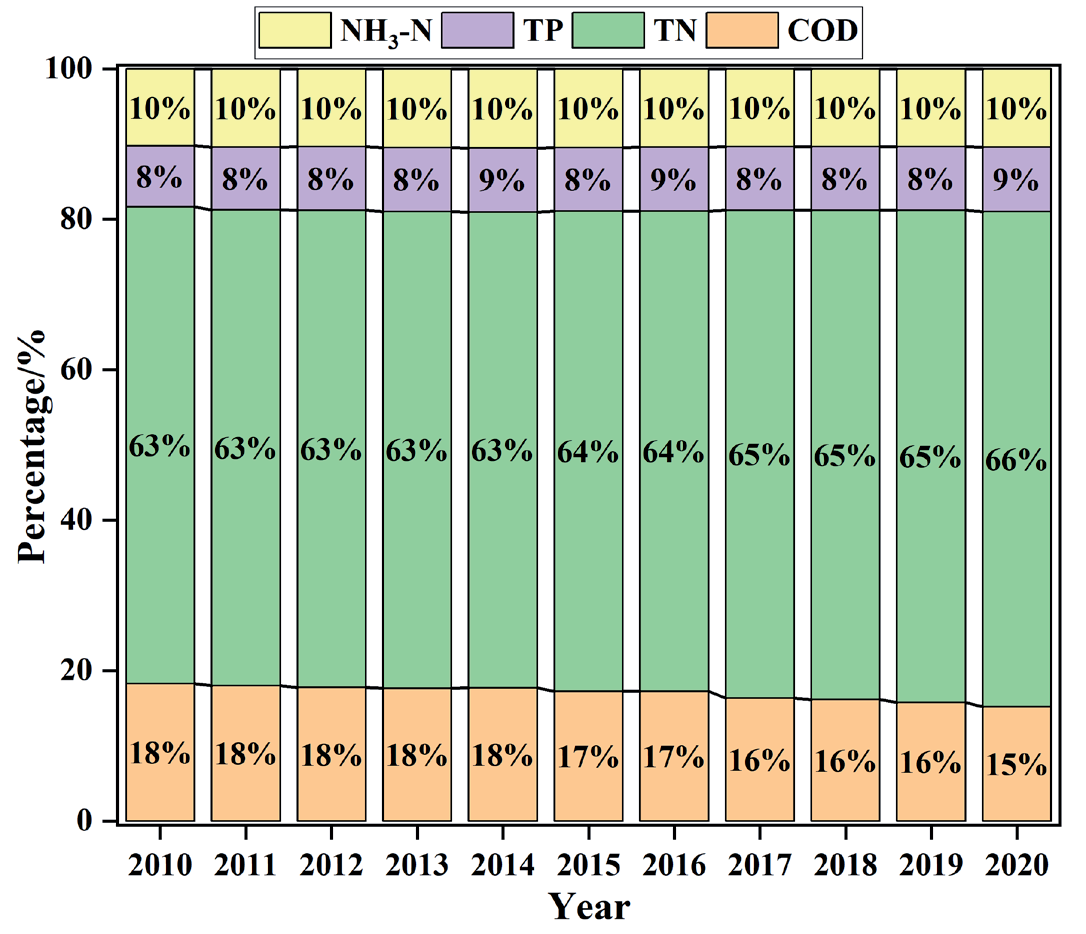
From the view of the entire area of the TGR, emissions of various pollutants from AGNPS showed a gradual downward trend (Fig. 1a). The total COD emission decreased from 2,652.84 tons to 2,073.11 tons, a decrease of 21.85%, and the slope of the fitting curve was -62.489 t/a, R2=0.941. In terms of average annual emissions and emission intensity, the value of TN: TP: COD: NH3-N was 63:8:17:10. It indicated that TN emissions were dominant and were the key prevention and control indicators in the TGR. From the view of each district and county (Fig. 1), Wanzhou District, Jiangjin District, Kaizhou District, Fengdu County, and Yunyang County had the highest AGNPS emissions. These areas had emissions of more than 900 tons. The total amount of AGNPS emissions in most areas was slowly decreasing, and the largest reduction in pollution was in the Jiangbei, Dadukou, Nan'an, and Jiulongpo districts of Chongqing, with a decrease of more than 30%.
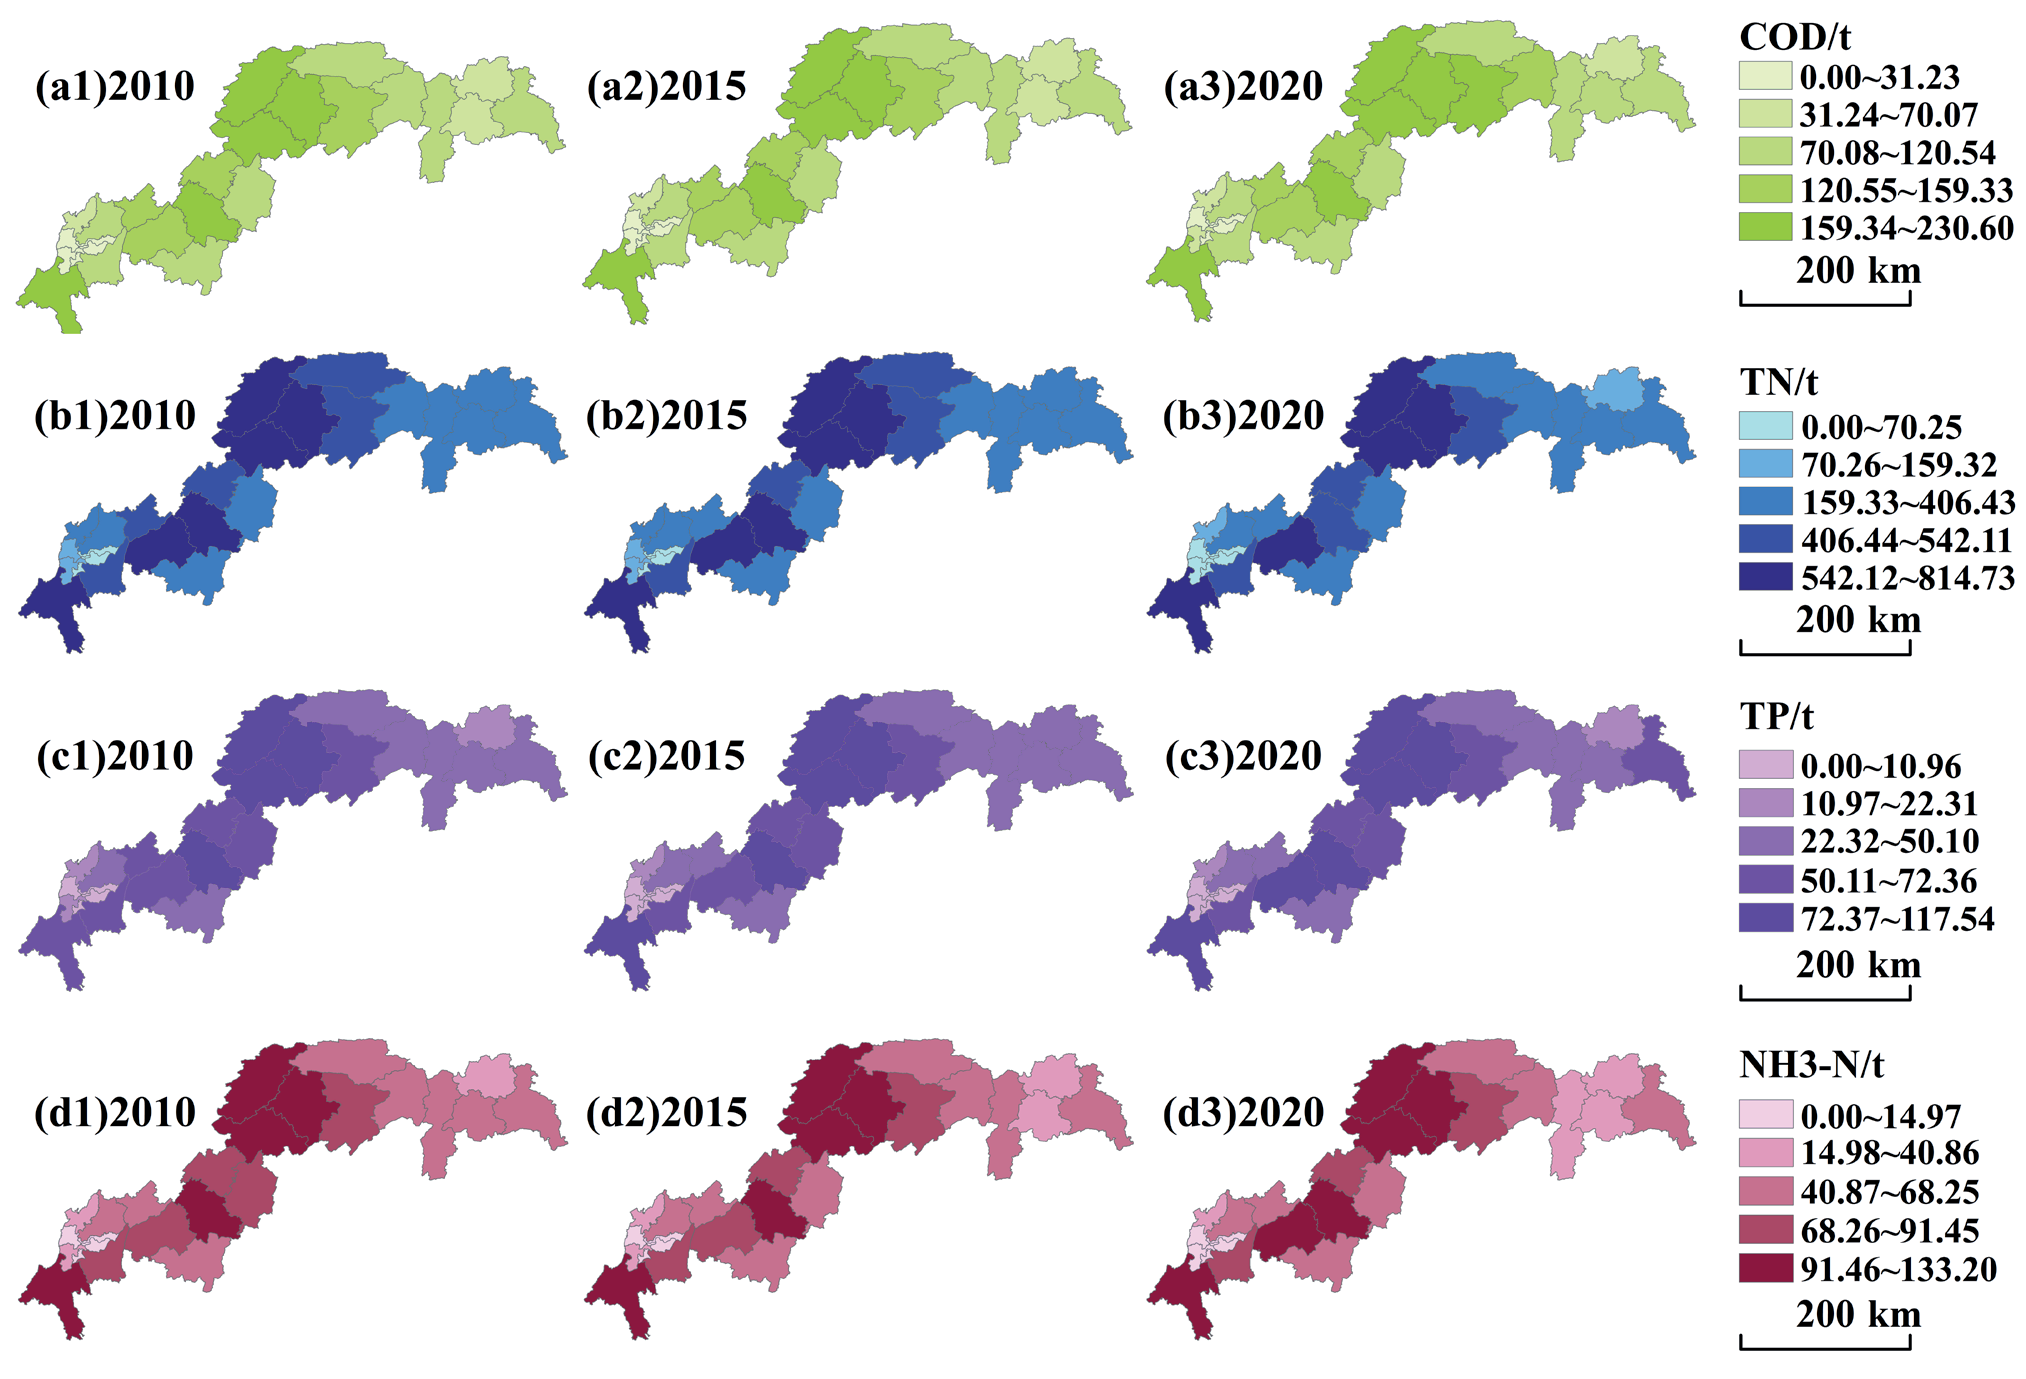
In terms of the types of AGNPS, there were obvious differences in the emissions of the four types of pollutants in different districts and counties (Fig. S2). In this paper, the years 2010, 2015, and 2020 were selected to visualize the emissions of various pollutants. The results were as follows: (1) High COD emission areas were in the middle of the TGR. These areas included Kaizhou County, Wanzhou County, and Yunyang County, with annual pollutant emissions of more than 150 t. Moreover, these areas were densely populated with villages and towns, a large rural population, and livestock farming was more developed. (2) In addition to the central part of the TGR, high TN emission areas also included Fuling District, Jiangjin County, and other central and southwestern areas of Chongqing. The pollutant emissions of these areas were more than 564 tons. The unique agricultural production conditions, such as arable plains and abundant surface water resources, were important reasons for the accumulation of TN pollutants. (3) The areas with a higher emission intensity of NH3-N and TP were similar to TN. Pollutant emissions were above 70 tons and 88 tons, respectively.
Analysis of Sources of AGNPS
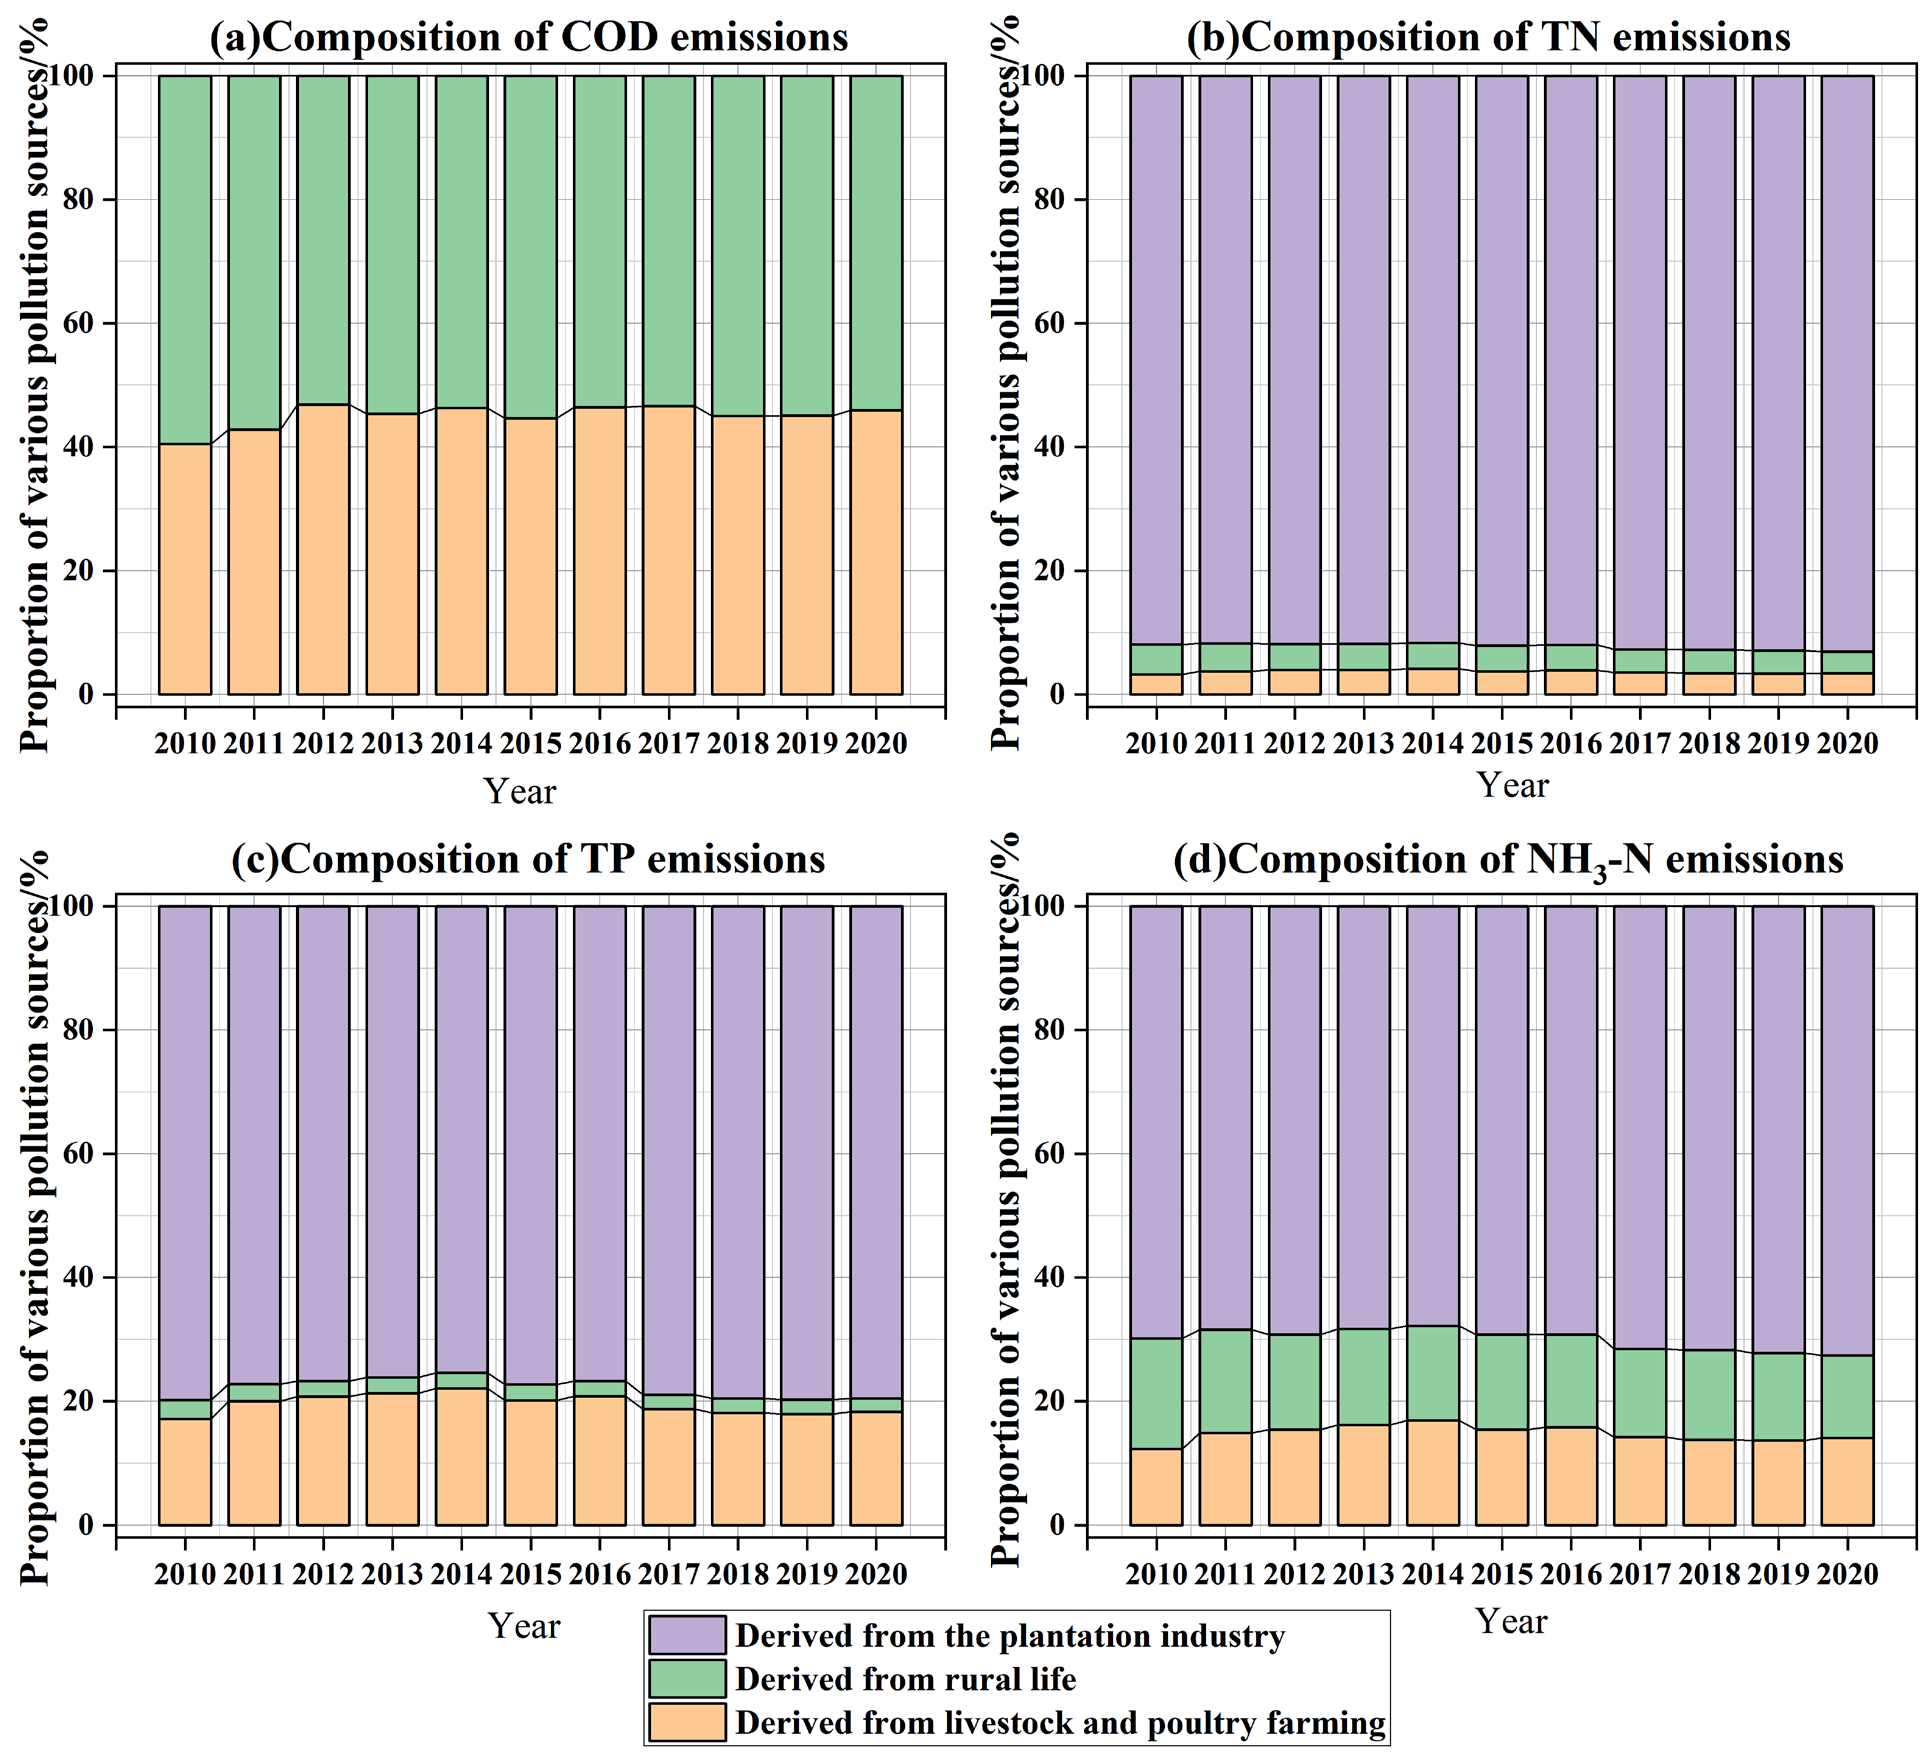
The percentage of the three sources was calculated from the results obtained from the Equivalent Pollution Load Method, as shown in Fig. 2. From 2010 to 2020, the main source of COD in the TGR was livestock and poultry breeding, that of TN was planting, that of TP was livestock and poultry farming and the planting industry, and that of NH3-N was planting. Furthermore, the percentage of emissions from rural living sources was relatively low. The main results of the three types of pollution sources were as follows:
(1) The pollution emissions generated by rural life were decreasing year by year. With rapid urbanization, the rural population had decreased from 8,287,100 to 5,886,200. Simultaneously, the standard of living had been improved, sewage treatment facilities had been improved, and garbage treatment had also tended to be rationalized. Therefore, the pollutant discharge of domestic sewage and garbage had decreased. (2) Livestock and poultry farming’s contribution to AGNPS emissions first increased and then decreased, while both phosphorus and NH3-N emissions increased and then decreased, with the inflection point in 2014. This is related to the scale and farming pattern of livestock and poultry farming. During the 12th Five-Year Plan period, Fengdu vigorously developed the beef cattle farming industry and built some new large-scale pig-raising plants in Jiangjin, Kaizhou, Yunyang, and Wanzhou. Statistically, the pig breeding mode in the study area was mainly free range, and the livestock and poultry manure treatment method was dry manure. In this process, nitrogen and phosphorus losses were serious. (3) The contribution rate of planting to pollutants increased first and then decreased. This is the same trend as the area of cultivated and orchard land, which increased before 2012 and decreased after 2012. This may be related to the promulgation of the "Action Plan for Zero Growth of Chemical Fertilizer Use by 2020" in 2015. Subsequently, research was actively carried out on orange residue fodder, fertilizer, and methane utilization techniques. In this way, the use of chemical fertilizers would be reduced.
Analysis of Land Fragmentation Results
Analysis of Land Fragmentation Comprehensive Index
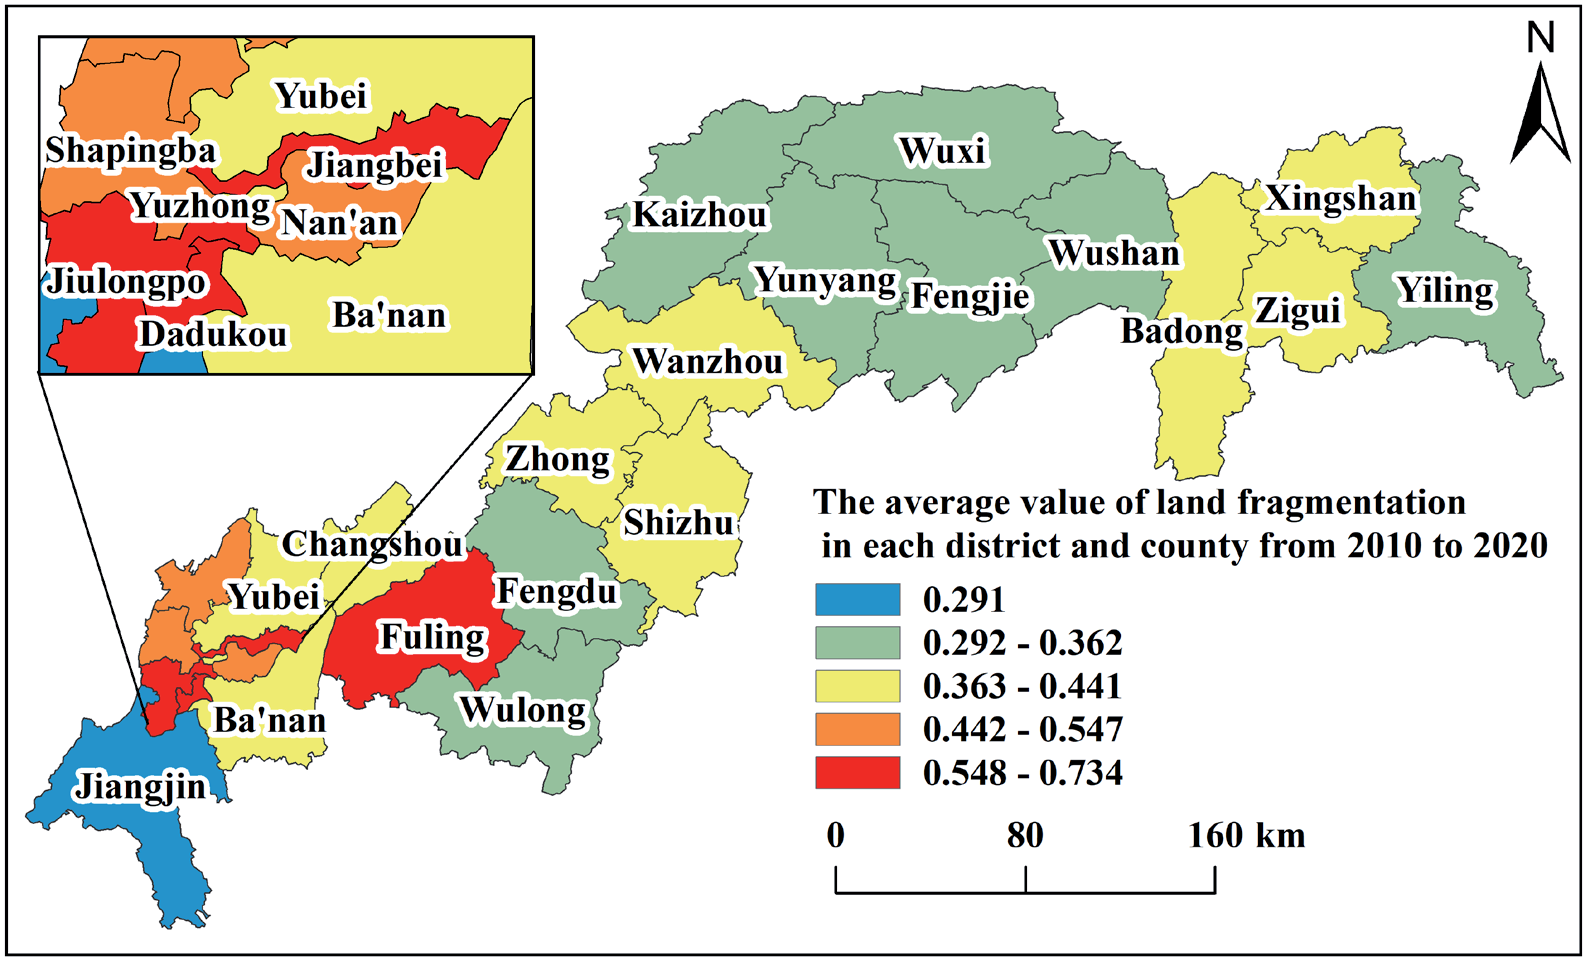
Different regions had different trends and distribution characteristics, and their fragmentation characteristics would also change with regional environmental changes. Fig. 3 shows the average land fragmentation value of each district and county in 10 years.
On the time scale, there were significant variances in land fragmentation trends in 26 districts and counties from 2010 to 2020. According to the changing trend of fragmentation in each district and county, it can be broadly categorized into the following two groups: First increase and then decrease type and first decrease and then increase type. The main types of first increase and then decrease were the Fuling, Dadukou, Jiangbei, and Shapingba districts. The topography of these districts and counties is mostly hills and valleys. The main types of first decrease and then increase were Xingshan, Fengdu, and Wuxi counties, and the topography of these districts and counties are primarily mountainous areas. High land fragmentation areas are Dadukou, Fuling, Jiangbei, and Jiulongpo districts, all of which are located in Chongqing City. Among them, Dadukou District had the largest change range, with an increase of 48.86% in 10 years. On a spatial scale, there is a negative relationship between the degree of fragmentation and topography. The average land fragmentation of each district and county in the past 10 years was higher in the Fuling, Jiulongpo, Dadukou, Nan'an, Shapingba, and Beibei districts. These areas had low topography and were dominated by hills and valleys. The districts and counties with low mean fragmentation were mainly Wulong District, Fengdu, Wushan, and Wuxi Counties. These areas are mainly located near the Daba, Wushan, and Wuling mountains.
Analysis of Land Fragmentation Index
The spatial distribution of the 10-year mean values of eight land fragmentation indicators is shown in Fig. S3, as can be seen: (1) In areas with low PD, the AREA-MN and LSI were usually larger. The areas with small PD, AREA-MN, and LSI were mainly distributed in cultivated land and higher-altitude woodland. The area with higher PD was the interlaced area of different land types. The AREA-MN in these areas was usually smaller, the LSI was lower, and the degree of fragmentation was higher. (2) In areas with large AI, the SHDI, SHEI, and DIVISION were usually smaller. Land fragmentation increases as land use richness increases, and if the uncertainty information content is high, then the SHDI, SHEI, and DIVISION values are high, and the AI value is low. (3) The high LUI areas were mainly concentrated around the main urban area of Chongqing. With the increase in urbanization, construction land in Chongqing has expanded, and land development and utilization degrees have increased in the past 10 years.
Due to the overlap of the indicators, only four indices were selected to analyze the change rate of LSI, AI, SHDI, and PD. There were differences in the spatial features of four types of indicators: (1) From 2010 to 2020, the LSI of several main urban areas of Chongqing increased significantly. This indicated that, under the interference of human activities, the complexity of parcel shapes in this region further increased. (2) AI values were reduced in 61.5% of the region. Among them, the main reason for the large rate of decline in several districts and counties is that land for construction has begun to expand, replacing former cropland and forest land. This shows that there was a steady decline in the physical connections between land parcels. This, in turn, had led to the fragmentation of the parcels. (3) The SHDI of 57.7% and the PD of 69.2% of this area were increased, respectively. This showed that the construction of water projects can have some impact on the TGR. Then, land use patterns changed significantly, the parcels were fragmented, and landscape diversity increased. The complexity of the overall landscape shape increased with the intensification of human activities, such as increased agricultural land use and increased investment in the landscape industry. The parcels were more finely segmented, and the degree of fragmentation increased.
Analysis of the Relationship between AGNPS and LF
As can be seen in Table 2: (1) AI is positively correlated with the four pollutants of AGNPS. This indicates that as land parcels become more aggregated, an increase in pollution is generated. (2) DIVISION and SHDI are significantly negatively correlated with the four pollutants of AGNPS with a significance p-value of < 0.05. This indicates that both the land parcel number and the parcel delineation fineness are related to the generation of pollution. When land fragmentation is high, it is difficult to produce numerous AGNPS. (3) LUI is significantly negatively related to pollutants. This suggests that human reclamation of land will curb the generation of pollution. (4) The spatial characteristics, diversity, and the degree of utilization of land parcels tend to have a strong relationship with the formation of AGNPS.
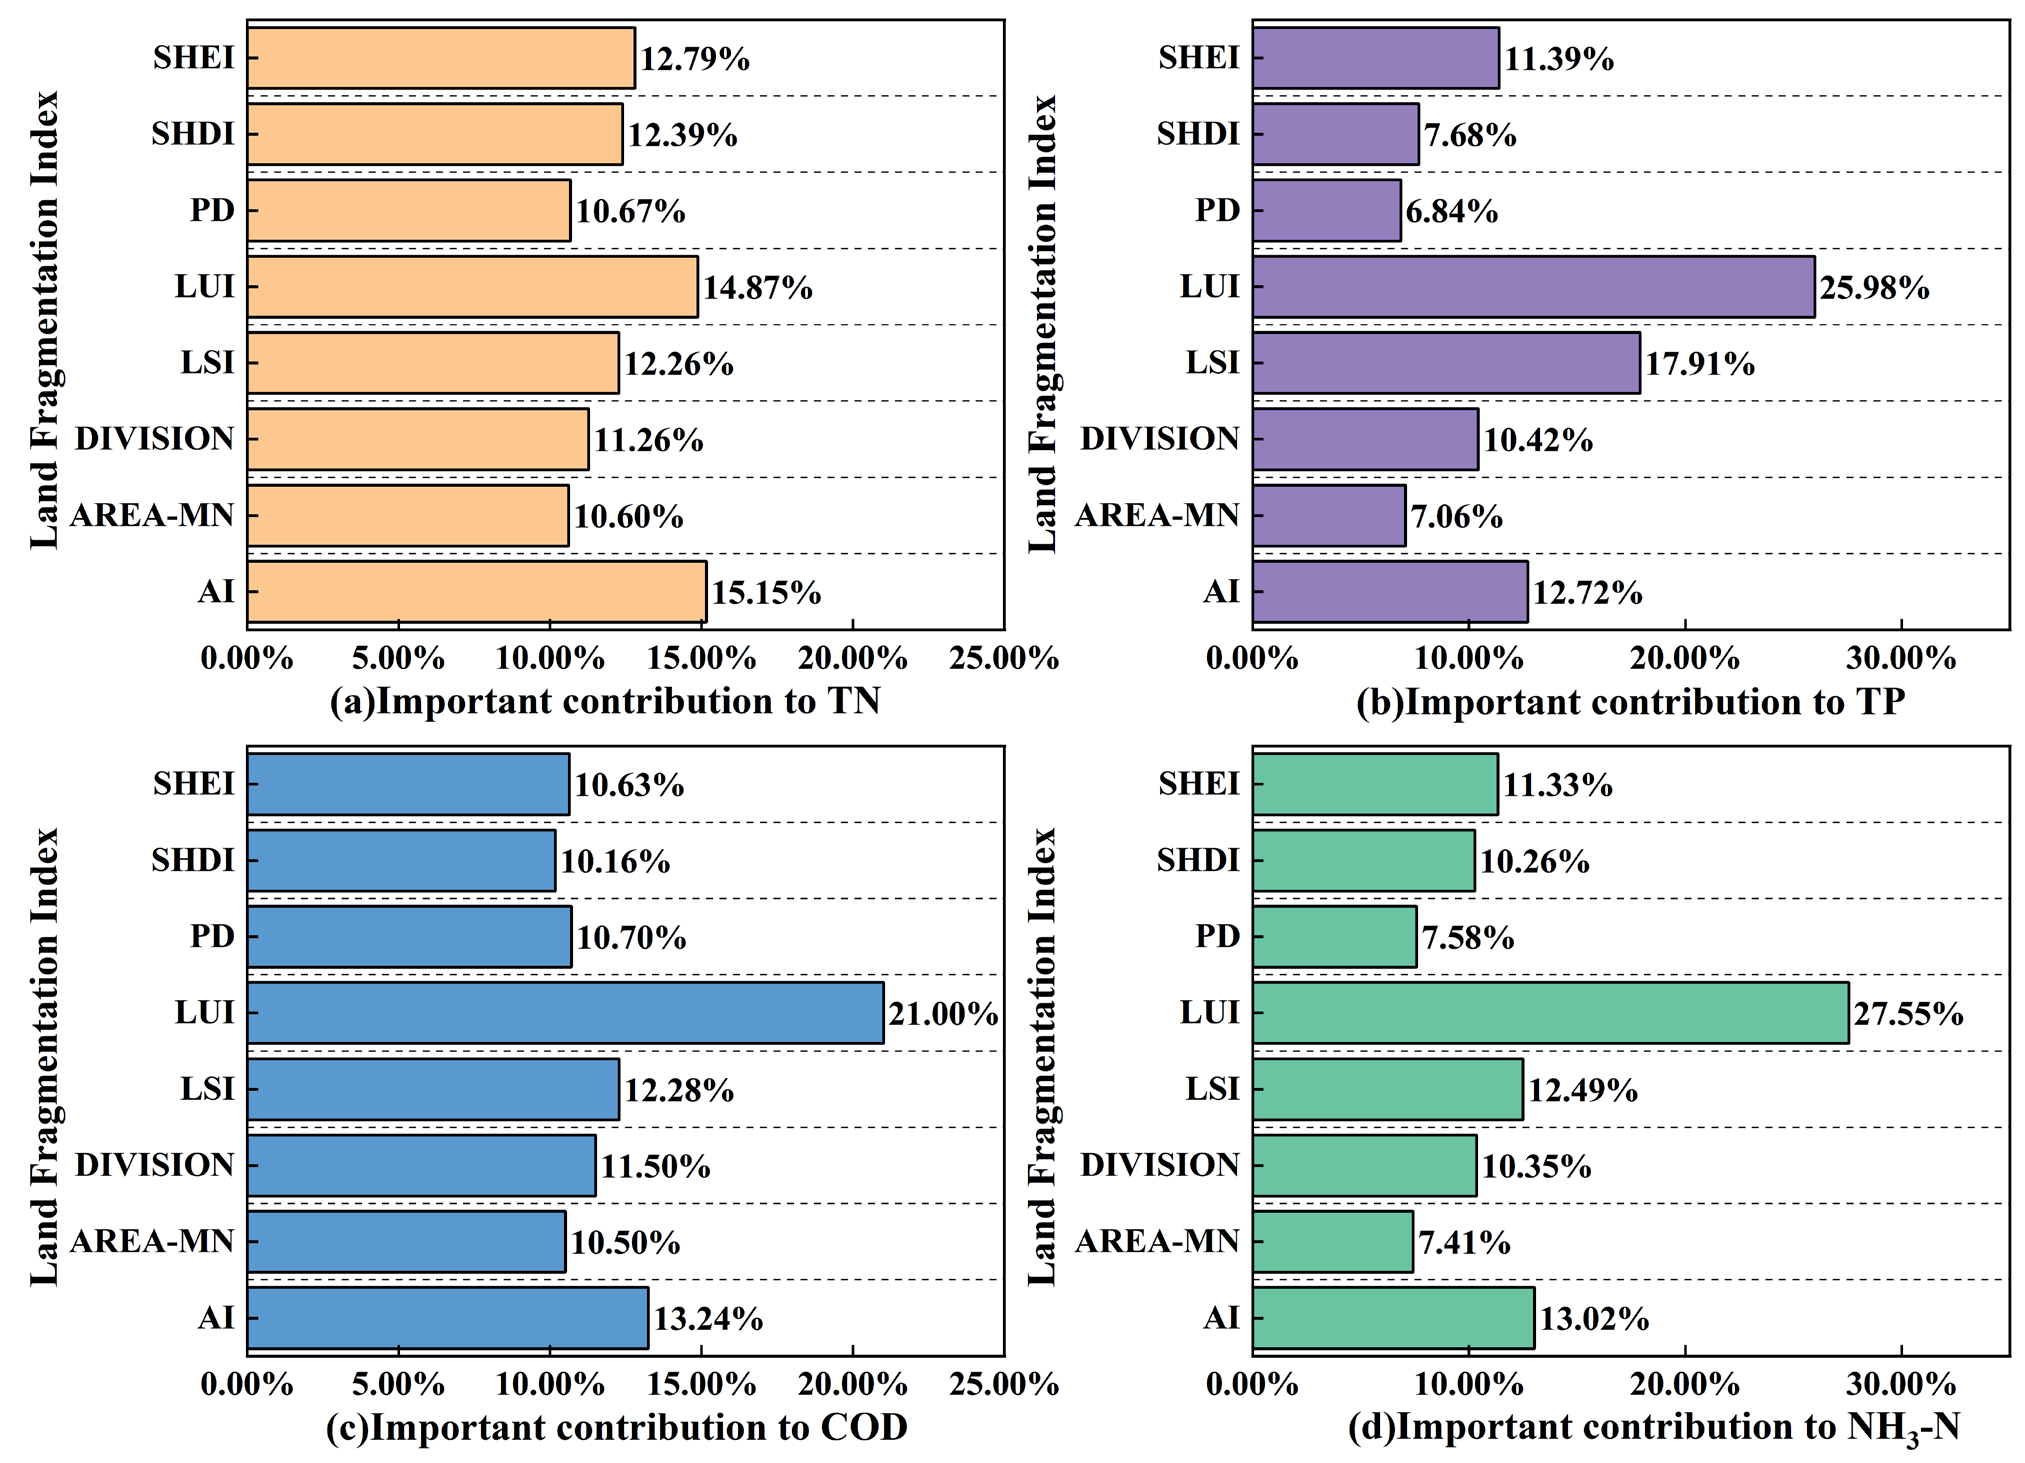
As seen above, there is an influential relationship between agricultural surface pollution and land fragmentation. Therefore, this study used the random forest model to rank the importance of the impact factors relating to the four pollutants. The results are shown in Fig. 4.
It can be seen in Fig. 4 that: (1) The importance of each factor to nitrogen emissions varies little, and the proportion is between 10% and 16%. Among them, the importance of AI is 15.15%, which ranks first. (2) Phosphorus emissions are mainly influenced by LUI, LSI, AI, and SHEI, and the combined importance of these four factors is 68%. Among them, LUI has the greatest influence on phosphorus emissions, indicating that the utilization and spatial characteristics of land parcels will have an influence on phosphorus emissions.
(3) In the ranking of factors on COD, LUI ranks first, accounting for 21%, and the gap between the rest of the factors is smaller. This suggests that the utilization of land parcels is associated with COD emissions. (4) The emissions of NH3-N were mainly influenced by LUI, AI, LSI, and SHEI. This indicates that both the spatial characteristics and utilization of land parcels have an impact on NH3-N emissions.
Discussion and Policy Suggestions
Discussion
Some scholars considered that AGNPS focused mainly on nutrients such as nitrogen and phosphorus [10, 11]. It has also been shown that ammonia nitrogen leads to the eutrophication of water quality [15]. Additionally, COD is an important indicator for evaluating the water environment [16]. However, existing studies only focused on TN and TP pollution, ignoring the harmful effects of COD and NH3-N on the water environment. In this study, emissions of the four pollutants were comprehensively measured. The results showed that COD accounted for more than 15%, and the percentage of NH3-N was maintained at 10% (Fig. 5). This indicates that in addition to TN and TP, which are two common pollutants in the study, COD and NH3-N have a non-negligible impact on the water environment. It is important to have a comprehensive understanding of AGNPS, as this has research value. Some studies have found that AGNPS mainly originated from the plantation industry and livestock farming [7, 8], and these two industries are the main sources of AGNPS. However, studies have shown that pollution originating from rural life was also high [25]. Therefore, this paper measures three aspects to explore the sources of AGNPS fully. The results showed that among the sources of COD, pollution generated from rural livelihoods accounted for up to 50%, while the share of NH3-N was higher than 15% (Fig. 2). This indicates that the impact of rural life on pollution cannot be ignored in terms of the source of pollution. Garbage and sewage discharged in daily life can cause numerous pollutants to enter the water environment as a result of runoff washout [26]. The improvement of farmers' environmental awareness is important for AGNPS [27]. Therefore, the government can help enhance farmers' environmental awareness to convey the hazards of AGNPS to the public and increase attention to water resource protection. Clarifying the types and sources of pollutants is important for the subsequent determination of pollution prevention and control objectives.
Table 2.
Spearman correlation coefficient.
Fig. 4.
Importance ranking of impact factors of pollutants. (a) Important contribution to TN; (b) Important contribution to TP; (c) Important contribution to COD; (d) Important contribution to NH3-N.
(1) Land fragmentation is a major constraint on the efficiency of land resource utilization in China [28], which can affect agricultural sustainable development. For the study of fragmentation, most of the existing literature focused on measuring the degree of fragmentation of a single land type [29-31]. Such studies did not take into account the association between various types of land parcels, thus ignoring the fragmentation between parcels due to interactions. In contrast, this paper examined fragmentation at the land level as a whole, which allowed for a comprehensive consideration of the interactions between land parcels. It was also possible to realize the level, form, manifestations, and causes of land fragmentation and all its effects at different spatial scales. (2) Land use type affects water quality through altering surface runoff and water circulation [32]. Agricultural and constructed land use exacerbated water quality degradation, while forests, grasslands, and watersheds had a positive effect on water quality [33]. However, land type is a delineation of land use. It does not reflect the impacts on water quality that result from the scale and spatiality of subdividing parcels at the micro level. In contrast, landscape patterns can reflect quantitative land use changes and spatial structural configuration characteristics on a finer scale [34]. Therefore, this paper constructed a land fragmentation evaluation index system based on the aspects of scale, availability, spatiality, and diversity. This index system can evaluate the degree of land fragmentation from multiple perspectives. (3) The results of the study show that the aggregation index (AI) is obviously positively correlated with pollution. This indicates that the spatial characteristics of land parcels are closely related to the formation of AGNPS. Compared with a single land type, the land fragmentation index can more clearly reflect characteristics such as the spatiality and diversity of land parcels. Furthermore, compared with the single landscape pattern index, it can reveal the degree of human interference with the land, providing a theoretical basis for land management. Clarifying the relationship between land fragmentation characteristics and AGNPS can provide a reference for the formation of a land resource utilization pattern that is compatible with the pollution background and beneficial to sustainable agricultural development.
Policy and Suggestions
The "14th Five-Year Plan" is a period of in-depth promotion of AGNPS prevention and control. To continuously improve the control capacity of AGNPS, the following suggestions are proposed:
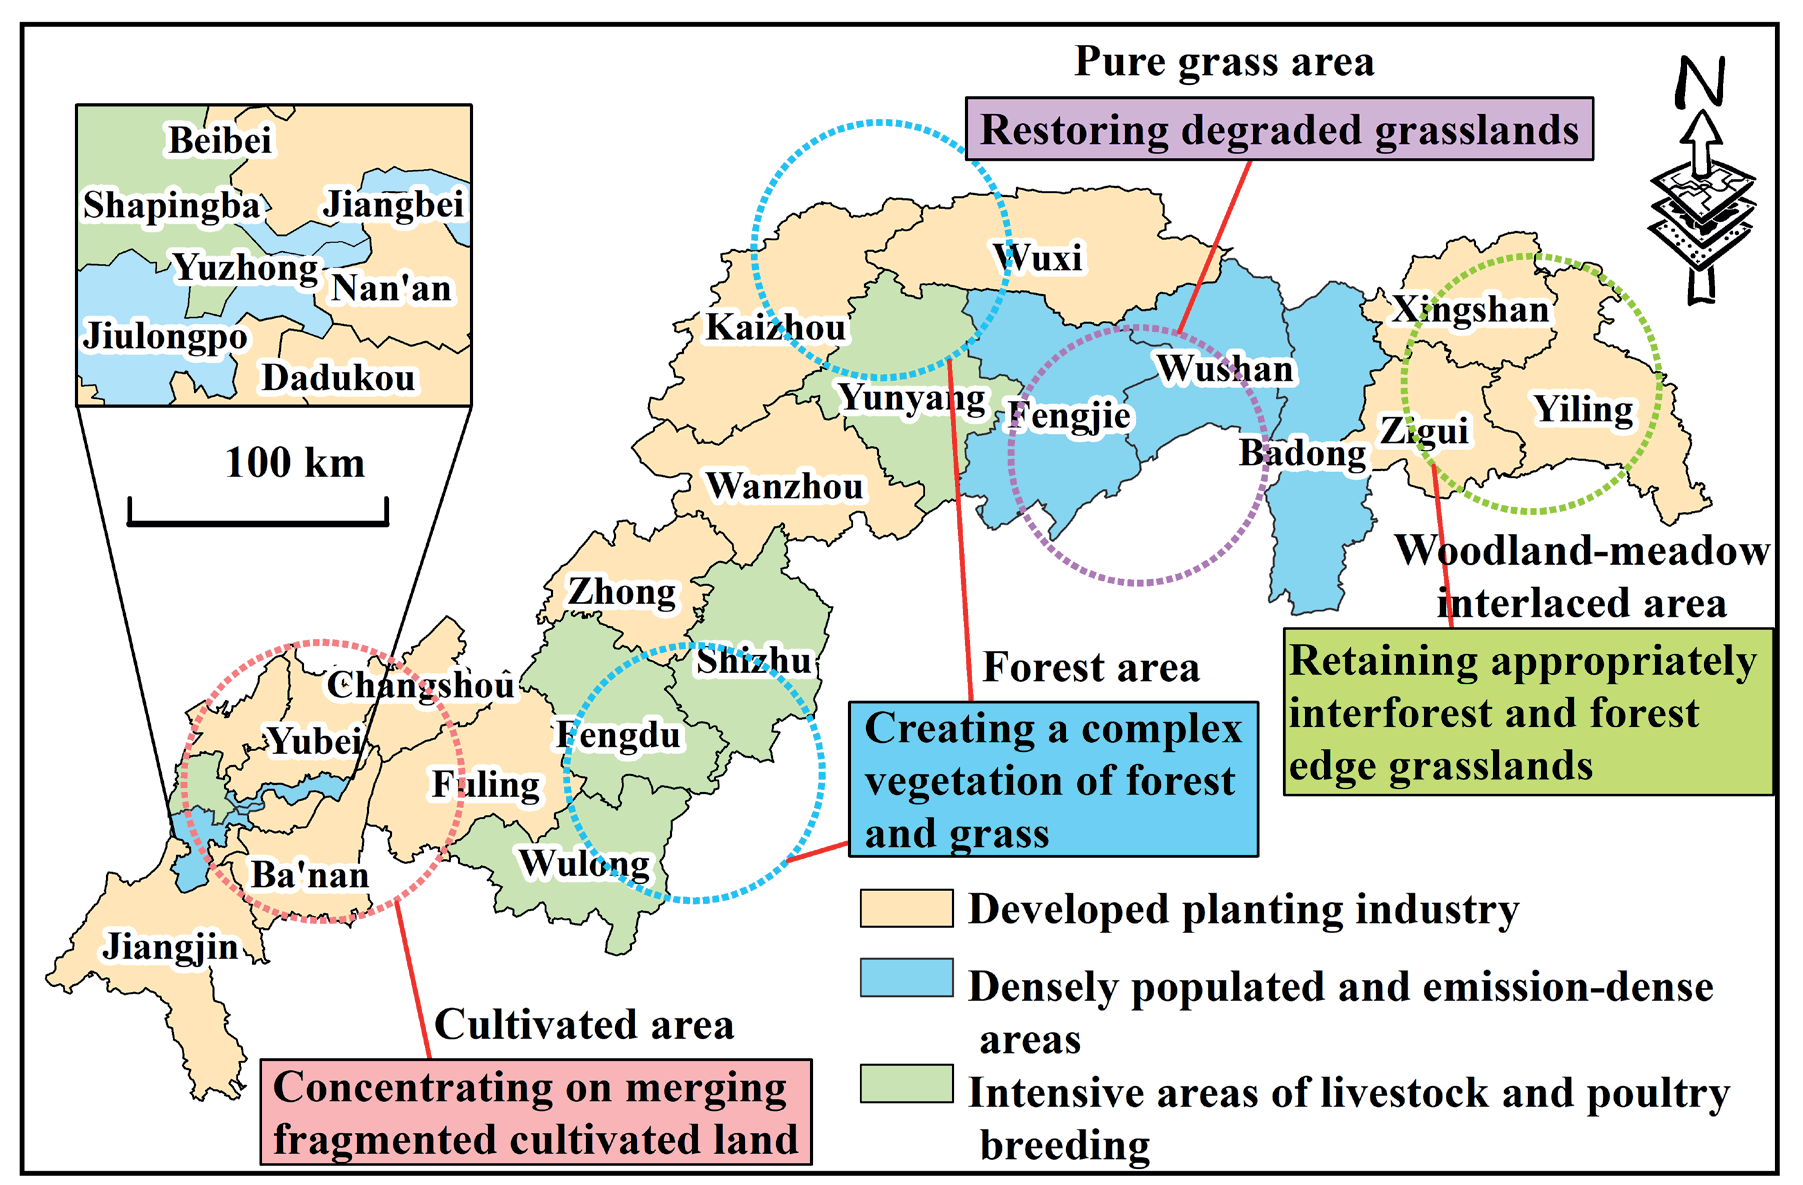
(1) All districts and counties should focus on the impact of planting and breeding on AGNPS. According to the three types of pollution sources’ proportions, this paper is divided into planting pollution area, livestock and poultry breeding pollution area, and rural life pollution area (as shown in Fig. 6). The polluted areas of livestock and poultry breeding and rural life are important prevention and control source areas of COD, and planting pollution areas are the key prevention and control source areas of TN, TP, and NH3-N. In terms of stockbreeding, Wulong District and Fengdu County should adhere to the development of standardized large-scale breeding. This measure can accelerate the improvement of facilities and equipment to ensure conditions and promote the sustainable development of animal husbandry. In terms of the planting industry, Beibei, Nan'an, and Dadukou districts and counties should appropriately adjust the planting structure, promote precision fertilization according to local conditions, and increase the utilization rate of chemical fertilizer.
(2) Maintain and strengthen the continuity of the overall land pattern of the region by adjusting land structure and layout. In cultivated land areas, centralized consolidation in fragmented cultivated land should be implemented, and the layout of cultivated land should be rationally planned. Moreover, the contiguity of cultivated land should be improved to increase the efficiency of cultivated land use. In pure grassland areas, measures such as ecological restoration, loosening soil fertilization, and rodent and insect pest control should be implemented to increase the production and ecological functions of grasslands. In the woodland-meadow interlaced area, creating forest-grass composite vegetation and avoiding overemphasizing concentrated contiguous and high-density afforestation will be more beneficial to preserving the grass space as much as possible. In the forest area, the forest and the grassland at the edge of the forest should be appropriately retained, and a composite ecosystem with woodland and grassland mosaic distribution should be formed.
(3) Due to the low degree of land fragmentation of forest land and grassland, it can be implemented in areas with serious pollution (such as Jiangjin District, Zhong County, and Changshou District) to return farmland to forest and grassland. Simultaneously, the government cannot ignore the importance of intensive agricultural management in the AGNPS process. The government should strengthen policy support for the construction of land infrastructure such as roads and water conservation irrigation. Efforts should be made to centralize the management of scattered land, reduce the constraints brought about by land fragmentation, and enhance the positive role of intensive agricultural management in reducing AGNPS.
Conclusions
This paper calculated the emissions of AGNPS and the degree of land fragmentation in the TGR. Then, the relationship between AGNPS and land fragmentation was more deeply explored using Spearman correlation analysis and random forest models. The study results showed that: First, this paper analyzed pollution sources and pollutant types comprehensively. The TGR hinterland was the high-value area of AGNPS production. The cultivation industry produced more than 60% of TN, TP, and NH3-N. COD showed the largest decrease of 21.85% in terms of types of pollutants. Second, this study proposed an indicator system to measure land fragmentation. In the TGR, areas with relatively high land fragmentation values (greater than 0.442) had agglomeration and were largely concentrated in the Chongqing central urban area. Finally, we explored the relationship and impact intensity of land fragmentation on AGNPS. The land use index (LUI) was negatively correlated with pollutants, while the aggregation index (AI) was positively correlated. Among the contributions to COD, the share of LUI was 21%, and AI was 13.24%. AGNPS was studied from the land fragmentation view, which can provide a reference for forming land resource utilization patterns that were beneficial to sustainable agricultural development.
The inventory analysis method and equivalent pollution load method were used in this paper to measure AGNPS emissions. These two methods are applicable to studying the pollution emissions from the agricultural sector at the national, provincial, municipal, district, and county levels. For the exploration of the relationship and impact intensity of land fragmentation on AGNPS, this paper used the Spearman correlation analysis and random forest models. These research methods can also be used for similar research questions in other regions.
However, this study still has limitations. Since this paper is a preliminary attempt to quantify land fragmentation, the index calculated is a comprehensive index for all land use types. Future research can distinguish individual land use types and combine research scales for land fragmentation studies.