

Introduction
Soil organic carbon (SOC) sequestration plays a key role in the global carbon cycle. Soil is the largest terrestrial carbon pool, containing approximately 2500 Pg of carbon, significantly more than the atmospheric carbon pool of about 760 Pg [1]. Increasing SOC stocks through practices such as improved land management can help sequester carbon dioxide (CO2) from the atmosphere, thus mitigating climate change [2]. Healthy soils contribute to productivity, biodiversity, and water retention and are vital for food security and resilience to climate impacts [3].
Appropriate soil management practices can reduce carbon emissions from soils by up to 50% by 2050 compared to 2010 levels [1]. Despite the potential, implementing effective SOC management strategies can be challenging. These include the need for long-term commitment to soil management, the vulnerability of certain soils to carbon loss, and the complexity of SOC dynamics influenced by climate [4].
The Himalayan mountainous ecosystems are classified as a biodiversity hotspot, with varying climatic and topographical conditions [5]. The climatic diversity in this region results from its complex geography and altitude, which influence climate and habitat types. The diverse plant communities in the Himalayas contribute significantly to SOC stocks through photosynthesis and organic matter inputs to the soil [6]. Soils in these ecosystems can store substantial amounts of carbon to mitigate climate change by reducing atmospheric CO2 levels [7].
Climate change poses threats to the Himalayan ecosystems, potentially reducing soil health and SOC storage capacity. Increased temperatures and altered precipitation patterns can affect the delicate balance of these ecosystems, making sustainable management practices essential to protect and enhance SOC stocks [3, 5]. Soil erosion significantly contributes to SOC loss, adversely affecting soil health and intensifying climate change. Erosion, primarily caused by water, wind, and tillage, removes topsoil and depletes soil organic matter (SOM), which is essential for carbon storage [8].
To mitigate the effects of soil degradation, implementing conservation practices such as no-till farming, cover cropping, and maintaining vegetation can help minimize SOC loss, enhance soil structure, and improve the capacity to sequester carbon, promoting healthier ecosystems [7]. Studies on SOC variability in the Himalayan mountainous ecosystems tend to generalize findings across large areas, neglecting the specific impact of types and physicochemical attributes of soil along with altitude [9]. Additionally, there is a reliance on traditional statistical methods that may not fully capture the complexity of interactions between environmental variables and a lack of comprehensive data on the influence of soil disturbances on changes in SOC [10, 11].
The complexity of SOC dynamics in mountainous regions necessitates the use of robust and multifaceted methodological approaches, as traditional linear regression models, while useful, often fail to capture the complex and non-linear relationships between SOC and its environmental drivers [12, 13]. Therefore, advanced statistical modeling techniques are essential to accurately analyze the complex interactions between altitudinal variations and soil physicochemical attributes. These models improve our understanding of how different factors influence SOC, leading to better predictions and more effective soil management strategies [14].
This research uses multivariate regression and advanced statistical methods to model SOC dynamics in a representative Himalayan mountainous ecosystem, integrating physicochemical variables and altitude to comprehensively understand SOC variation. It also identified key soil properties that impact SOC and investigated potential non-linear interactions between SOC and other variables. These findings are crucial for predicting SOC responses to environmental and land-use alterations, especially pertinent in climate-sensitive mountainous ecosystems.
Materials and Methods
Study Area
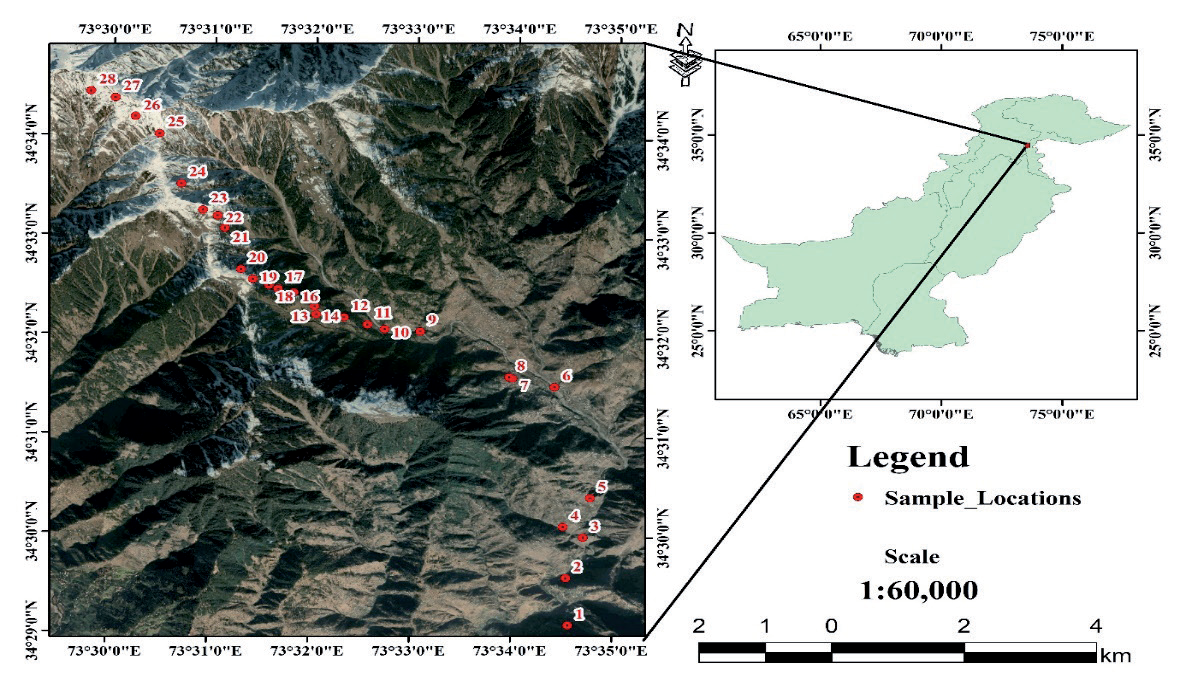
The present study was conducted in the Makra mountainous region, located at 34° 34.461’ N and 73° 29.749’ E, with an altitudinal range from 1100 to 3860 m above sea level. The study area is situated in the Muzaffarabad district of Azad Jammu and Kashmir (AJK) (Fig. 1). This Himalayan mountainous ecosystem features a varied climate across different altitudes. At lower elevations (1000-2500 m), the climate is subtropical to temperate with mild summers and chilly winters, supporting subtropical and temperate forests. Mid-altitudes (2500-3500 m) experience cooler temperatures and increased snowfall, leading to subalpine meadows and scattered coniferous trees. The climate is alpine at high altitudes (above 3500 m) with year-round cold temperatures and minimal vegetation adapted to extreme conditions [15, 16].
The region experiences an average annual rainfall of 1457 mm, with an average temperature of 20.2°C. The maximum temperature recorded is 45°C in the lower altitudes, while the minimum drops below 0°C, leading to snowfall in the mountains [17]. The region exhibits a variety of soil types, ranging from deep alluvial soils in valleys to thin, rocky soils at higher altitudes. The habitat heterogeneity and climatic variations support a wide range of plant species (from subtropical forests to alpine meadows). These variations also influence the capacity of soils to sequester carbon [18].
Data Collection
Sampling was conducted along an altitudinal gradient from 1160 m to 3860 m (Fig. 1). The sampling points’ altitude, latitude, and longitude were measured using a GPS device. Soil samples were collected using a 1×1 m quadrat at 100 m altitude intervals. A metallic core sampler was used to obtain soil samples. Five samples (0-30 cm depth) representing different slope classes were collected from each quadrat. Additionally, 5 more samples were randomly taken from nearby disturbed and eroded areas, resulting in a total of 10 samples per sampling site. In total, 280 soil samples were extracted from the field (28 sampling sites × 10 samples per site). The soil samples from each quadrat were thoroughly mixed to create a homogeneous sample, which was stored in plastic zipper bags. These samples were then brought to the Plant Ecology and Environmental Science Laboratory of the Department of Botany, the University of Azad Jammu and Kashmir, for physicochemical analysis and SOC stock assessment.
Determination of Soil Physicochemical Properties
Soil samples were crumbled and mixed thoroughly after being left open for 24 hours. A 20 mg portion of soil was weighed, and 100 ml of distilled water was added. The mixture was shaken for 2 minutes and left to settle for 5 minutes. Soil pH and Electroconductivity (EC) were measured using a pH/EC meter. The electrode was dipped 1-2 cm into the sample solution, and the pH value was recorded. Soil texture was evaluated using a jar test to determine the percentages of sand, silt, and clay. The soil textural triangle was then used to classify the soil type [19], while the soil bulk density (BD) was calculated using the following formula [20]:
SOC was estimated using the Walkley and Black [21] wet oxidation method, known for its rapid and cost-effective analysis.
The percentage of SOM was calculated using the formula [22]:
SOC was determined by dividing the SOM percentage by a conversion factor of 2 [23]:
SOC was then converted into total SOC stock (Mg ha-1) using the following Equation [22]:
Data Analysis and Modeling Techniques
All variables were standardized to ensure comparability across different measurement scales. Statistical techniques including Principal Component Analysis (PCA), Linear Mixed-Effects Model (LMM), Random Forest Regression (RFR), Bayesian Linear Modeling (BLM), Generalized Additive Model (GAM), and Multivariate Regression Analysis (MRA) were employed to explore the relationships between SOC and the various soil properties. Before applying the modeling techniques, multicollinearity was evaluated using Variance Inflation Factors, or VIF [24].
Each model was thoroughly validated using standard diagnostic techniques, including residual plots, R-squared values, and cross-validation. The significance of model coefficients was assessed, and model performance was compared across different statistical approaches to ensure reliability. All statistical analyses were conducted using R software version 4.4.0 [25]. To assess the performance of all models, a 10-fold cross-validation was employed. The dataset was divided into 10 subsets, with one subset used as the test set and the remaining nine as the training set in each iteration. This was repeated ten times, ensuring that every subset served as the test set once. The Root Mean Square Error (RMSE) was calculated for each fold's predictions, and the mean RMSE across all folds was used to gauge overall model accuracy. Consistent factor levels were maintained across the training and test datasets to ensure valid assessments [26, 27].
Results and Discussion
Soil Carbon Stock and Other Physicochemical Properties
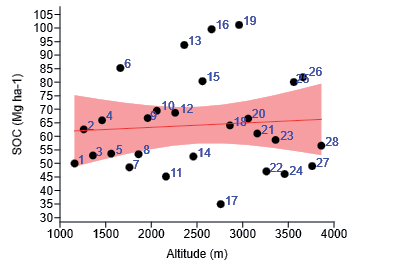
The overall average SOM content was 3.54±0.63%, with values of 4.10±0.77% for undisturbed soil and 2.98±0.85% for disturbed soil. The average SOC content was 1.77±0.38%, higher in undisturbed soil at 2.05±0.46% compared to 1.49±0.42% in disturbed soil. The average SOC stock was 64.14±7.16 Mg ha-1, with undisturbed soil containing 74.71±8.65 Mg ha-1 and disturbed soil 53.58±7.13 Mg ha-1. The maximum SOC of 101.15±10.21 Mg ha-1 was recorded at 2960 m and a minimum of 34.99±4.27 Mg ha-1 at 2760 m (Table 1). Bivariate analysis showed that SOC did not significantly correlate with altitude in the study area (Fig. 2).
The mean soil pH was 6.39±0.8, with undisturbed soil at 6.36±0.74 and disturbed soil at 6.42±0.9. The highest pH (8.13±1.5) occurred at 1360 m, and the lowest (5.44±1.2) at 3880 m. The average soil EC was 20.24±4.62 µS cm-1, with undisturbed soil showing 20.38±4.83 µS cm-1 and disturbed soil 20.10±4.41 µS cm-1. EC peaked at 44.25±7.54 µS cm-1 at 1560 m and dropped to 7.13±2.21 µS cm-1 at 3660 m. The average soil BD was 1.20±0.6 g cm-3, with undisturbed soil at 1.21±0.32 g cm-3 and disturbed soil at 1.19±0.15 g cm- 3. The maximum BD was recorded as 1.43±0.7 g cm-3 at 1660 m, and the minimum was 1.07±0.3 g cm-3 at 3660 m. (Table 1). In undisturbed soil, sandy loam was the most common, while loamy sand was the least common soil type. In disturbed soils, sandy loam was most frequently reported, and sand was least frequently recorded.
Principal Component Analysis (PCA)
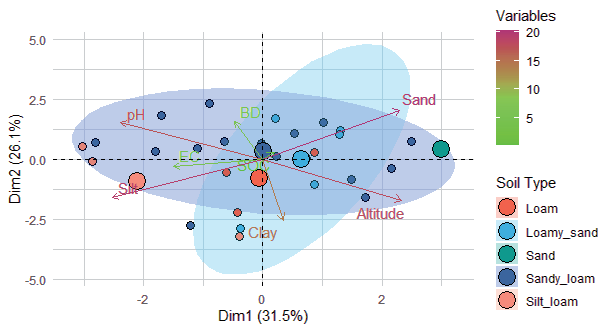
PCA revealed that the first three components (PC1, PC2, and PC3) described most of the variance in the data, cumulatively capturing 78.35%, with standard deviations of 1.5864, 1.4455, and 1.2891, respectively. PC1 explains 31.5% of the variance, while PC2 and PC3 account for 26.1% and 20.7%, respectively. The fourth to sixth components (PC4, PC5, and PC6) contributed less, explaining 11.3%, 5.9%, and 3.03% of the variance, respectively, bringing the cumulative variance to 98.6%. PC7 and PC8 contributed negligibly, with the cumulative proportion reaching 100%. The PCA biplot illustrated the distribution of variables and samples across PC1 and PC2, which together explain a significant portion of the total variance (Fig. 3).
Table 1.
Average soil carbon stock and physicochemical properties.
Linear Mixed-Effects Model (LMM)
The LMM results revealed that the intercept was 60.21 (standard error = 10.74), with a t-value of 5.61 and a p-value of 6.81×10⁻6, demonstrating a statistically significant baseline level of SOC. Conversely, the effect of altitude was estimated at 0.0016 (standard error = 0.0041), with a t-value of 0.39 and a p-value of 0.703, indicating that altitude does not have a statistically significant impact on SOC (Table 2). LMM suggested that while there is a significant baseline level of SOC, altitude does not meaningfully affect SOC within this model.
Generalized Additive Model (GAM)
The GAM results for SOC estimated the intercept at 64.78 (standard error = 11.02), with a t-value of 5.88 and a p-value of 6.44×10⁻6. This model also showed a statistically significant baseline level of SOC. Loamy sand confirmed a decrease of -2.68 (standard error = 13.79), sand decreased by -11.01 (standard error = 22.04), and silt loam decreased by -3.33 (standard error = 16.25), while sandy loam increased by 1.04 (standard error = 12.02). However, in this model, none of the categorical variables (soil type) showed a statistically significant impact on SOC, with p-values ranging from 0.62 to 0.93 (Table 2). The smooth function of GAM for altitude captured non-linear relationships effectively.
Bayesian Linear Modeling (BLM)
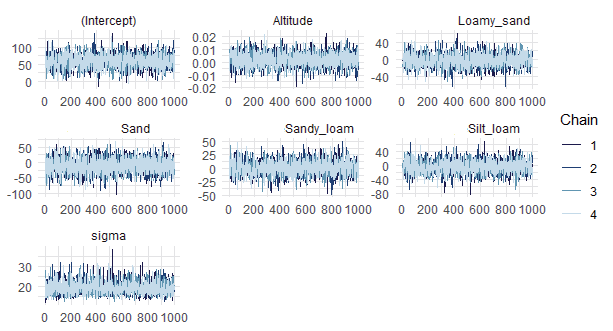
The BLM estimated the intercept at 58.71, representing the SOC level at zero altitude with soil type as the reference category. The coefficient for altitude remained 0.0022, indicating a small positive effect on SOC; specifically, SOC increased by approximately 0.0022 Mg ha-1 for each meter increase in altitude; however, this effect is minor. The model also reveals significant variability in SOC based on soil type. Compared to the reference soil type, SOC decreased by 1.94 Mg ha-1 for loamy sand, 10.39 Mg ha-1 for sand, and 2.85 Mg ha-1 for silt loam. Conversely, SOC increased by 1.76 Mg ha-1 for sandy loam. The BLM showed that soil type had a notable impact on SOC, with sand having the largest negative effect and sandy loam showing a moderate positive effect (Fig. 4).
Table 2.
Summary of Parameter Estimates for Linear Mixed (LMM) and Generalized Additive Models (GAM).
Random Forest Regression (RFR)
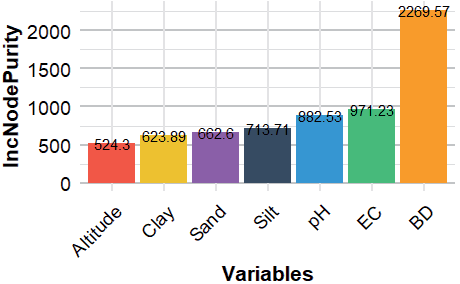
The RFR model evaluated the relative importance of predictors on SOC using 1000 trees. The results indicated that BD is the most influential predictor, with an increased node purity of 2269.57, suggesting it had the strongest effect on SOC. Soil EC followed with an increase in node purity of 971.23, indicating a substantial impact on SOC. Soil pH showed an increase in node purity by 882.53, making it another significant predictor. Sand, silt, and clay content had increased in node purity by 662.60, 713.71, and 623.89, respectively, reflecting their moderate influence on SOC. Altitude showed the lowest increase in node purity at 524.30, suggesting it has a lesser impact on SOC than the other variables (Fig. 5).
Multivariate Regression Analysis (MRA)
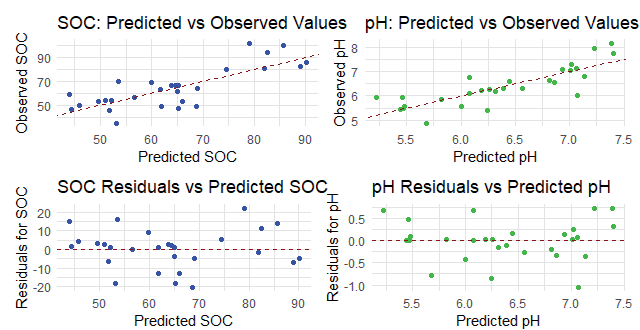
The MRA was used to predict both SOC and pH simultaneously, utilizing altitude, soil type, BD, etc., as predictors. The model output showed how these predictors jointly influence SOC and soil pH. The predicted versus observed plots for both SOC and pH display an increasing trend, indicating a good alignment between the predictions of the model and the actual data. Additionally, the residual versus predicted values plots for SOC and pH exhibited a straight distribution around zero, indicating that the residuals are evenly spread and conform to the predictions. This straight-line pattern indicated that the model effectively captured the variance in the data and reflected a good fit with an appropriate error structure (Fig. 6).
SOC and Physicochemical Dynamics in Himalayan Mountain Ecosystems
SOC is a key component of the terrestrial carbon cycle, impacting soil health, carbon sequestration, and ecosystem stability [1]. SOC levels can differ significantly due to factors such as altitude, vegetation, climate, topography, and soil properties. Comparative research across various mountainous regions is crucial for understanding how these factors influence SOC dynamics [28]. The study recorded significant differences in soil physicochemical properties between undisturbed and disturbed areas, with higher SOM and SOC in undisturbed sites. Disturbances, topography, and heavy grazing led to SOC loss in disturbed areas [29]. Reduced SOC in degraded soils reflects carbon loss through oxidation, reduced organic inputs, and erosion-driven depletion [1, 30].
The literature review revealed significant spatial variability in SOC across the Himalayan region, influenced by elevation, vegetation, and land use. In the Indian Himalayas, SOC ranges between 50-150 Mg ha-1 [31], while in the Garhwal Himalayas, values between 124.8 and 185.6 Mg ha-1 have been observed [32]. In Himachal Pradesh, SOC varied from 36.04 to 73.26 Mg ha-1 [33], and in the broader Indian Himalayas, levels of 31.5 Mg ha-1 have been recorded [34]. In the Central Himalayas, SOC values between 63.9 and 83.8 Mg ha-1 are reported [35]. In the Punjab region of Pakistan, values of 30.19 Mg ha-1 [36] and in the Western Himalaya, SOC levels ranging from 27.18 to 34.89 Mg ha-1 have been found [37]. Other significant findings include soil carbon ranging from 261 to 370.6 Mg ha-1 in Kashmir, Western Himalaya [38], and from 56.7 to 337.8 Mg ha-1 in Bhutan Himalaya [39].
Lower SOC values are partly due to forest type, soil composition, and depth differences. In the study area, SOC loss is also driven by forest cover reduction and biomass extraction. In mountainous regions, steep slopes exacerbate soil degradation and impact SOC pools [40]. Forest composition and biomass production are influenced by physiographic and topographic factors, with elevation-induced climatic changes affecting precipitation patterns and soil characteristics [28]. Variations in soil structure also affect water retention and nutrient binding, leading to differences in SOC levels. Higher SOC levels enhance soil structure, stability, and fertility, reducing erosion and nutrient leaching [31]. Nonetheless, SOC is vulnerable to disturbances that can release CO2 and deplete carbon stocks, indicating the importance of effective carbon sequestration and soil health management [3, 4]. SOC is higher in regions with favorable climatic and topographic conditions, dense forest cover, and minimal human disturbance [3]. Conversely, agriculture, deforestation, and land degradation reduce SOC, underscoring the need for sustainable land management practices to mitigate climate change [1].
Soil pH and EC remained stable between disturbed and undisturbed areas, with only minor increases in disturbed soils. Soil pH decreases with altitude and tends to be slightly acidic, promoting plant growth and SOC accumulation [41]. The acidity can enhance SOC by slowing organic matter decomposition. EC, which indicates soil salinity and nutrient cycling, typically rises with soil solution content but can impede plant growth and SOC accumulation. The relationship between EC, SOC, and altitude varies, reflecting the ecological complexity of mountain ecosystems [42].
Soil BD showed minimal variation across conditions, with a slight decrease in disturbed areas, as it is influenced by soil structure, texture [43], and organic matter, which decreases with altitude and increases with soil depth. However, climate change and land management practices can exacerbate soil compaction and impact SOC and BD interactions [44]. Lehmann and Kleber [45] found patterns similar to those revealed by this study. Furthermore, the relationship between BD and SOC is explained by Six et al. [46], who demonstrated that compacted soils retain SOC by slowing down microbial decomposition.
Our findings indicated that while disturbances significantly reduced SOM and SOC [8, 29, 47], other soil physical and chemical parameters exhibited resilience to disturbance in the studied mountain ecosystem. This resilience may be vital for maintaining ecosystem functions despite changes in soil organic matter and carbon stocks [10].
Model Evaluation and Applicability
Highly correlated predictors can obscure the influence of individual variables in statistical models. The Variance Inflation Factor (VIF) helps identify these issues, with values above 5 or 10 indicating potential multicollinearity problems [48]. Addressing multicollinearity may involve removing or combining predictors or using regularization techniques. Standardizing variables is crucial for accurate comparisons across different scales, particularly in methods like PCA and BLM, to prevent any single variable from disproportionately influencing the results [49].
RMSE is a key metric to evaluate the accuracy of predictive models, with values ranging from zero to infinity. Lower RMSE values indicate better model performance, which is affected by the model’s complexity, the data’s distribution, and the presence of outliers [50]. The models were assessed based on their RMSE values. The GAM exhibited the highest RMSE at 20.91, indicating the lowest predictive accuracy among the models evaluated. Following GAM, the BLM recorded an RMSE of 19.1, while the LMM demonstrated an RMSE of 16.52, reflecting a moderate level of predictive capability. Notably, the MRA model achieved an RMSE of 16.26 for SOC predictions and a remarkably low RMSE of 0.61 for pH predictions, signifying exceptional accuracy in pH estimations. The RFR model emerged as the most accurate, with an RMSE of 13.46 for SOC, showing its effectiveness in capturing complex interactions and non-linearities within the dataset.
In this study, flexible models like RFR and MRA outperformed linear models, as evidenced by their lower RMSE values. RFR performed best due to its ability to capture complex, non-linear relationships in the data, while MRA excelled in pH predictions. In contrast, linear models such as GAM, BLM, and LMM had higher RMSE values, with GAM showing the lowest predictive accuracy, likely because linear models resisted more complicated data patterns. The results revealed the advantage of flexible models in handling complex interactions, where linear models fall short [51]. The variations in RMSE among the models also illustrated the influence of model complexity and data structure on predictive accuracy [52].
PCA reduced correlated data to a smaller set of uncorrelated components, explaining 78.35% of the variance with the top three components. The first reflected the role of clay in stabilizing SOC by protecting it from decomposition [53]. Sandy soils, which showed lower loadings, have lower SOC due to reduced protection of soil organic matter. This analysis underscores the significance of soil texture in SOC stabilization [43].
LMMs indicated that soil type significantly influenced SOC (p<0.001), while altitude had no notable effect (p = 0.703). Similarly, GAM showed no significant non-linear effect of altitude on SOC, highlighting the need to account for other factors like climate and soil composition. This indicates that altitude alone does not fully explain SOC variability, with factors like organic input and erosion playing key roles. BLM showed a slight positive effect of altitude on SOC, with credible intervals pointing to reduced decomposition at higher elevations. Soil texture, particularly loamy sand and sandy loam, influenced SOC retention [43, 54]. RFR emphasized the role of BD in limiting microbial activity and enhancing SOC retention [46]. EC and pH also significantly affected nutrient availability and microbial activity, which is crucial to SOC dynamics [53].
MRA effectively modeled SOC and pH together, demonstrating how factors like altitude and soil type interact to influence both variables. The residuals showed a good fit, affirming the relevance of the predictors. The consistency of results across models supports the robustness of findings, particularly regarding the impact of soil type on SOC, reducing concerns about model-specific biases [31]. The alignment across models ensures reliable predictions and a comprehensive understanding of SOC and pH dynamics [55].
The models linked SOC dynamics to ecological processes, emphasizing the importance of soil type and texture in SOC stabilization. Clay-rich soils were found to better protect SOC from decomposition than sandy soils. While altitude did not directly influence SOC, it likely affects it through associated variables like temperature and moisture [56]. However, the RFR model revealed an improved impact of BD compared to simpler models [57]. However, discrepancies with other studies may arise due to data types used for modeling and local conditions.
Modeling techniques face limitations that can influence outcomes. Missing data, if not random, can introduce bias, and both imputation and data exclusion may affect representativeness and prediction accuracy [58]. Small sample sizes, especially in complex models, can lead to overfitting or underfitting, reducing parameter reliability and model performance. Additionally, limited spatial data or uneven coverage can hinder the ability to accurately capture variability, leading to the misrepresentation of predictor relationships in diverse landscapes [58, 59].
Future soil carbon modeling research could be improved by adopting more advanced models, such as deep learning, to capture non-linear interactions that traditional methods might miss. High-resolution data from remote sensing or frequent soil measurements could increase predictive accuracy, offering a deeper understanding of SOC dynamics [60]. Enhanced cross-validation methods, including factors like microbial activity or land management practices, could further improve model reliability. Validating models with independent datasets across diverse regions would strengthen the applicability of the findings [61].
The practical implications of this study are significant, as it provides information that can influence environmental policy and promote sustainable land management practices. A better understanding of SOC dynamics can guide carbon management strategies and support the development of effective SOC management practices [62]. This is vital for climate models that rely on accurate SOC data to predict carbon fluxes and assess mitigation strategies. The findings can also support conservation efforts by emphasizing the importance of soil texture and bulk density in carbon storage [63]. Together, these improvements could lead to more effective soil and climate management policies.
Conclusions
This study provides valuable insights into SOC dynamics and associated physicochemical properties in disturbed and undisturbed soils across different altitudes. The results highlight the following key findings: (i) Undisturbed soils have significantly higher SOC levels, highlighting the negative impact of disturbances and land degradation. (ii) Altitude had no significant effect on SOC levels in the study area, as supported by models like the LMM and GAM. (iii) Soil properties (pH, EC, and BD) showed resilience to disturbance. BD emerged as a key predictor of SOC retention, particularly in the RFR model, which captured non-linear relationships better than linear models. (iv) PCA reinforced the role of clay-rich soils in SOC stabilization, while sandy soils were linked to lower SOC levels. (v) The RFR model performed best in capturing SOC variability; however, cross-validation is necessary to avoid overfitting. (vi) While consistent with existing research, discrepancies regarding the influence of altitude may stem from regional differences in soil composition and conditions. The study suggests that future research could benefit from incorporating advanced modeling techniques and additional variables, such as microbial activity, to further refine SOC predictions. These findings have practical implications for soil carbon management and climate mitigation, emphasizing the importance of soil structural attributes in carbon sequestration and sustainable land management practices.

