


Introduction
The intensity of debris flow in Central Sulawesi after the 2018 Palu earthquake is increasing at this time. Besides being triggered by rainfall, landslides on unstable slopes caused by earthquake shocks can also be a cause. Slopes with high steepness, especially in the upstream catchment, are very susceptible to becoming unstable and subsequently it will become easily eroded and landslide even at low intensity rainfall. The flow with a high sediment concentration erodes the cliffs and river channels and then transforms into material deposits in the downstream section along with the decrease in the slope of the river bed [1-2].
Debris rivers generally carry high concentrations of sediment. This material can not only come from eroded slopes and landslides, it can also come from very massive river channel erosion. Debris material triggers high destructive power to the river channel and water structure in the river. In fact, often flood debris can endanger agricultural areas, settlements and other areas in the downstream segment. Debris material that settles simultaneously also has a bad impact on channel capacity [3-5].
The government has carried out control and handling of debris flow and material in the Sombe-Lewara river by controlling upstream erosion and building sediment control structures along the river channel such as sabo dams, check dams, ground sills and end sills, revetments and several other similar structures. Due to the high destructive power caused by material debris, these control structures do not function optimally. Even some of them have collapsed due to the inability to accommodate and hold debris material [6-7].
The complexity of the debris flow characteristics and the high impact of the damage require a special, careful and in-depth study due to the uncertain nature of the triggering factors. Rainfall as the main trigger is very hard to predict due to climate change, especially in tropical areas such as Indonesia [8]. Recently, in the study area, the intensity and duration of rainfall tend to increase, often the duration of the rainfall is more than 24 hours with an intensity above 100 mm/day. The characteristics of rain like this can trigger debris flow with a very large potential hazard.
Studies on debris flow and its relation to sediment transport have been carried out, especially in the Sombe-Lewara river by several researchers. Bawias investigated the impact of sand mining on the bed profile around the sediment control structure [9]. Intensive sand mining, especially upstream of sediment control structures, can cause bed degradation. Edison et al. studied the conservation strategy in the Sombe Lewara catchment to reduce the erosion rate which contributes to the sediment supply in the Sombe-Lewara river [10]. They propose recommendations for land rehabilitation and soil conservation to reduce erosion potential by 20,770 tons/year. Recent research conducted by Pratama et al. and Pratama which relates to the prediction of potential sediment transport rates in connection with sand mining activities along the river channel. The results of the study show that the sediment transport rate is indicated to be in a high category along with the increasing rainfall intensity and the potential for erosion and landslides in the upstream area [11-12].
Based on this series of studies, it indicates that the sediment transport rate in the Sombe-Lewara river increases along with the high sediment supply from the upstream catchment. Massive erosion and debris flow contributed greatly to the rate of transport. Sediment control has been carried out in a sustainable manner but has not shown optimal performance. Sand mining activities as a construction material have triggered the bottom degradation and instability of riverbanks.
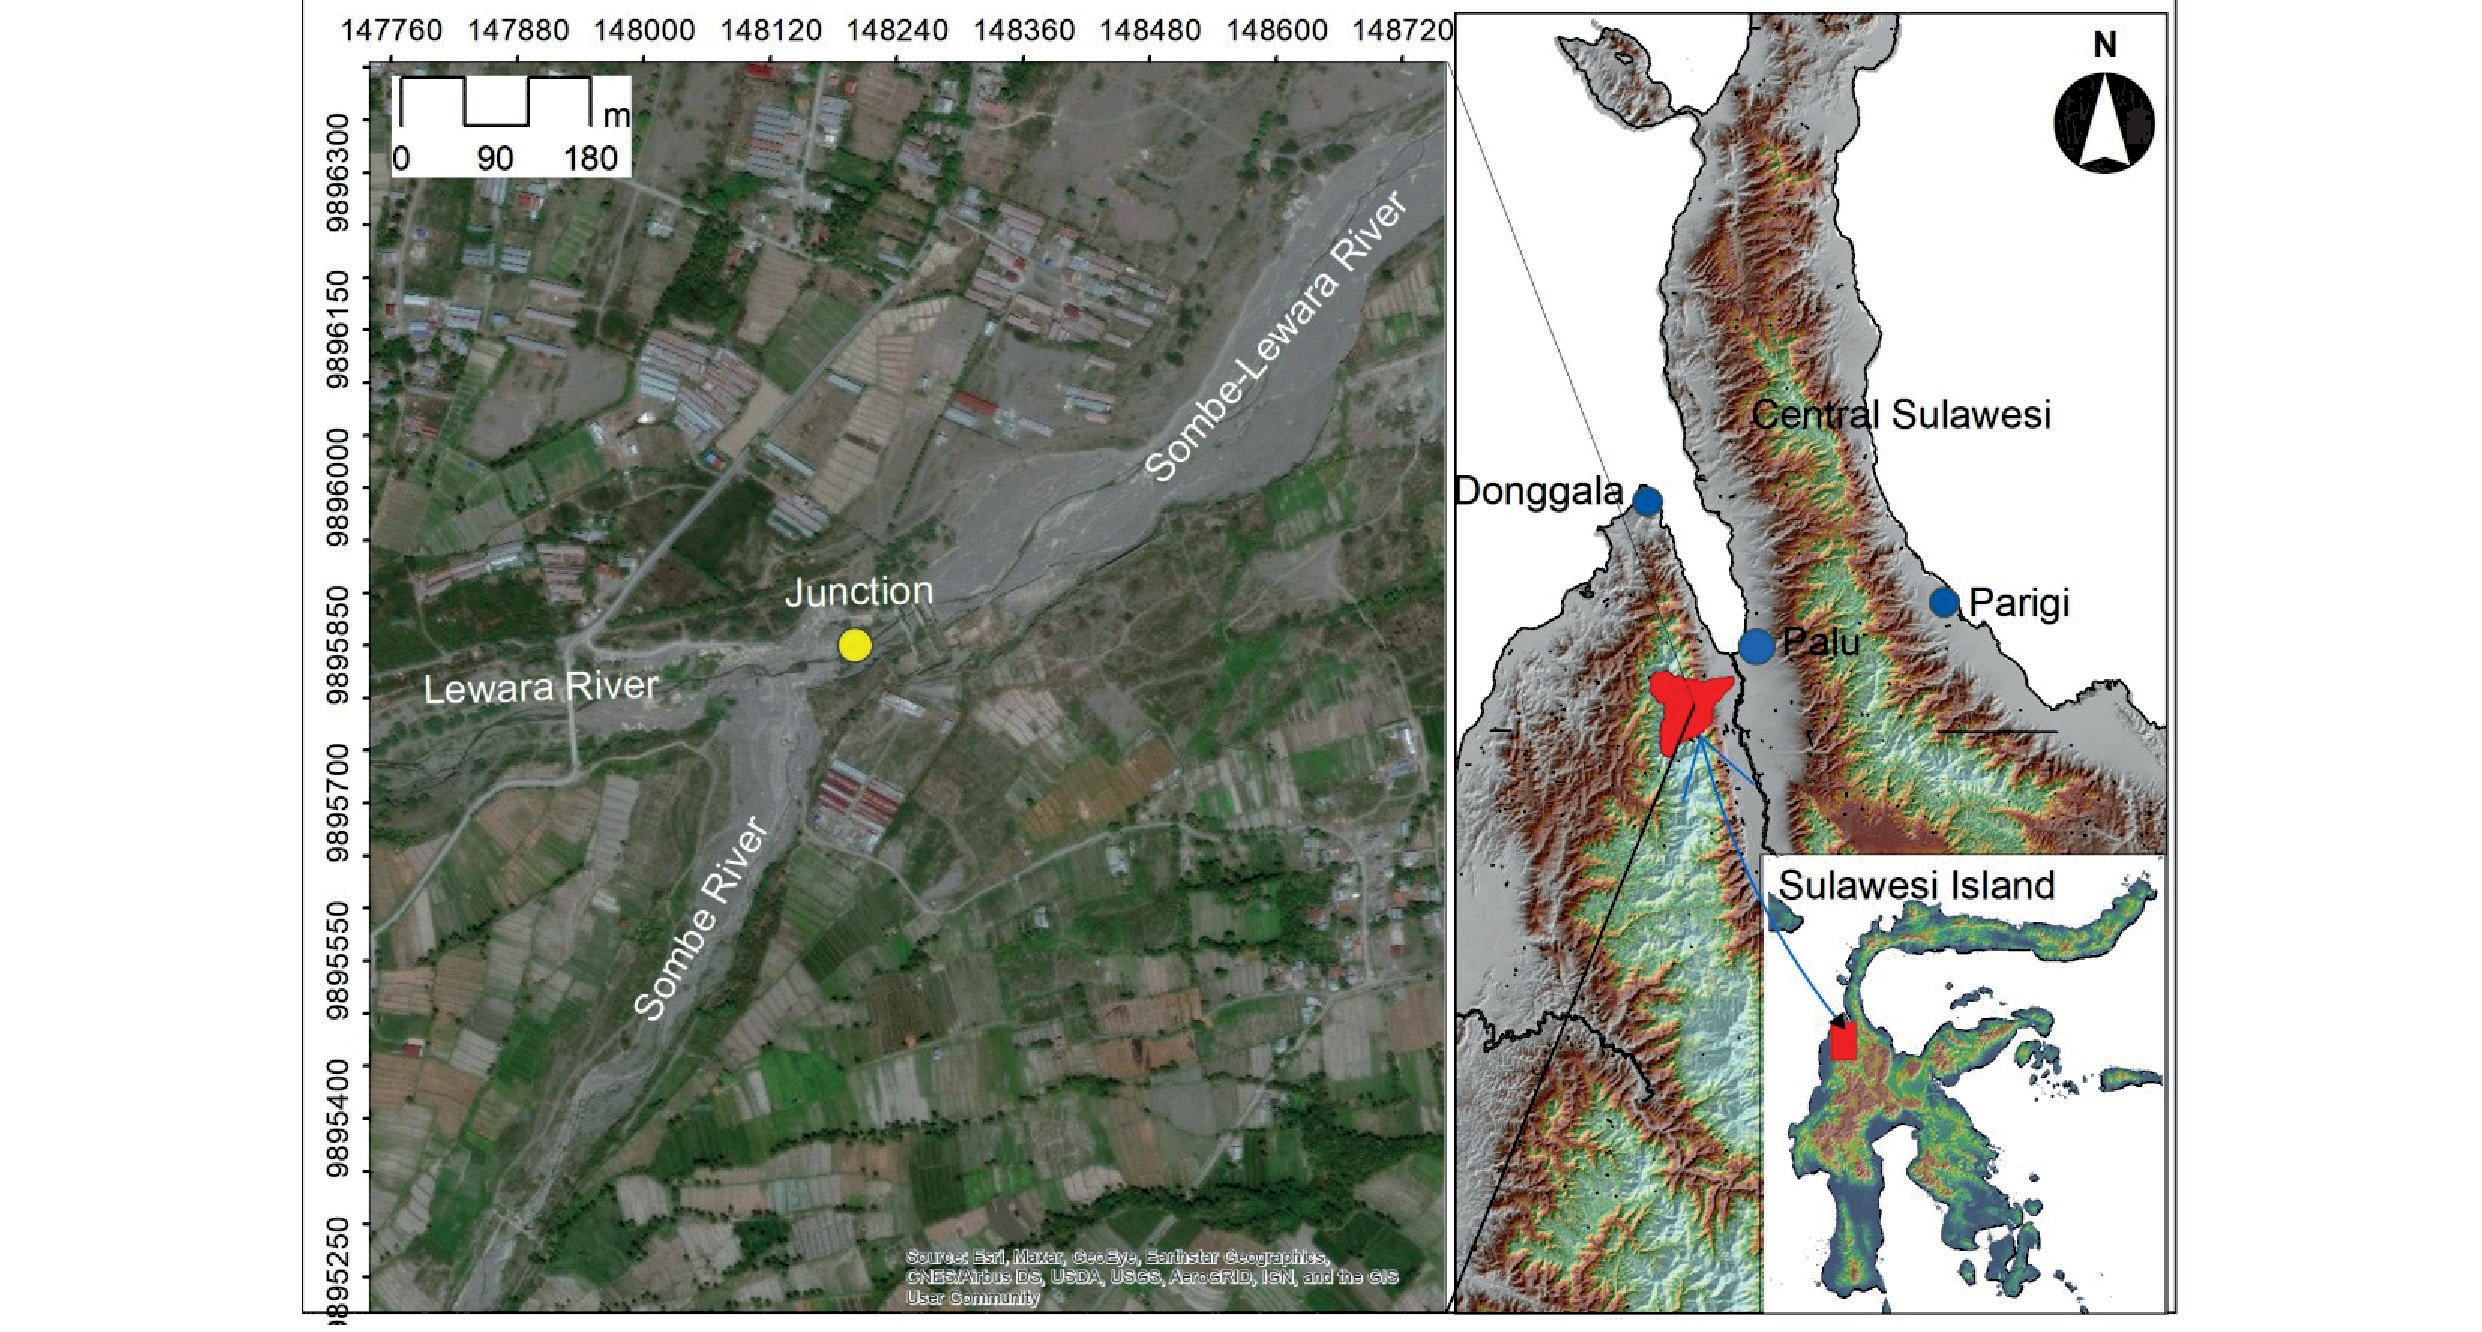
Referring to the complexity of sediment problems in the Sombe-Lewara river, this research is very important to be performed. This study examines bed profile changes along the evaluated segment without distinguishing the presence of sediment control structures in that segment, especially at river confluence due to debris flow. The built hypothesis is that these sediment control structures have the potential to affect the stability of the bed profile. Based on the results of this study, the existence of existing sediment control structures can be reviewed and a new control concept can be proposed.
Material and Methods
Study Area
This study was carried out in one of the debris rivers in Central Sulawesi, Indonesia: the Sombe-Lewara River (Fig. 1). This river with a catchment area of approximately 84.73 km2 is a combination of two tributaries known as the Sombe river on the right side and the Lewara river on the left side. The discharge of the Sombe River is slightly higher than the discharge of the Lewara River due to the difference in catchment area. The two sub-catchments show an elongated shape and the width of the catchment decreases gradually downstream until it reaches the junction and finally rouge in the Palu River. This river is the most downstream river on the west side of the Palu Catchment which contributes to the flow of the Palu River [11].
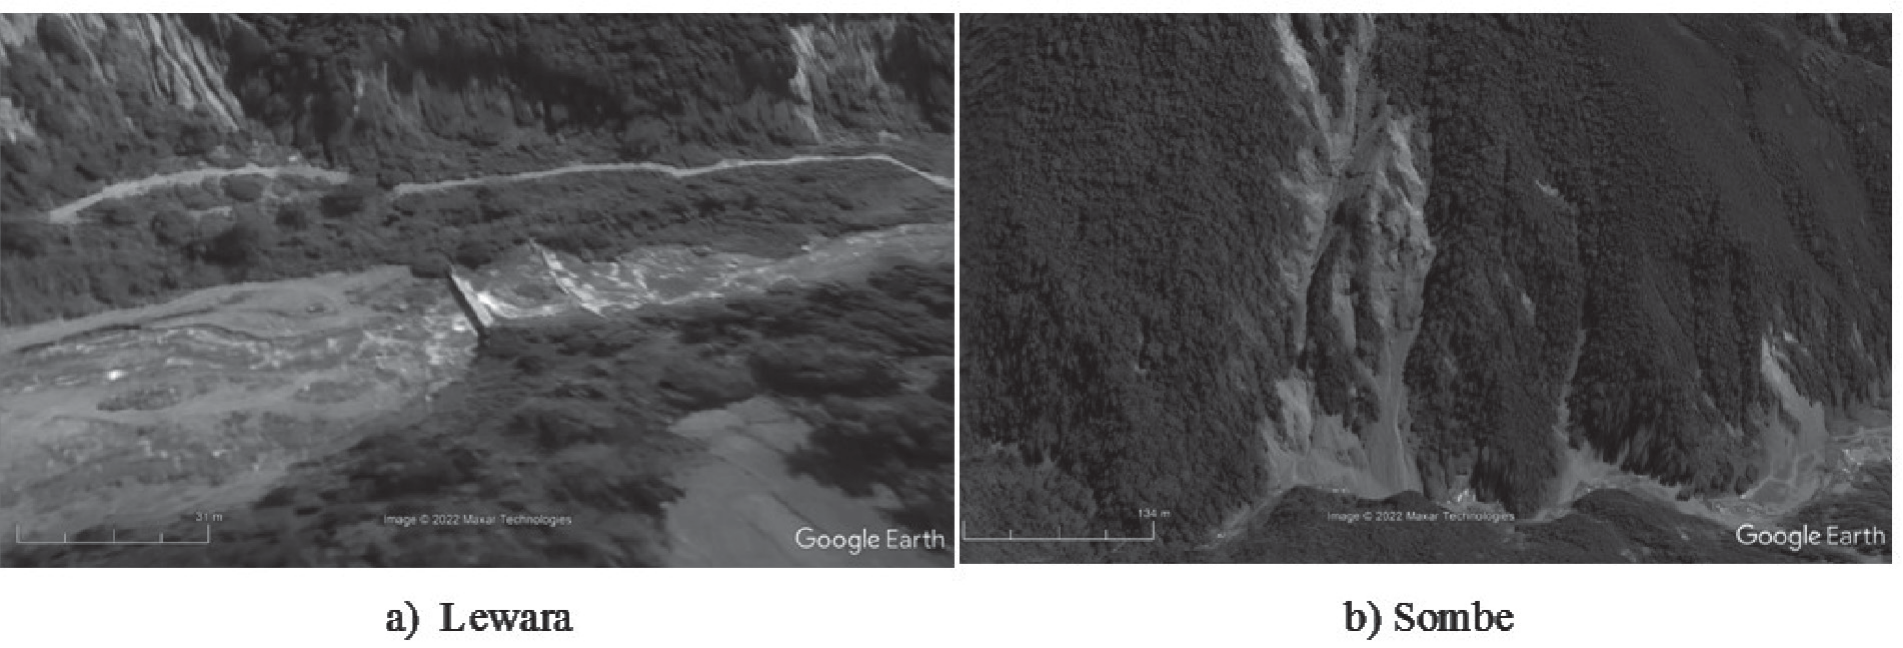
As a debris river, along the river segment from the middle to the downstream, it can be seen the bed sediment deposit with a high concentration of mud content. The intensity of sediment transport increases during the rainy season where the rainfall intensity is generally high. In addition, the 2018 Palu earthquake has the potential to trigger slope instability, especially in the upstream catchment with steep slopes (Fig. 2). Slope instability can cause erosion and landslides even though the rainfall intensity is relatively low.
Along the Sombe-Lewara river segment, at least 20 sediment control structures have been constructed. There are structures that function as sediment reservoir, sediment diversion, bed stabilizers and there are also as river bank reinforcements. Sediment deposited on the structure is mined by local communities as construction material. Material mining activities at that location have the potential to affect sediment transport characteristics and river bed stability. However, the mining activity of this material has been authorized by the local government as a way to maintain the capacity of the sediment control structure.
Data Details
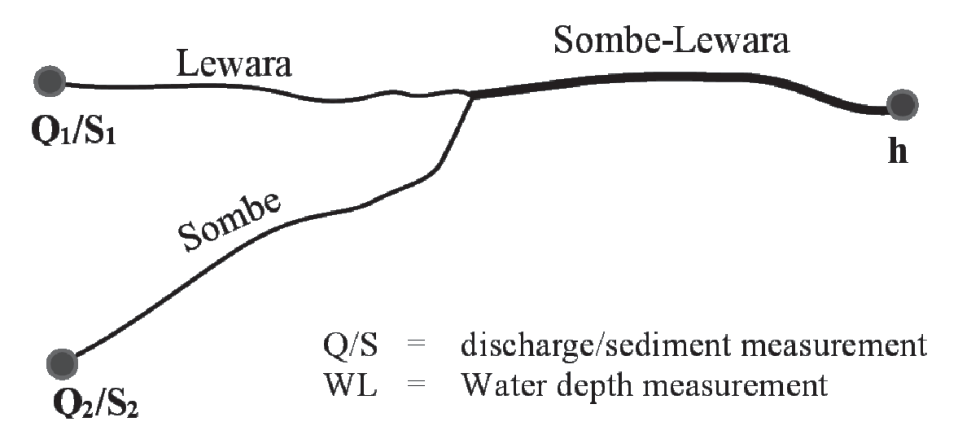
The data of this research are the results of field investigations and secondary data obtained from government institutions such as the River Basin Management Board of Sulawesi III, Forestry Office of Central Sulawesi and others. Primary data in the form of measurements of discharge, water level elevation, sediment bed samples in the Sombe river, Lewara river and Sombe-Lewara river. This data is the input of the HEC-RAS model for Manning roughness calibration and sediment transport simulation. Another important primary data is the cross section of the river along 1 km upstream and 1 km downstream measured from the confluence of the two rivers. The location of the primary data measurement can be seen in Fig. 3.
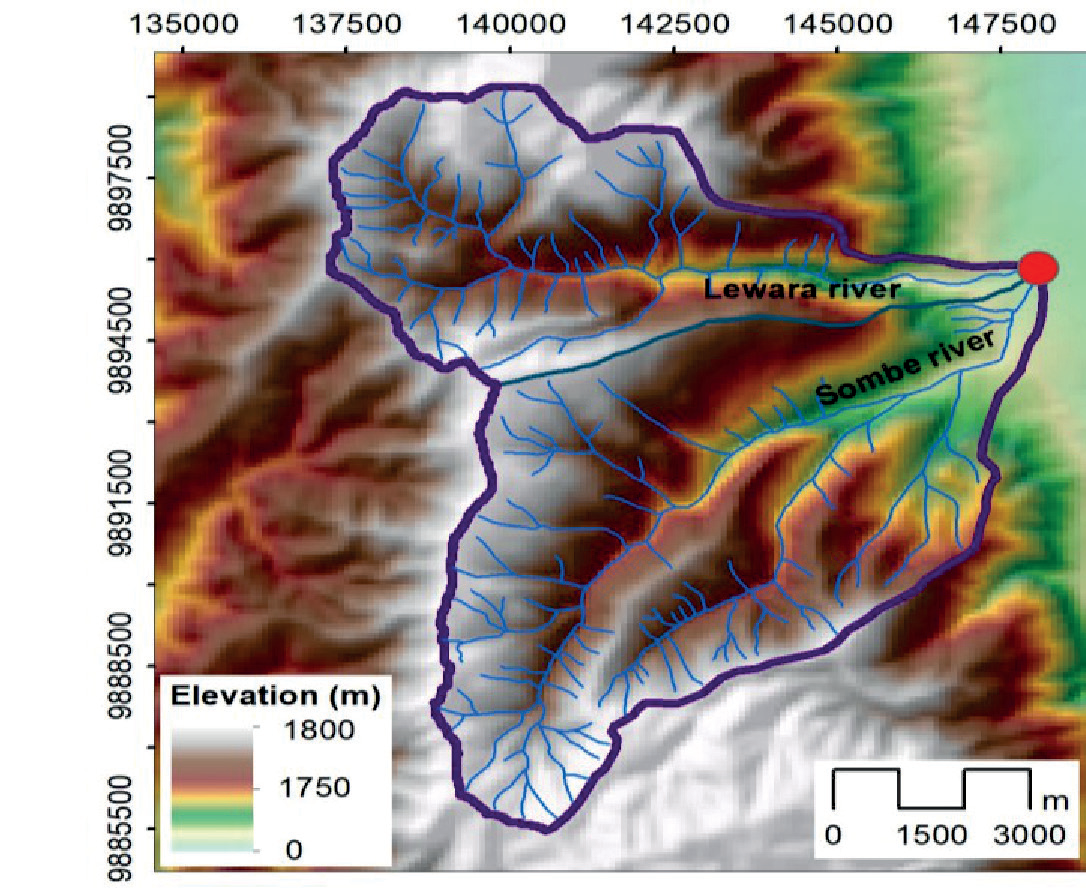
Other data in this study as secondary data is daily rainfall data obtained from the Porame rainfall station for the period 2011-2020. This data is used as a transformation material to predict the average discharge due to the unavailability of discharge data. This transformation process also uses other data such as topographic data/digital elevation model (DEM), land use/land cover data and soil characteristics data. DEM data is the basic data for compiling catchment as shown in Fig. 4.
HEC-RAS Hydrodynamic Model
HEC-RAS is a hydrodynamic program that can be applied to calculate the intensity of sediment transport in natural or artificial channels. Fluctuations in transport intensity due to changes in sediment supply from upstream areas cause changes in the bed profile. Changes in the channel bottom profile due to sediment transport are divided into 2 types: degradation and aggradation [13-14]. Degradation is a decrease in the channel bottom due to erosion of the bed channel, while aggradation is an increase in the channel bottom due to sediment deposits transported from upstream. Riverbed degradation occurs because the outgoing sediment transport is lower than the incoming sediment transport. On the other hand, riverbed degradation occurs when the outgoing sediment transport is more than the incoming sediment transport. If sediment transport occurs in a balanced way between in and out, the riverbed will be stable.
There are at least 6 sediment transport equations in the HEC-RAS Model: Ackers-White, Englund-Hansen, Laursen, Toffaleti, Yang, and Meyer-Peter Müller (MPM) equations. This study will apply the last equation considering that in various cases, the MPM equation has been indicated to be quite reliable. This equation is widely used for the calculation of river sediment transport with coarse-grained sedimentary material with a particle size between 0.4 to 29 mm and a specific gravity of 1.25, which is expressed by [15-16]:
where: kr = a roughness coefficient, kr' = a roughness coefficient based on the grains, γ = unit weight of water (N/m3), R = hydraulic radius (m), S = energy slope, γs = unit weight of sediment (N/m3), dm = median diameter of the particle (m), g = gravity acceleration (m2/s), gs = rate of unit sediment transport (weight/time/ unit width), and τ' = the Shield’s stress.
Methods
This research was carried out by hydrodynamic simulation using the HEC-RAS model. As stated in the previous section, the application of this model is intended to predict the bed profile changes caused by flow. Conceptually, bed profile changes can be represented by sediment transport at dominant discharge conditions. The dominant discharge as the input of this hydrodynamic model is expressed by the average discharge over a long period of time. Since discharge data is not available at the study site, this parameter can be obtained from daily rainfall data through the transformation process using the HEC-HMS model.
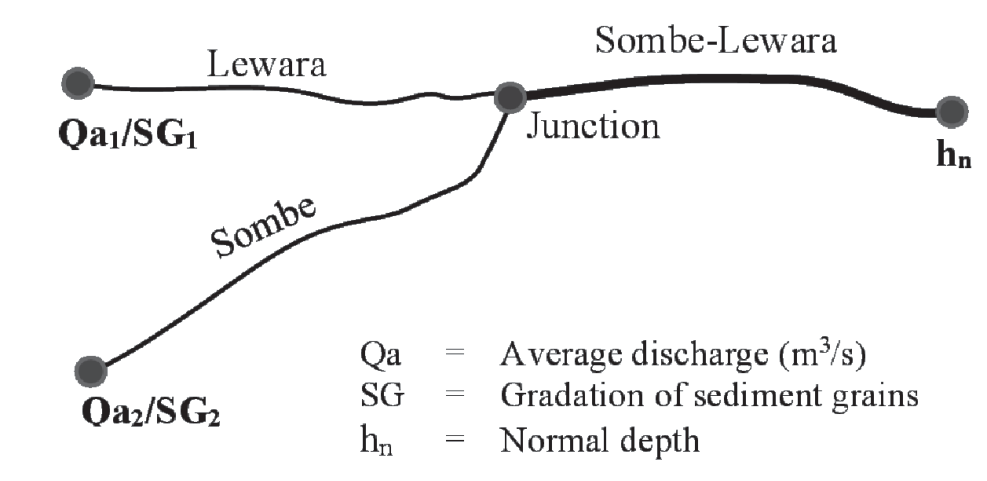
In addition to the average discharge as the upstream boundary, at the downstream end, normal depth boundary conditions are also set. Sediment data at both upstream boundaries are inputted as grain size gradations. The simulation is performed under quasi-unsteady flow conditions. The profile bed modeling scheme can be seen in Fig. 5.
Results and Discussion
Average Discharge and Sediment Gradation
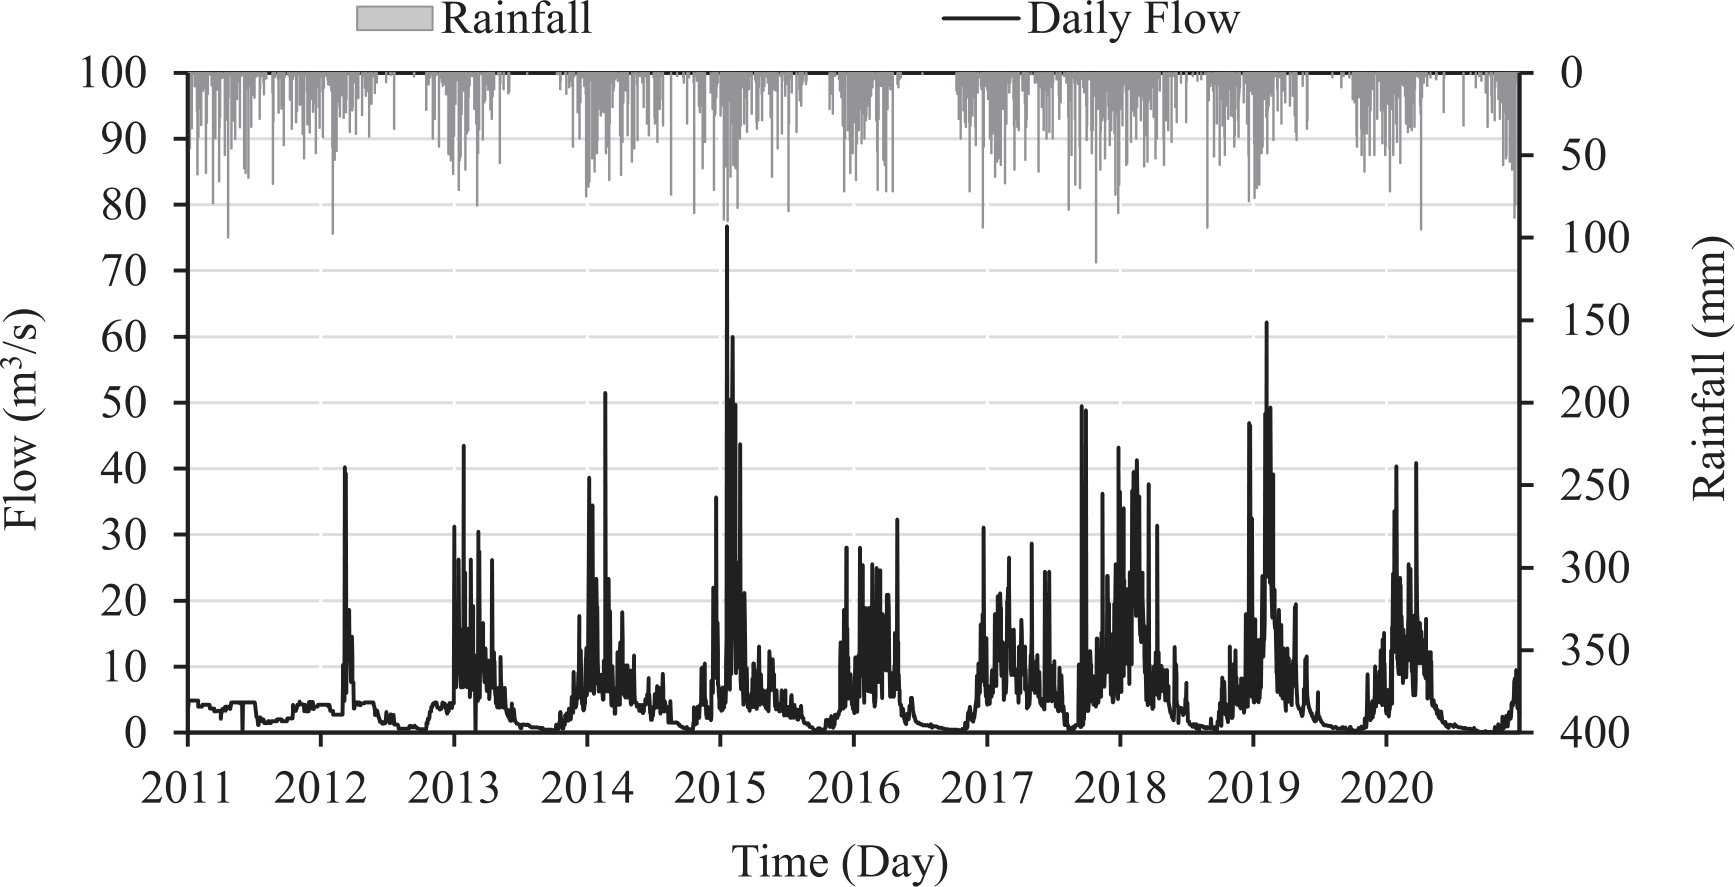
As introduced in the previous section, the average discharge is obtained from the daily rainfall transformation for the 2011-2020 period in the two sub catchments: Sombe and Lewara. The simulation results using the HEC-HMS Model show that the daily average discharge in the two sub catchments is 1.95 m3/s and 1.03 m3/s, respectively. The transformed daily rainfall for 10 years is shown in Fig. 6.
Furthermore, based on the analysis of the gradation of sediment grains at the two sample investigation sites, the results of the sieve analysis indicated that the gradations of the two samples showed similarities at d35, d50, d60 and d90. Both samples show that the type of sediment grain belongs to the sand and coarse gravel group. The grain sizes of the two sediment samples are presented in Table 1.
Manning Parameter
One of the important parameters in the hydraulic modeling of flow both in the channel and in the river is the roughness parameter. Physically, this parameter can be determined based on the type of bed material and river bank [17]. Channel beds with fine materials tend to trigger higher velocities than coarse materials. The basic material of river beds can be formed from fine sand, coarse sand, gravel, coarse gravel to large rocks. Flow fluctuations in the river affect the bed configuration at any time. Bed configuration becomes stable in dominant discharge conditions. This dominant discharge is a discharge that dominates over a certain period of time, for example 1 year. This discharge is generally close to the minimum discharge in the river.
Table 1.
Grainsize of sediment sample.
| Grainsize | Diameter (mm) | |
|---|---|---|
| Sombe | Lewara | |
| d35 | 0.9 | 0.7 |
| d50 | 3.1 | 4.2 |
| d60 | 5.1 | 8.2 |
| d90 | 18 | 17 |
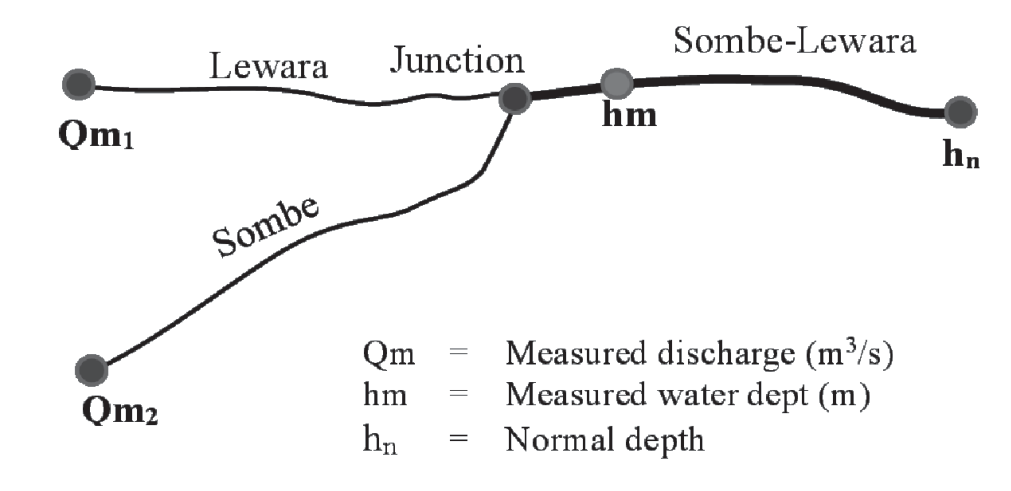
Simultaneous determination of roughness coefficient can be performed with model calibration. HEC-RAS was performed with measured discharge inputs at both ends of the upstream river (Qm1 and Qm2) with normal depth as the downstream boundary condition (Fig. 7). This normal depth can be expressed by the slope of the riverbed in the downstream section of the junction. The simulated water depth is compared with the observed water depth at a predetermined point (hm). If the two water depths show a small difference, the roughness coefficient that has been set can be considered as a representative roughness coefficient.
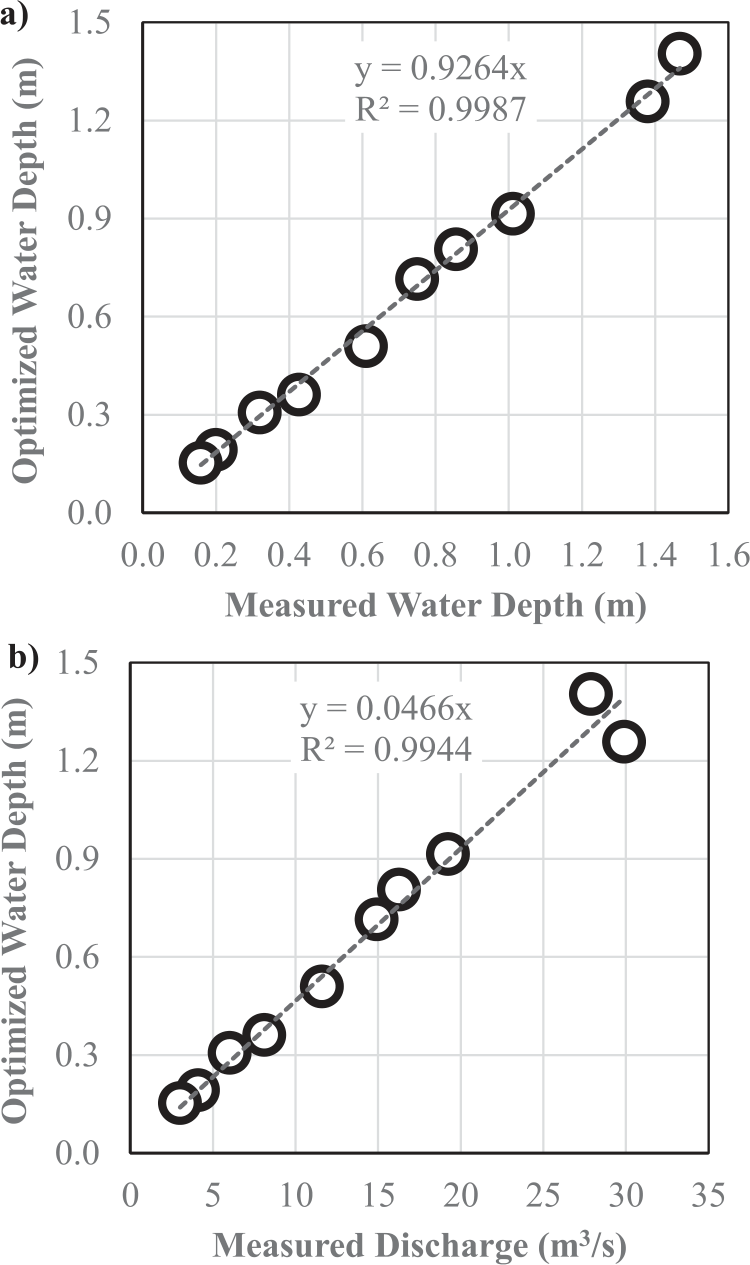
A series of ten running models have been performed for calibration as shown in Table 2. Several rougness coefficients have been entered in the HEC-RAS Model which is referred to from the type of bed material which is dominated by sand and gravel. This is done in connection with the unavailability of optimization facilities in this model. For sand and gravel materials, the rougness coefficient ranges from 0.020 to 0.030. The average optimal roughness coefficient representing the various discharge variations was obtained at 0.0265, with the mean difference between the observation water depth and the simulated water depth being 7.6%. The calibration results of the roughness coefficient are indicated to be very satisfactory due to the low water depth deviation. In addition, the correlation between observed and simulated water depth is also very good (Fig. 8a). This performance is also confirmed by the high correlation between the observed discharge and the simulated water depth which is close to 1 (Fig. 8b). This shows that the roughness coefficient of 0.0265 can be applied to represent various depths with regard to sediment debris modeling.
Basically, the coefficient of roughness is a very difficult parameter to determine. This parameter is not only affected by the roughness of the bed material but also the interaction between the bed material and the flow. Friction between the stream and the river bed can increase the roughness. The roughness caused by this interaction is referred to as hydraulic roughness. This roughness is the reference in performing calibration in the HEC-RAS Model.
The important thing that can be observed in determining the roughness coefficient is the dependence between velocity and roughness coefficient. Increasing the flow velocity can increase the roughness coefficient and vice versa. Therefore, the bed roughness under stationary flow conditions is the basic roughness as a reference for determining hydraulic roughness.
Bed Profile
Bed profile analysis is based on the HEC-RAS Model simulation with input average discharge at both upstream boundaries, selected roughness coefficient and normal depth at downstream boundary conditions. The choice of upstream boundary conditions is to accommodate the dominant discharge as a representation of the bed profile formation in the river. As published by a number of researchers, the bed profile is formed slowly and gradually over a long time due to the interaction of discharge, transported sediment and river cross section [18-19]. At a certain time, dynamic equilibrium will be reached, where the intensity of incoming and outgoing transport is balanced which indicates a stable sediment transport. This can be met if the supply of sediment from the upstream area is constant and stable.
Table 2.
Calibration of the roughness coefficient at different discharges.
Debris rivers generally carry very large amounts of sediment especially during heavy rainfall. The supply of sediment originating from cliff and slope landslides triggers massive sediment transport and is subsequently deposited in rivers. On other occasions, this deposited sediment will be transported back when the frictional stress triggered by the flow exceeds the critical frictional stress of the sediment. Erosion and sedimentation in the river will fluctuate simultaneously as long as the sediment supply is available continuously from the upstream area.
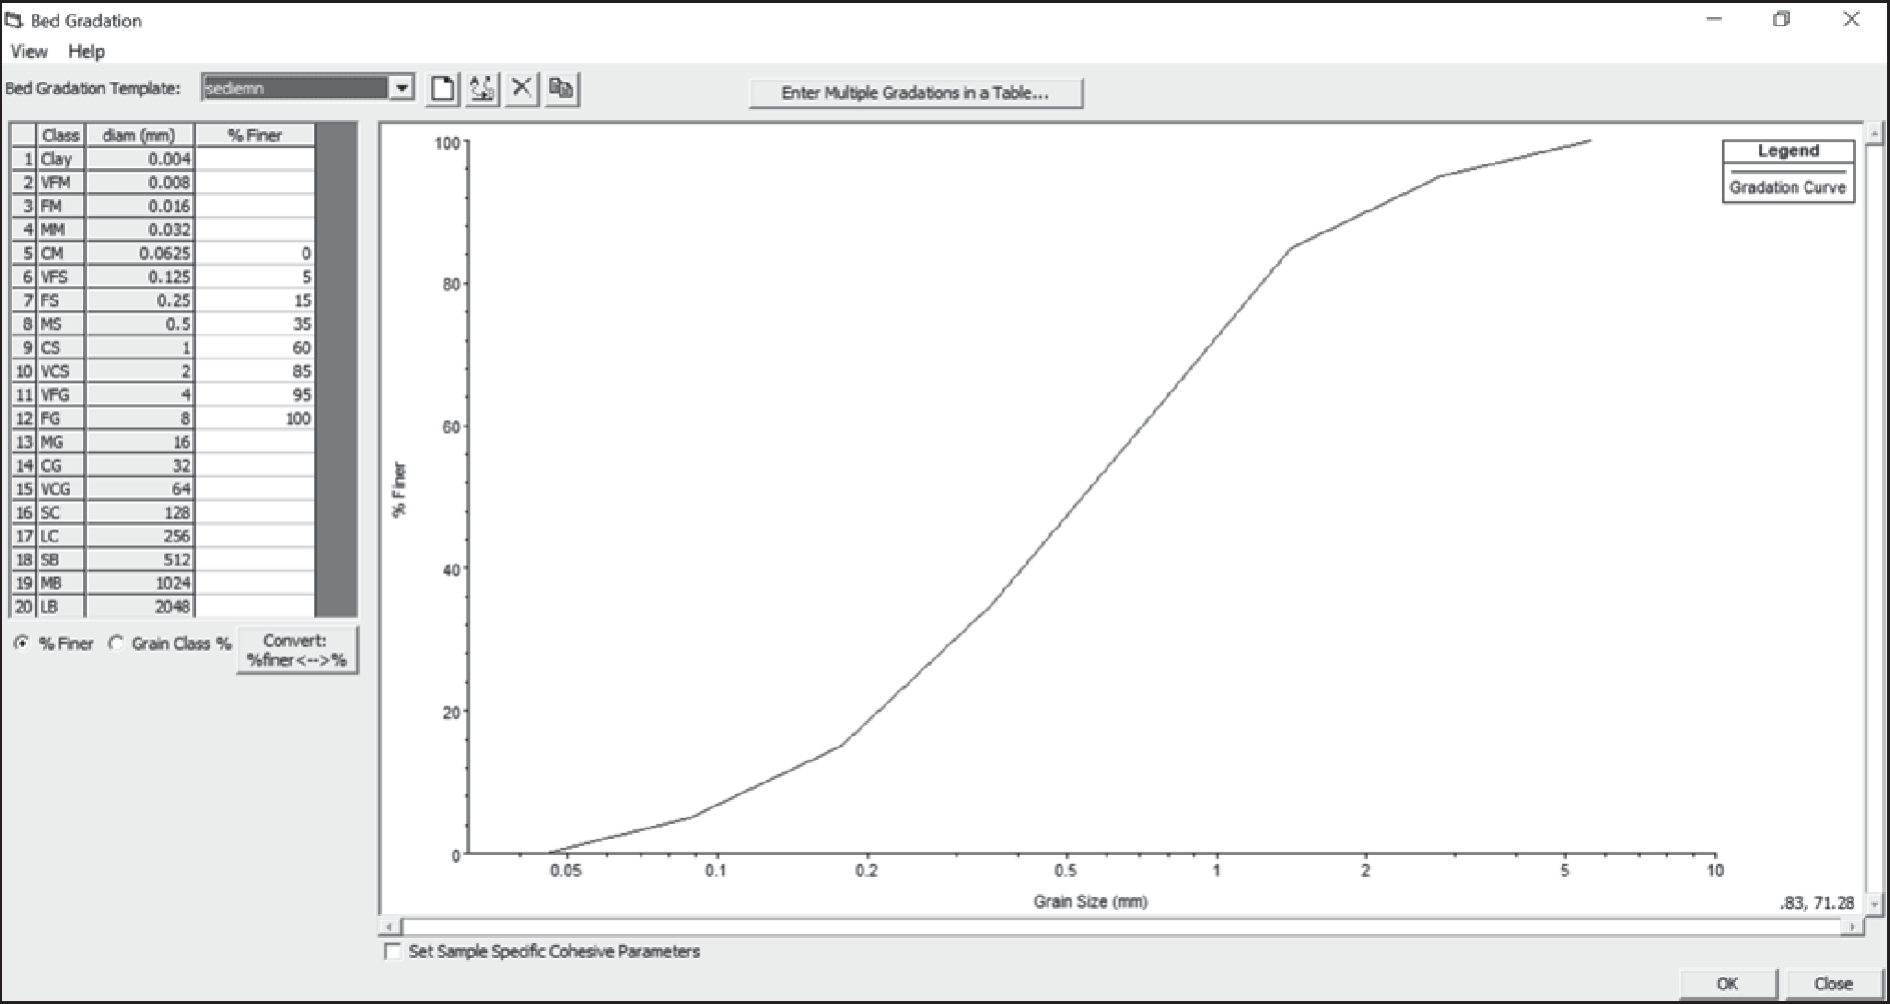
The definition of sediment transport in the HEC-RAS Model is filled in by inputting the gradation of sediment grains at both ends of the upstream boundary: Sombe and Lewara. Gradation of sediment grains is expressed by the relationship between sediment diameter and % finer (Fig. 9). These two gradation curves can represent the size distribution of sediment in each of the tributaries transported and deposited along the downstream river channel. When examined in detail on the gradation curve in Fig. 9, most of the sediment grains have a coarse fraction and are dominated by gravel. This is related to the nature of the debris flow where the high flow velocity has selected the fine grains to be transported downstream first. Generally, the fine fraction settles in the river mouth where the flow velocity reaches stagnation due to backflow from the estuary. Coarse fractions are generally deposited in the upstream area according to the carrying capacity of the flow that transports them. Likewise, it will erode again along with fluctuations in flow velocity.
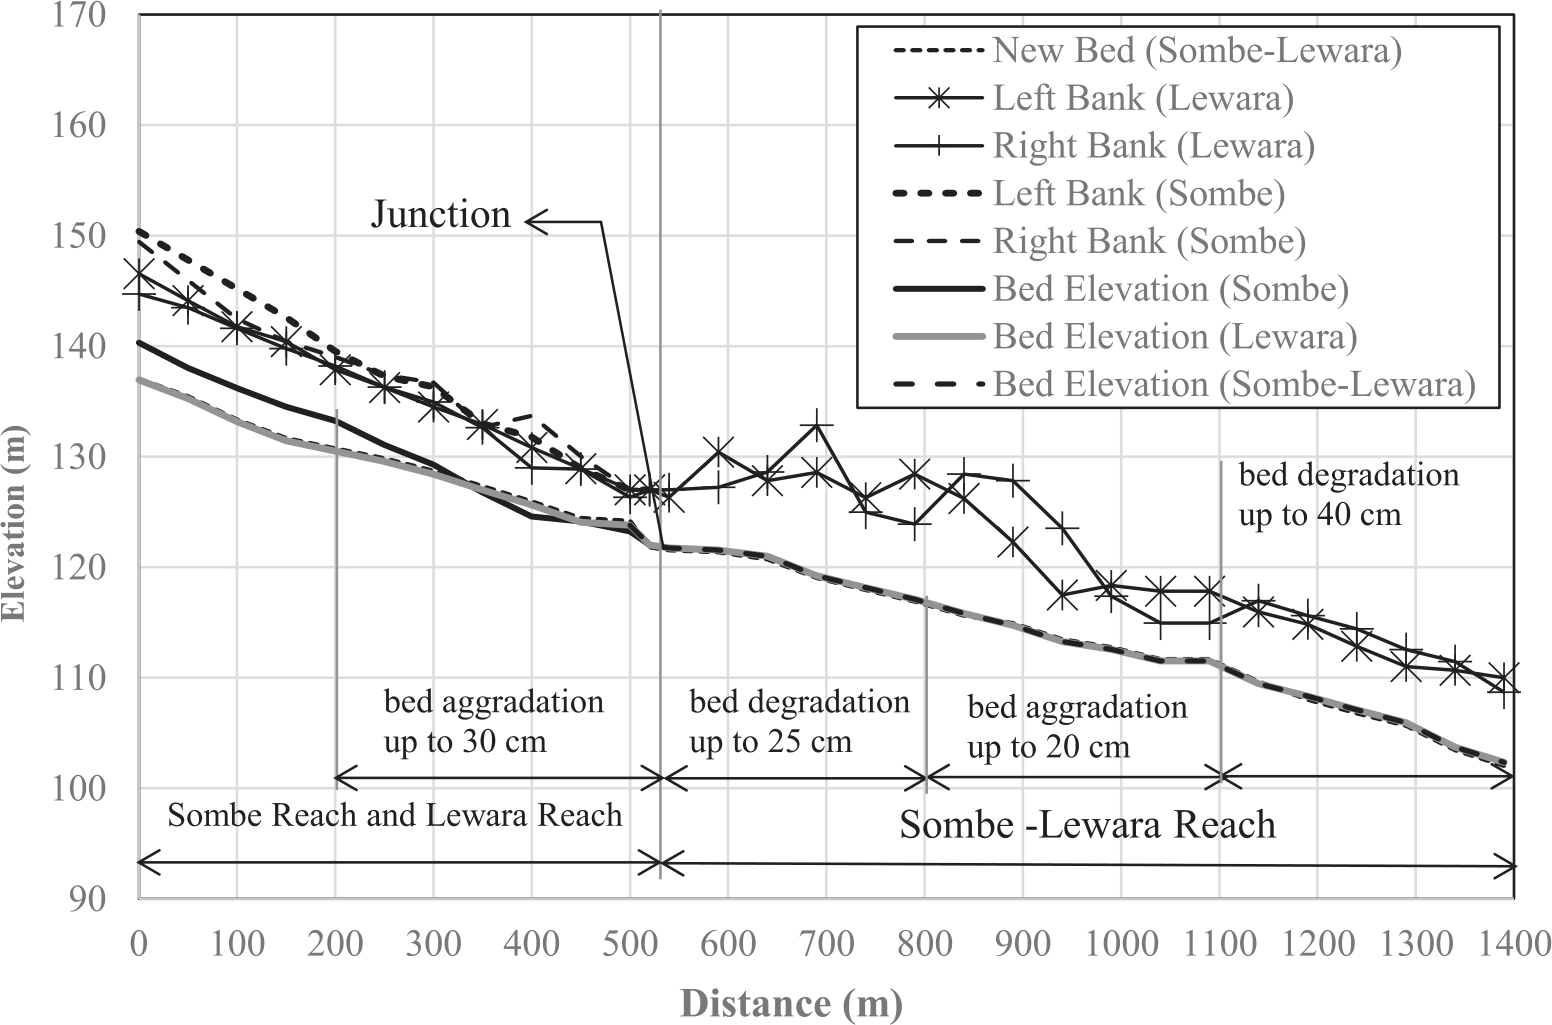
The hydraulic simulation of sediment transport to predict bed profile changes can be seen in Fig. 10. The total section modeled is 1420 meters long, consisting of 900 meters downstream of the junction and 520 meters each upstream of the junction. The average bed river slope is relatively uniform both upstream and downstream of the junction, with a slope of more than 1%. This indicates that the Sombe-Lewara river can be categorized as a high-sloping river. This is related to the topographic typology of rivers that empties into the Palu River located in hilly and mountainous areas.
The simulation results show that several basic profile shapes are indicated along the section under review. In general, bed elevations upstream of the junction tend to rise up to 0.30 meters, especially on the inner side of the river cross section. The deposition of sediment in this area is related to the stagnation of flow velocity from the Sombe and Lewara rivers. The streamlines of the two rivers meet at the junction and the meeting of the two streamlines causes velocity stagnation and has an impact on decreasing the carrying capacity of the flow. It has also been suggested by some researchers that flow stagnation creates transported sediment deposits [19-20]. Furthermore, downstream of the junction, scour tends to occur and the bed river has the potential to decrease due to the velocity shift from stagnation to accumulation. The increase in velocity and changes in the cross-sectional width downstream of the junction caused sediment deposition along the segment. However, the shape of this bed profile will continue to change dynamically during sediment and flow fluctuations.
Experimental and numerical studies that have been carried out by Ludeña et al. (2017) stated the formation of backwater in the upstream of the confluence [21]. This backwater is triggered by flow confluence in the stagnation zone. Flow velocity in this zone tends to weaken due to merging streams as also reported by Bilal et al. (2020) who studied sediment transport in river confluence [22]. Sediment grains have the potential to be deposited in this zone related to the weakening of flow due to stagnation, as also confirmed by Smith et al. (2019) which revealed deposition in the upstream and erosion in the downstream confluence [23]. Yang and Cong (2019) state that the cause of sediment deposition in the upstream of the confluence is as a result of streamline convergence at the junction along with reduced shear stress and Froud Number [24]. Therefore Gosh (2022) declared that the confluence represents locations of abrupt change of sediment transport that affect the morphology of the bed profile [25].
Studies on sediment transport in the confluence of river debris have not been widely reported in publications, especially in tropical regions such as Indonesia. Therefore, as the state of the art of this research, the most important point of this study is that the accumulation of flow in the junction affects the velocity of the debris flow. Debris material tends to be deposited upstream of the junction due to flow stagnation, although it is not very significant. If the bed slope of the river is low, the deposition intensity tends to be higher and vice versa. In addition, the concentration of debris flow also affects the rate of deposition. Meanwhile, bed aggradation at the downstream junction is not only caused by an increase in velocity after stagnation, but also as a result of changes in cross-section which can trigger an increase in flow velocity.
Changes in bed profile due to debris flow in the junction segment can be explained by scouring phenomena around the bridge pier. Stagnant flow in front of the pier causes the flow energy to drop momentarily and can cause bed material to be deposited upstream of the pier [15]. Furthermore, the downflow upstream of the pier forms a flow vortex which is known as a vortex, along with increasing turbulent intensity behind the pier. In addition to increasing the turbulence intensity downstream, the vortex also increases the shear stress from the left and right of the pier to a certain distance behind the pier. Increasing the shear stress in the bed causes scouring in a certain pattern [18]. Scouring will begin to weaken in proportion to the decrease in shear stress at a certain distance behind the pier, and then the flow will return to normal. The longitudinal profile scouring around this pier can reflect changes in bed elevation at the junction of debris river segments [19].
However, this research still has limitations in several aspects. This study has not accommodated the confluence angle which can affect the bed profile as stated by Ludeña et al. [21]. Variations in the slope of the bed on confluence have also not been performed in this modeling, where the slope of the bed can also affect velocity at the junction as reported by Yang and Cong [24]. Moreover, this study also did not represent unsteady flow conditions in the river, where the sediment transport simulation in this study was performed under steady flow conditions. Therefore all of these limitations can be improved in further research with the support of more detailed field verification.
Conclusions
The hydraulic simulation has been performed at the confluence segment of the Sombe and Lewara rivers to predict the potential bed profile changes caused by debris flow. The boundary conditions of the model are defined by average discharge at the upstream end of the segment and sediment gradation at the downstream boundary. Manning roughness calibration has been performed through parameter optimization by evaluating the difference between the observed and simulated water levels at the downstream boundary point. Manning roughness represents the material characteristics of the bed and bank which affect the flow velocity and water level along the segment. Verification of transported sediments was not carried out due to limitations of observation data. However, the reliability of the model can be represented by the calibration results of the discharge and water level.
The simulation results show that the river bed elevation at the upstream confluence is higher and at the downstream segment is lower than the initial profile conditions. The increasing of bed profile at the upstream of the junction is caused by the deposition of sediment grains along with the reduced velocity due to stagnant flow originating from the two tributaries, whereas the degradation of the bed at the downstream segment is caused by an increase in velocity due to flow accumulation after the flow stagnates at the junction. The enlargement of the turbulence flow after stagnation causes an increase in erosion energy in the vertical direction to the bottom and the horizontal direction to the bank.
The characteristics of turbulence in each segment of the river vary depending on the intensity of stagnation at the junction. The intensity of stagnation is proportional to the discharge in both tributaries which affects the rate of sediment transport before and after the junction. This phenomenon is similar to the flow characteristics around bridge piers where sediment is deposited upstream of the pier and degraded downstream of the pier. The elongated profile of the scouring around the piers can also illustrate changes in the bed profile at the river junction. In addition, the bed elevation next to the downstream junction can also fluctuate due to various factors such as changes in cross section, bed slope, hydraulic structures, back water, and others. The results of this study become a reference for sediment control due to debris flow at river confluence.

