

Introduction
Slow and controlled-release fertilizer can reduce nutrient release rates, greatly improve fertilizer utilization rates, and reduce environmental pollution and economic loss [1, 2]. However, some slow-controlled release fertilizers are difficult to degrade in soil [3]. The degradation characteristics of slow-release membrane materials are directly related to the slow-release effect of fertilizer and the ecological effect of the soil environment [4]. Therefore, it is of great practical significance to study the degradation performance of membrane materials.
The coating materials with inorganic minerals such as white wax, rosin, and sulfur as the main raw materials have poor sustained release and mechanical properties [5, 6]. Phenolic resin, polyacrylic acid, polyurethane, polyolefin, and polyester organic materials have good mechanical properties and slow release properties, but they are difficult to degrade and cause some environmental pollution [7-9]. The exploration and preparation of environment-friendly, degradable, sustained-release membrane materials has become a hot issue to be solved in social development. The polyvinyl alcohol and polyvinylpyrrolidone used in this paper have good film-forming ability, environmental protection, and degradation [10, 11]. Zeolite is widely available and inexpensive [12, 13]. The components of membrane materials are closely related to their degradation characteristics. The components of membrane materials in this paper are different from those in previous studies, and the degradation characteristics may be quite different, which needs to be further clarified. Previous studies have studied the degradation characteristics of membrane materials under different conditions of moisture [14] and degradation duration [15], and it was clear that the degradation rate of hemp fiber film was the fastest under a 25% soil moisture condition, and most of the acetate-starch film can be degraded after 150 days. However, earlier studies did not take into account the effect of soil temperature on degradation characteristics, and the effect of soil temperature-moisture coupling on membrane material degradation was still unknown. The degradation model construction can be used to precisely quantify the relationship between the degradation rate constant of membrane materials and the single factor effect of soil temperature and water [16]. However, the single temperature or water degradation model fails to quantitatively reflect the influence of the soil temperate-water coupling effect on membrane material degradation rate, which needs to be investigated further.
The purpose of this research was to explore the influence of soil temperature, moisture, and their coupling effects on the degradation rate of membrane materials, to reveal the influence of each factor level on the morphology and structure of membrane material degradation, and to build a soil hydrothermal coupling model of membrane material degradation.
Materials and Methods
Materials
PVA 1799 (analytically pure) and PVP K30 (analytically pure) were purchased from Sinopharm Chemical Reagent Co., Ltd. (Shanghai, China). The average polymerization degree of PVA was 1700, and the alcoholysis degree was 98%~99%. The molecular weight of PVP was 45000~58000. 4A zeolite (industrial grade) was purchased from China Shan-xi Taiheng Technology Co., Ltd. (Jinzhong, China). Industrial 4A zeolite was a cage-connected structure consisting of 8 cubic octahedrons and 12 regular tetrahedrons formed by silicon-aluminum oxygen tetrahedral units, belonging to the cubic crystal system. The parameters of 4A zeolite were as follows: Specific surface area; 510 m2/g; whiteness >95%; apparent density, 0.3~0.5 g/cm3; average particle size, 2 um. PVA, PVP, and zeolite are non-polluting and environmentally friendly materials that can degrade under natural conditions and belong to environment-friendly materials. Epoxy resin (industrial grade) was purchased from China Shandong Yousuo Chemical Technology Co., Ltd. (Linyi, China). It could be toxic to the soil if used in excess. The soil texture was sandy loam. The parameters of the soil were as follows: field water holding capacity, 0.226 g/g; bulk density, 1.43 g/cm3; PH, 8.43; organic matter, 15.32 g/kg; total nitrogen, 1.12 g/kg; alkaline nitrogen, 52.21 mg/kg; available phosphorus, 22.31 mg/kg; and available potassium, 120.32 mg/kg.
Fabrication of Membrane
Weigh PVA with a mass of 51.1 g and deionized water with a mass of 626.5 g in a three-necked flask that was in the oil bath pan. At the beginning of the experiment, the temperature of the oil bath pan was kept at 95ºC, and the PVA was completely dissolved after about 1.5 h. Then, PVP with a mass of 4.9 g was added when the solution was cooled to 60ºC, and the solution was stirred at constant temperature until completely dissolved. Zeolite with a mass of 3.5 g was added to the water-based copolymer solution for mixing and stirring for 1 h. Finally, the epoxy resin with a mass of 14 g was added to the mixed solution and reacted for 2 h to obtain the membrane solution. Take 20 ml of membrane solution and dry it in an incubator to form a membrane.
Experimental Design and Methods
Three levels of soil moisture W were set in the experiment: W60, W80, and W100, which were 60%, 80%, and 100% of field water capacity, respectively. Three levels of soil temperature T were set: T15, T25, and T35, which were 15ºC, 25ºC, and 35ºC, respectively. A comprehensive experimental design was used with nine treatments. The experimental soil with a mass of 2.5 kg was put into a polypropylene square box with the same parameters, and the soil depth was set to 8cm. The self-made composite membrane material was dried to a constant weight and cut into a square with a size of 3×3 cm. The membrane materials with a mass of 1.125 g were buried in the soil with different moisture contents and put into the incubator at different temperatures. The burial depth of the membrane materials in the soil was set to 5 cm. During the test, water was replenished regularly to ensure that the soil water content was at the set level. After the membrane material was degraded for a certain period of time, it was dried in a vacuum to determine its weight at a constant weight.
Experimental Setup Parameters
The experimental setup parameters were as follows: polypropylene square box, length, 15 cm; depth, 10 cm; density, 0.89-0.91 g/cm3; fusing point, 164-170ºC; tensile strength, 25-39 Mpa; elongation at break, 200-400%, constant temperature biochemical incubator (SPX- 350BE), rated voltage, 220V/50HZ; rated power, 800W; temperature control range, 0-70ºC; temperature control accuracy, 0.1ºC.
Measurement Items and Methods
The degradation rate of membrane material G (%) refers to previous determination methods [17] and is calculated by formula (1). The molecular structure and chemical composition of the membrane material were analyzed by infrared spectroscopy [18]. The morphology of degraded membrane materials was photographed by SEM [19].
M0 and M1 were the masses of the sample to be tested prior to and after degradation.
Data Sample Processing
Microsoft Office 365 was used for data processing and table drawing. Origin 2019b was used for graph drawing, and a soil hydrothermal coupling model of membrane degradation rate was built based on 1 stop 8.0. The variance analysis of degradation characteristics of membrane materials under different soil hydrothermal conditions was conducted using IBM SPSS Statistics 22.
Result Analysis
Dynamic Changes in Membrane Degradation with Time under Different Hydrothermal Conditions
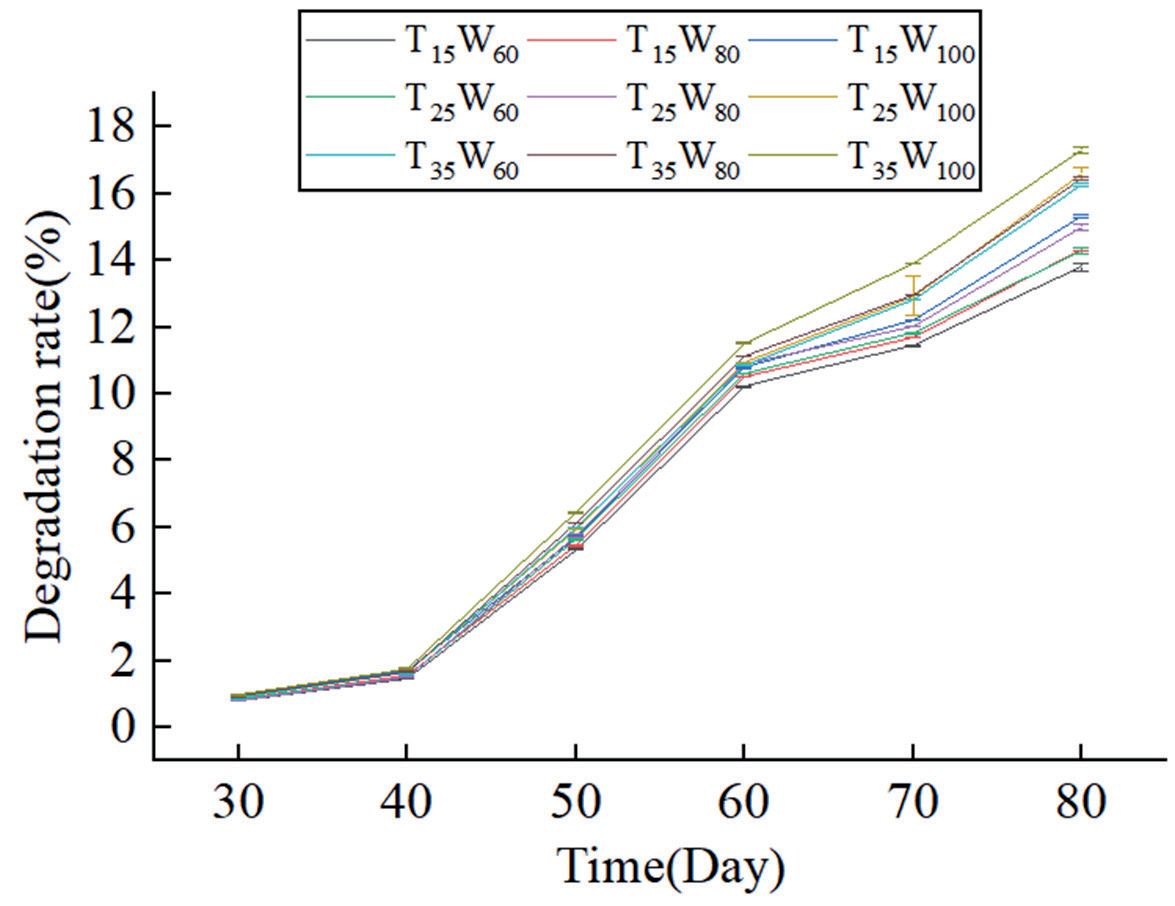
TThe dynamic curve of membrane degradation rate under different soil hydrothermal conditions is shown in Fig. 1. As shown in Fig. 1, the degradation rate of membrane materials was slow at first, and the degradation rate of membrane materials under different soil hydrothermal conditions differed little. At 30 days, the degradation rate of membrane materials under various treatments was 0.81%~0.97%. When the embedding time reached 40 days, the degradation rate of the membrane material began to significantly increase, indicating that as the embedding time increased, the internal structure of the membrane material was gradually destroyed and began to degrade significantly. The degradation rate of membrane materials under different soil, water, and heat conditions began to differ greatly between 50 and 80 days, with the difference reaching a maximum at 80 days. Under different soil, water, and heat conditions, the degradation rate of membrane materials reached a minimum of 13.7% under T15W60 treatment and a maximum of 17.3% under T35W100 treatment.
Effects of Different Hydrothermal Conditions on Degradation Properties of Membrane Materials
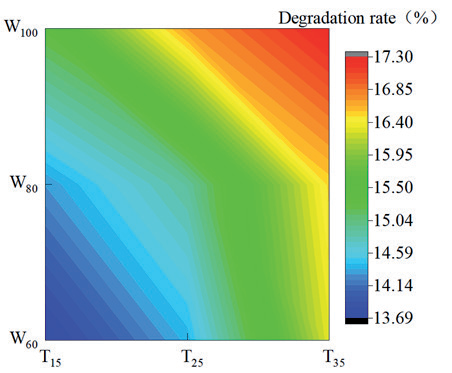
Fig. 2 shows the degradation rate of membrane materials embedded in soil for 80 days under different hydrothermal conditions. As can be seen from Fig. 2, the quality of membrane materials in soil with different moisture temperatures all suffered a certain degree of loss. The degradation rate decreased by 13.7%-17.3% under different treatments, and the difference in the degradation rate under different treatments was 4.38%- 26.28%. According to the mass loss rate and initial mass of membrane materials, the remaining mass of membrane material under different soil hydrothermal treatments was 0.154-0.195g. It showed that the degradation rate of membrane material varies greatly under different soil moisture and temperature conditions. It can also be seen from Fig. 2 that when the soil temperature was T15, T25, and T35, the soil moisture content was increased from W60 to W100, and the degradation rate of membrane materials monotonically increased by 11.68%, 15.97%, and 6.13%, respectively, indicating that the degradation rate of membrane material presents a positive response to the increase in water content, and the response was most obvious under T25. In the condition of W60-W100, when the soil temperature was increased from T15 to T35, the degradation rate of membrane material was monotonically increased by 18.98%, 15.38%, and 13.07%, respectively. This showed that the degradation rate of membrane material had a positive response to the increase in temperature, and the degradation rate had a stronger response to temperature when the moisture content was lower. It can be seen from the above analysis that there may be a certain interaction effect between soil moisture content and temperature on the degradation rate of membrane materials, so it is necessary to conduct a two-factor variance analysis on the data. Soil moisture and temperature on membrane materials have a significant influence on the degradation rate (p˂0.01), but the interaction effect of influence on the degradation of membrane materials has not reached a significant level (p>0.05). The influence of T, F, and T*F on the degradation rate of membrane materials was as follows: T>W>T*W.
Degradation Model Construction
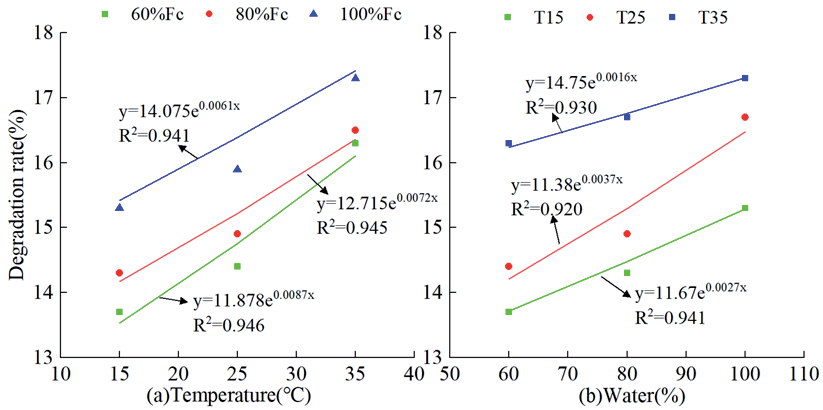
Fig. 3 shows the relationship between the degradation rate of membrane materials and hydrothermal factors. As can be seen from Fig. 3, the degradation rate of membrane materials under different treatments presents a monotonously increasing exponential change trend with the increase of temperature and water, which can be quantitatively described by using the single factor temperature model K (T) and water model K (W), respectively. It can also be seen from Fig. 3 that the determination coefficient R2 of K (T) and K (W) single-factor degradation models was above 0.9, which indicated high fitting accuracy. However, the single factor model made it difficult to accurately describe the coupling effects of soil temperature and moisture on the degradation of membrane materials. In order to accurately describe the effects of various factors and their coupling effects on degradation rate, it was necessary to construct a hydrothermal coupling model of the degradation rate of membrane materials. Therefore, Equations (2) and (3) were multiplied to further establish the hydrothermal coupling model K (T,W) of membrane materials degradation.
Where a, b, and c are the model parameters, t is soil temperature, and w is soil moisture.
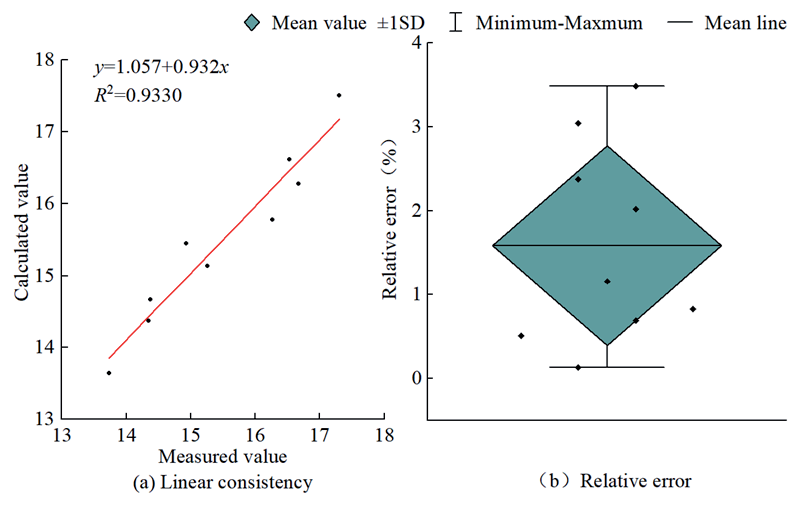
Table 1 shows the K (T, W) parameters of the degradation hydrothermal coupling model, and Fig. 4 shows the simulation effect of K (T, W). As can be seen from Table 1, the determination coefficient R2 of K (T, W) was 0.927, which had a high fitting accuracy. As can be seen from Fig. 4a), degradation rate data samples were evenly distributed on both sides of the line, and the determination coefficient of the linear model formed by measured samples and calculated samples was 0.933, indicating that the predicted value of this model had a high degree of linear consistency with the measured value. It can also be seen from Fig. 4b) that the relative error of the model ranges from 0.13% to 3.48%, and the average relative error was 1.58%. The error between the calculated value and the measured value was small.
Influence of Different Hydrothermal Conditions on Infrared Spectra of Membrane Materials
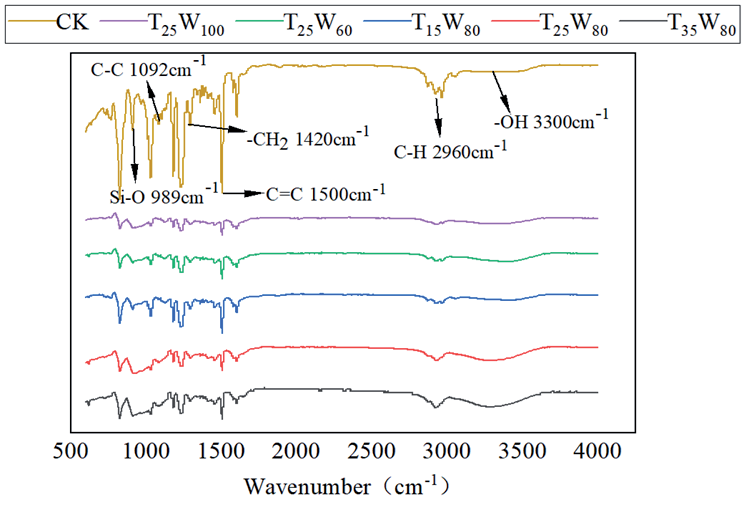
Fig. 5 shows the infrared spectra of different soils before membrane material degradation (CK) and after hydrothermal degradation. As can be seen from Fig. 5, the characteristic absorption peaks of the spectrum were mainly divided into two bands: 800~1500 cm-1 and 3000~3500 cm-1. In the band of 800-1500 cm-1, a narrow and strong absorption peak appeared in the characteristic region, and most of them presented a stepped-like pattern. In the band of 3000-3500 cm-1, a strong and broad absorption peak appeared.The comparison of CK spectrum lines with the spectrum lines of membrane materials after degradation under different hydrothermal conditions showed that the positions of the maximum absorption peaks before and after degradation of membrane materials were basically the same, but the peak intensity of the same peak position had changed strongly, which indicated that the number of functional groups and the type of chemical bonds had changed after degradation of membrane materials, and a significant degradation phenomenon had occurred. The typical characteristic peaks of membrane materials before degradation include the -OH stretching vibration absorption peak near 3300cm-1 [20], the C=C absorption peak at 1500 cm-1, the -CH2 bond bending vibration peak at 1420 cm-1, the C-C skeleton vibration absorption peak at 1092 cm-1, and the C-H stretching vibration peak at 2960 cm-1 [21]. Si-O stretching vibrations peak at 989 cm-1 [22]. Fig. 5 also showed that after membrane material degradation, the absorption peak of -OH stretching vibration became wider and stronger, while the absorption peak of C-H, -CH2, and Si-O becomes stronger and weaker, and the peak of the C=C absorption peak appeared as a continuous step, indicating that the material structure of membrane materials changes and degradation occurs. When comparing T15W80, T25W80, and T35W80 spectrum lines, it can be seen that the absorption peak strength of -OH and C-H stretching vibration gradually increased with increasing temperature, indicating that when soil moisture is constant, the higher the temperature, the higher the degradation degree of membrane material. When comparing T25W60, T25W80, and T25W100 spectral lines, it can be seen that as the water content increases, the intensity of the C=C and Si-O absorption peaks decreases, indicating that the higher the soil temperature, the greater the degradation degree of the membrane materials.
The Effect of Different Hydrothermal Conditions on Membrane Micromorphology before and after Degradation
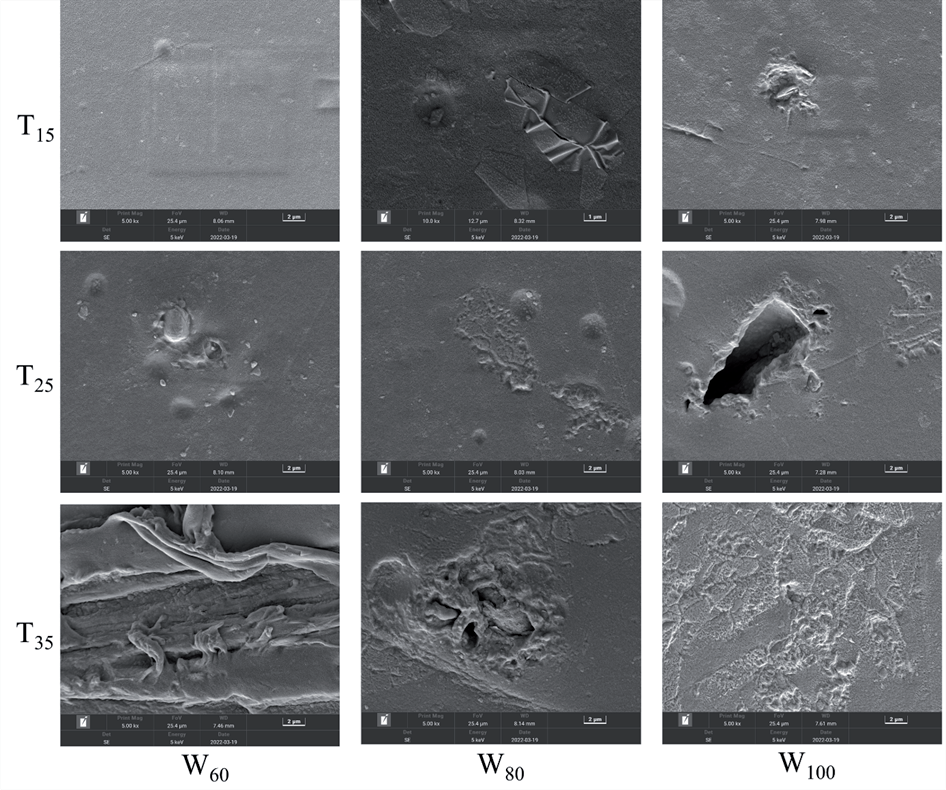
Fig. 6 shows the SEM images of membrane degradation under different soil hydrothermal conditions. As can be seen from Fig. 6, after the membrane material was embedded in the soil with different temperatures and moisture, the microscopic morphology changed to a great extent, with holes and cracks of different degrees appearing. It can also be seen from Fig. 6 that the surface treated by T15W60 was rough and raised, while the surfaces treated by T15W80 and T15W100 showed large cracks and holes. It shows that the increase in moisture at the same temperature will increase the degradation degree of membrane material. The T15W80 treatment has small holes and cracks, and the holes on the surface of the T25W80 and T35W80 treatments gradually increase, and the internal structure is damaged, indicating that, under the same moisture conditions, increasing the temperature will greatly increase the degradation degree of the membrane material. Huge cracks appear on the surface of T35W60, T35W80, and T35W100 treatments, with the T35W100 treatment having the most obvious cracks, and the surface has festered. This could be related to microbial activity in the soil, as microbial activity is highest under T35W100 conditions and membrane material degradation is strongest.
Disscussion
Biodegradable coating materials are environmentally friendly and pollution-free and can be degraded under natural conditions, which has gradually become the development trend of slow and controlled-release fertilizer coating materials [23-25]. The degradation of composite membrane materials depends largely on their composition and structure, and the essence of their degradation is the breaking of chemical bonds [26]. The polyvinyl alcohol chain structure contains a large number of hydroxyl groups, and the degradation of the hydroxyl group by microorganisms occurs in two ways [27]: one is to oxidize PVA through secondary alcohol oxidase, so that two adjacent hydroxyl groups of PVA form an ß-dione structure; the other is to oxidize one hydroxyl group of PVA to form an ß-hydroxyl one. PVP had good binding with PVA. There are highly polar amide groups in the pyrrolidone ring, non-polar methylene and methane groups in the ring and main chain, and the end of the molecule is terminated by hydroxyl [28]. The infrared spectra of the composite membrane materials showed typical functional groups and absorption peaks, and the peak strength of the functional groups changed significantly before and after degradation, which indicated that the chemical bonds in the membrane materials were broken and the membrane materials were degraded.
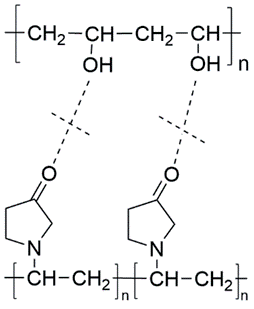
The degradation process of composite membranes prepared from different raw materials in soil was quite different. The degradation degree of composite membrane was found to be the highest when the temperature was 35ºC and the moisture content was 0.226 g/g, and the degradation rate reached 17.3% after 80 days of embedding. The degradation rate of polybutanediol succinate (PBS) modified cellulose acetate (CA) composite membrane prepared by Ghaffarian was about 12% after 80 days of burial at 30ºC [29]. After 80 days of burial at room temperature, the degradation rate of titanium dioxide (TiO2), modified polyvinyl alcohol (PVA), and polylactic acid (PLA) composite membranes was approximately 33% [30]. Song prepared biodegradable materials with phosphorus-containing polybutylene succinate (P-PBS) and polylactic acid (PLA) as raw materials, and the degradation rate of the materials was about 19% in 90 days under the conditions of 24ºC buried soil temperature and 12 hours of light [31]. Table 2 shows the approximate degradation rates of four different composite membranes over time. As shown in Table 2, the degradation rates of composite membranes prepared from various raw materials vary greatly. The membrane materials prepared by predecessors conform to the trend of logarithmic type in the degradation process [29, 30], while the membrane materials in this paper conform to the S-shaped curve in the degradation process. PVA, PVP, and PLA contain hydrophilic groups such as -OH, -COOH, and lactam, which were easily affected by soil moisture during the degradation process [30, 32], whereas PBS was relatively hydrophobic and might be greatly affected by soil temperature [29], and the PBS modified by phenyl phosphoric acid further decreases the crystallinity and increases the polarity, and its degradation performance also changed greatly [31]. According to research, the polymer degraded quickly when the polymer’s covalent bond was broken [33]. The covalent bond formed by PVA and PLA will form oligomers after ester cleavage, and oligomer formation is conducive to rapid degradation [30]. After combining PVA and PVP, hydrogen bonds were formed inside the molecule, and the presence of intermolecular hydrogen bonds caused the membrane material to be tightly bonded inside, resulting in a slow degradation rate of the membrane material during the initial embedding stage. With the extension of embedding time, the continuous action of temperature and soil enzymes will hydrolyze the hydrogen bond, accelerating the degradation rate of membrane materials (Fig. 7). The degradation of polymers in soils is influenced not only by temperature, moisture, and the number and type of microorganisms, but also by abiotic conditions such as light [34]. Light degradation was an important step in the polymer degradation process. When a polymer absorbs a series of light rays, the internal chemical bond is broken [35], and the electrons within the molecule are excited to a higher energy level after absorbing high-energy radiation, resulting in polymer oxidation and hydrolysis [36, 37]. In this paper, there was no influence of natural light in the degradation process of membrane materials, and the membrane materials prepared by Song were accompanied by 12 h of light during the degradation process [31]. In previous experiments, if the membrane materials were buried in shallow soil, there might be the influence of light [29, 30], which also causes the differentiation and degradation of membrane materials. pH also had a great impact on the degradation of materials. Jiang put the PO3G-PA/PLLA composite membrane into three buffers with different pH values and measured its degradation performance at 60ºC [38]. The results showed that the degradation rate of the membrane was faster in an alkaline environment. In this paper, natural soil with a pH of 8.43 was used for all treatments to better simulate the degradation law of materials in their natural state.
Table 2.
Approximate degradation rate of different composite membranes under specific time.
| Time | 30 | 40 | 60 | 80 |
|---|---|---|---|---|
| PVA/PVP/zeolite PBS/CA PVA/PLA/ TiO2 P-PBS/PLA | 0.97% 2.3% 12.4% 4.8% | 1.75% 4.1% 23.4% 7.1% | 11.53% 9.4% 28.7% 12.5% | 17.3% 12.1% 33.1% 18.2% |
The degradation degree of membrane materials will be affected by soil temperature, moisture, and the number and type of microorganisms. The results showed that the degradation rate of membrane material in T35W100 soil was optimal. Zhao [39] discovered that when the soil temperature was 35ºC and the water content was 0.25 g/g, the membrane degradation rate was the fastest. The optimal degradation temperature was the same as described in this paper, but the optimal degradation water was slightly higher. According to the findings of Tian’s research [40], the degradation rate of the seaweed polysaccharide membrane was greatest when the soil temperature was 25ºC, and the optimal degradation temperature obtained in this study was lower than that in this paper. The reasons for the above differences may be the different structure and composition of the membrane material and the different growth responses of soil microorganisms to temperature. The membrane structure of Zhao [39] was mainly starch and polyvinyl alcohol, while that of Tian [40] was a linear block copolymer composed of seaweed polysaccharides. In this paper, the structure of the composite membrane is a three-dimensional copolymer structure of PVA and PVP chemical crosslinking and zeolite physical blending. The different composition and structure of the composite membrane will lead to a difference in its crosslinking density, which consequently leads to a difference in its degradation. A large number of studies have proved that soil microorganisms play an important role in the degradation of organic materials [41-44]. The membrane materials of Zhao [39] and this article are mainly PVA, and the dominant degrading strain is PVA-degrading bacteria, while the membrane material of Tian [40] is mainly seaweed polysaccharide, and the dominant degrading strain is seaweed polysaccharide-degrading bacteria. Previous studies showed that the optimum growth temperature of the PVA-degrading strain Pseudomonas XT11 was 30ºC [45]. The optimum growth temperature of polysaccharides degrading strain L206 was 25ºC [46], and the optimum growth temperature of the PVA degrading strain was significantly higher than that of the Pseudomonas Pachastrellae degrading strain. The different optimum growth temperatures of the degrading strain resulted in the differentiation of the degradation conditions of membrane materials.
Conclusions
(1) The degradation degree in the membrane material showed a positive response to the increase in temperature and moisture. Soil moisture and temperature on membrane materials had a significant influence on the degradation rate (p˂0.01), but the interaction effect on the degradation of membrane material was not significant (p>0.05).
(2) The K (T, W) determination coefficient R2 of the hydrothermal coupling model reached 0.927, and the average relative error of linear fitting was 1.58%, which indicated that the model fitting effect was good.
(3) The infrared spectrum showed that the absorption peak of the -OH stretching vibration became wider and stronger after degradation, while the absorption peak of C-H, -CH2, and Si-O became weaker, and the peak of the C=C absorption peak appeared as a continuous step after degradation. SEM electron microscopy showed that there were different degrees of degradation in each treatment, and the degradation of T35W100 was the highest.

