

Introduction
Maize is one of the most important materials in people’s daily life. It has unique reprocessing value and nutritional value. It is also the plant with the largest planting area in the world [1]. In China, the planting area of maize crops ranks third among all kinds of plants, second only to rice and wheat. The output will reach 260.77 million tons in 2019. Maize crops have the characteristics of a short growth cycle and need to obtain a large amount of water and nutrients during the growth and development period. In order to promote the efficient production of maize crops, the production should be guided according to the law of water and fertilizer demand, that is, precision irrigation and fertilization. The premise of realizing precision irrigation and fertilization is to quickly obtain the nutritional status of maize crops as a reference [2].
The identification of nutritional status of maize crops is to accurately judge the nutritional status of maize crops through a series of indicators related to the nutritional status of maize crops and the relationship between indicators. The identification process has high-dimensional and nonlinear characteristics [3]. It is suitable to establish a model with the help of Artificial Neural Network (ANN), to deal with the comprehensive identification of multi index systems. At present, ANN has been widely used in the identification and evaluation of lake and reservoir nutritional status. However, there are two deficiencies in the previous process of maize crop’s nutritional status identification: one is that the different weights of maize crop’s nutritional status identification indexes are not considered; secondly, the nutritional status of maize crops in China is only divided into five levels of poor nutrition to severe eutrophication, which is relatively rough. As a result, in practical application, there is a large pollution difference between the nutritional identification indexes of maize crops identified as the same level, which cannot objectively and truly reflect the nutritional status of maize crops with serious nutritional deficiency.
At present, the weight calculation methods are mainly divided into the subjective weighting method and the objective weighting method. The subjective weighting method includes the analytic hierarchy process used by Lee and Kim et al. in calculating the risk factor weight of the aircraft hangar’s fire extinguishing system [4], and the least square method used by Maihemuti et al. in calculating the voltage safe operation area [5]. The results of this kind of method depend on the experience and preference of the evaluator. This kind of method has some defects, such as insufficient theoretical arguments and great subjective randomness. Objective weighting methods include the envelope analysis method used by Dahooie et al. in the study of dynamic credit risk assessment method and the principal component analysis method used by Li et al. in the study of landslide prediction [6, 7]. The results of this kind of weighting methods depend on the information of the object to be assessed, and the weight determined by this kind of methods sometimes contradicts the actual importance of the index. Therefore, the optimal combination weighting method of comprehensive optimization of subjective weight and objective weight has emerged, and some research results have been achieved. But this kind of method is not perfect at present. Information evidence fusion can reduce the uncertainty of information, and it has been widely used in the field of evaluation.
Probabilistic Neural Networks (PNN) are a feedforward neural network [8], which is equivalent to the optimal Bayes classifier in classification function. It is a neural network with the ability of probability density classification estimation and parallel processing.
In addition to the characteristics of general neural networks, it also possesses the advantages of fast convergence speed, strong generalization ability and difficulty to converge to local extremum. It is widely used in pattern recognition and classification.
In view of the above reasons, based on the optimal combination weighting method and the basic principle of PNN, the identification method of maize crop’s nutritional status based on index weight is studied. The optimal combination weighting method is used to assign the weight of identification index of maize crop’s nutritional status; according to the nutritional evaluation standard of maize crops in China, the nutritional status of maize crops is divided into nine grades: extremely poor nutrition to extremely severe eutrophication, and the improved nutritional status identification grade standard of maize crops is put forward; the random interpolation method is used to generate training samples and test samples between the values of the hierarchical domain. The samples are input into the probabilistic neural network for training, and the performance of the probabilistic neural network recognition model is identified by using the correct recognition rate and running time; after the model reaches the expected recognition accuracy and generalization ability, the method is verified by taking the nutritional status recognition of maize crop samples as an example.
Materials and Methods
Construction of Identification Index System
Based on the successful experience of the identification index system of crop nutritional status at home and abroad, combined with the planting characteristics of maize crops [9], the internal and external methods are used to screen the identification indexes, and a total of 56 evaluation indexes are collected. In order to make the analysis simple, effective, scientific and reasonable, the importance evaluation indexes with typical representative significance are selected as the analysis object, and an identification index system of maize crop’s nutrition status composed of 3 layers, 5 systems and 15 specific indexes is established (Table 1). Among them, for the nutritional status of corn crops, the most important one is “B3-Grain nutrition” because this group of content is related to the actual nutritional value of corn. Directly related. The nutritional status of corn is affected by the supply of nutrients (such as nitrogen, phosphorus, potassium, etc.) in the soil, as well as the growth and development of the corn plant itself. Therefore, ensuring that corn crops receive adequate nutrients is critical for their healthy growth and production of high-quality grain [10].
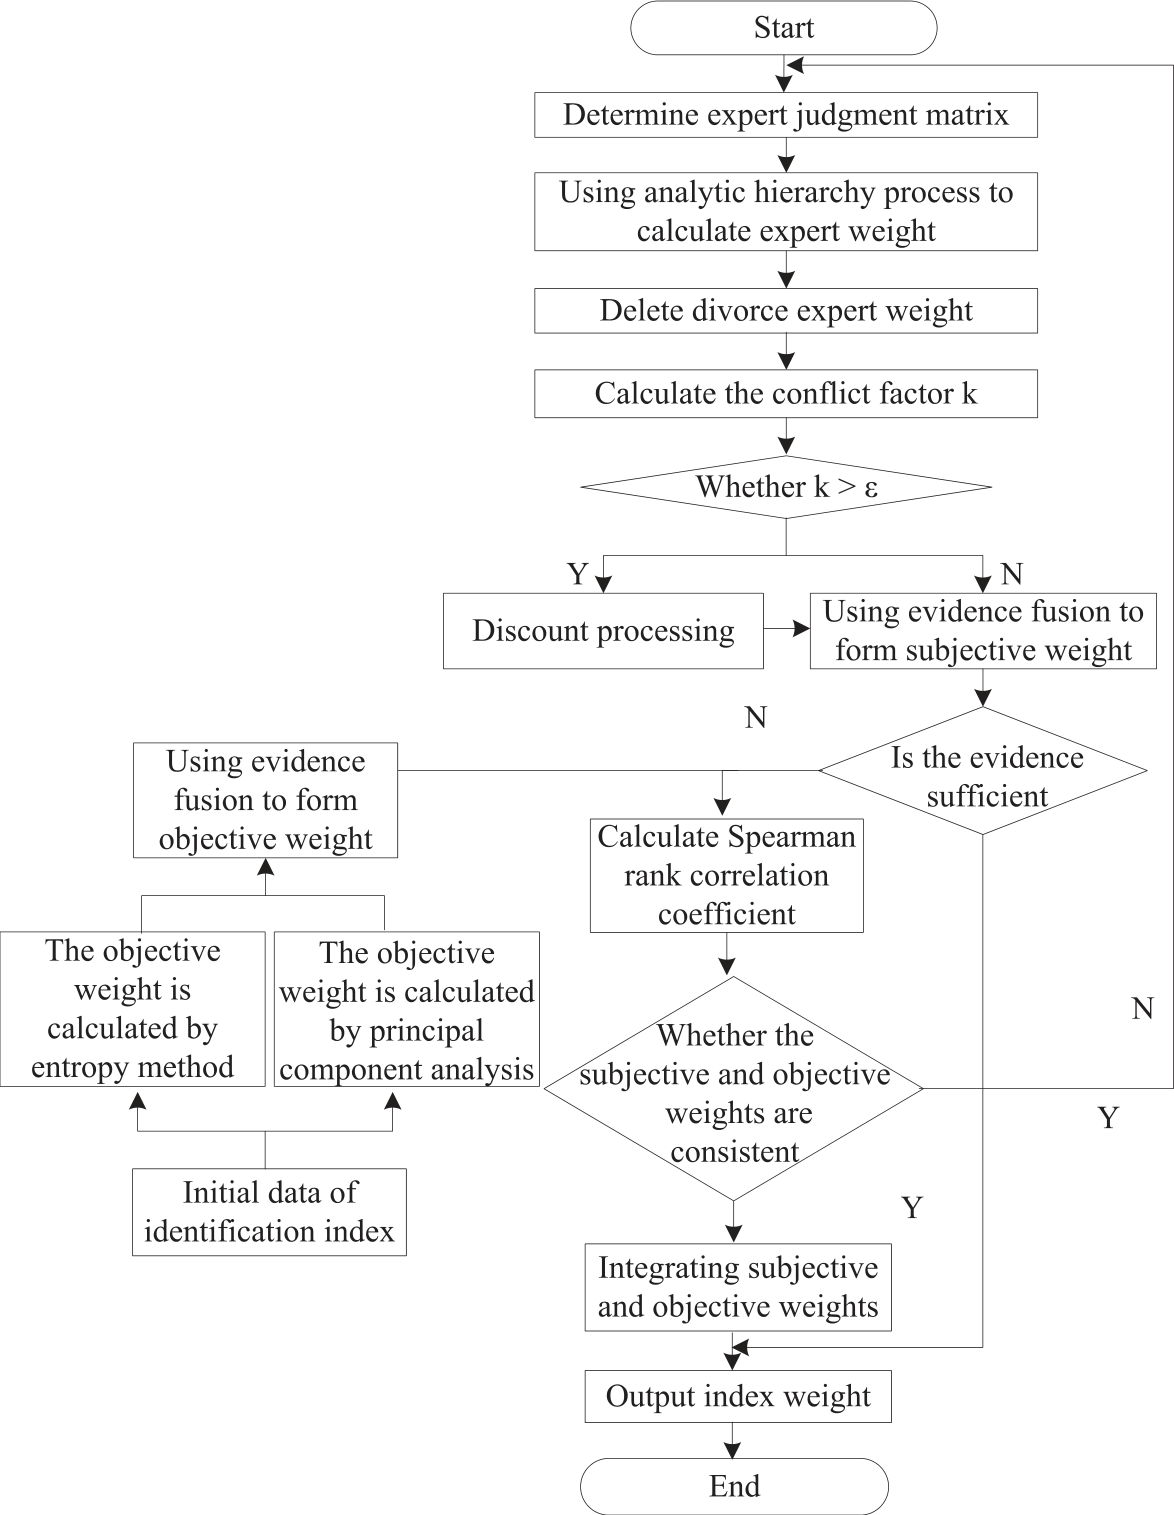
Based on the identification index system of maize crop’s nutrition status shown in Table 1, the identification index weight is calculated by using the optimal combination weighting method.
Table 1.
Identification index system of nutritional status of maize crops.
Weight Calculation of Identification Index
Subjective Weight Calculation
The subjective weight is calculated as follows:
A. Identify the identification framework. After the evaluation index system is determined, all primary indicators or all secondary indicators of a primary indicator are used as an identification framework [11].
B. Determine the expert judgment matrix. Assuming that m experts are invited to evaluate the weights of n indicators, a m×n dimensional expert judgment matrix w can be formed. wij is the element in w, 1≤i≤m, 1≤i≤n.
C. Eliminate divorce expert opinions. Factors such as cognitive bias or incomplete information may cause inconsistent weights determined by experts. However, if the weights determined by experts are very different, it indicates that there is a problem with weighting and it is not suitable for fusion [12]. In order to ensure the rationality of the weight fusion results, the similarity between the weights determined by experts should be calculated, and the expert weights with a large degree of divorce should be excluded [13].
The similarity coefficient is defined as:
In Equation (1), Rij represents the similarity of the weights determined by expert i and expert j. After Rij is determined, the similar system matrix R can be obtained [14].
n
The ∑=j 1 Rij value is set as pi, and the smaller the pi value is, the farther the expert i opinion is from the other expert opinion, and the greater the deviation degree is. The divorce degree of the judgment result of the i-th expert is defined as:
In Equation (2), pimax represents the maximum value of pi.
D. Evidence fusion. After eliminating the divorced expert opinions, the weight determined by other experts is fused by using the evidence fusion theory to avoid the one sidedness of expert opinions [15].
E. To judge whether the evidence is sufficient. The above fusion results are judged according to the sufficient definition of evidence. If the evidence is sufficient, the weight results will be obtained directly, otherwise it needs to be fused with the objective weight [16].
Objective Weight Calculation
The objective weight calculation method is as follows:
A. The original matrix of index data is obtained according to the index system.
B. The weight of each index is calculated by the entropy method to form the entropy weight matrix W1.
C. The weight of each index is calculated by principal component analysis to form a principal component weight matrix W2.
D. Evidence fusion. Using the evidence fusion theory, W1 and W2 are fused to obtain the comprehensive objective weight.
Closed Loop Adjustment
The weights of subjective and objective indicators are obtained from different angles, and the results may be different, but for the same indicator, the two results should not be too different. In this paper, Spearman rank correlation coefficient is used to test the consistency of subjective and objective weights [17].
Spearman rank correlation coefficient is:
In Equation (3), diz and dik represent the weight ranking of index i in subjective and objective weights respectively [18].
Given the significance level α of Spearman’s rank correlation coefficient, the critical value cα can be found. If r>cα, the subjective and objective weights have positive correlation and meet the consistency requirements; otherwise, the subjective and objective weights are inconsistent [19].
When the subjective and objective weights are inconsistent, the subjective weight needs to be recalculated, that is, the subjective weight needs to be adjusted in a closed loop. The adjustment principle is: since the divorce degree Di reflects the deviation degree between the expert opinion and the subjective weight results, when the subjective weight does not meet the requirements, the expert with the smallest deviation degree from the subjective weight does not meet the requirements [20]. Therefore, it should first select the expert with the smallest deviation degree, re determine the expert weight, re assign the expert judgment matrix of the weight of the index to be evaluated, and calculate the Spearman rank correlation coefficient of the subjective and objective weights until the subjective and objective weights meet the requirements of positive correlation. So far, the closed-loop adjustment of the weight is realized [21].
Fusion of Subjective and Objective Weights
Using the evidence fusion theory, the above verified consistent subjective and objective weights are fused, and finally the index weights that meet the requirements can be obtained [22]. The detailed flow of the algorithm is shown in Fig. 1.
After determining the weight of identification index of maize crop’s nutritional status based on the process shown in Fig. 1, according to the evaluation standard of crop nutrition in China, the nutritional status of maize crop is divided into 9 grades of extremely poor nutrition - extremely severe eutrophication, and the improved identification grade standard of maize crop’s nutritional status is proposed, as shown in Table 2. The random interpolation method is used to generate samples between the level standard domain values, and the samples are input into the probabilistic neural network to identify the nutritional status of maize crops [23].
Probabilistic Neural Network
Probabilistic neural network is a 4-layer feedforward neural network based on radial basis function neural network. Its essence is a parallel algorithm developed based on Bayesian minimum risk criterion [24]. The main idea is to separate the decision space in multi-dimensional input space by using Bayesian decision criterion. Because it uses the Parzen window of Gaussian kernel to estimate the posterior probability of samples to realize Bayesian classification, when training the network, the network directly stores the training samples as the sample vector of the network without any modification, and only needs to empirically estimate the smoothing factor of the transfer function, so it has the advantages of simple structure and fast training speed. It is often used to solve the problem of pattern classification.
Table 2.
Improved identification grade standard of maize crop’s nutritional status.
Probabilistic neural network is composed of input layer, radial base layer (hidden layer) and competition layer (output layer). The competitive layer uses the competitive output instead of the traditional linear output. Each neuron sums and estimates the probability of various types according to the Parzen algorithm, and competes for the response opportunity of the input model. Finally, only one neuron wins the competition, and the winning neuron represents the classification of the input mode [25]. Mathematically, the structural rationality of probabilistic neural network can be proved by Cover theorem, that is, for a pattern problem, it can be solved in high-dimensional data space and difficult to solve in low-dimensional space [26]. The dimension of radial base space is directly related to the network performance. The higher the dimension is, the higher the approximation accuracy of the network is, but the more complex the network is. The steps of realizing pattern classification by probabilistic neural network are summarized as follows:
Determine the radial basis function center of hidden layer neurons. Let the training sample input matrix P and output matrix T be respectively:
Where: pij is the i-th input variable of the j-th training sample, and tij is the i-th output variable of the j-th training sample; R is the dimension of the input variable; K is the dimension of the output variable, corresponding to K categories; Q is the number of training samples. Each neuron of the hidden layer corresponds to a training sample, that is, the radial basis function centers corresponding to Q hidden layer neurons are:
Determine the neuron threshold in the hidden layer [27]. The thresholds corresponding to Q hidden layer neurons are:
In Equation (6),
Determine the weights of hidden layer and output layer [28]. When the radial basis function center and threshold of hidden layer neurons are determined, the output of hidden layer neurons can be calculated by the following formula:
In Equation (7): pi is the i-th training sample vector. The connection weight W between the hidden layer and the output layer is the output matrix of the training set, that is:
Output layer neuron output calculation. When the connection weight between the hidden layer and the output layer neuron is determined, the output of the output layer neuron can be calculated, that is:
Identification Process of Maize Crop's Nutrition Status
Based on the construction of the identification index system, calculation of identification index weight, weight calculation and construction process of the probabilistic neural network in above, the detailed process of maize crop’s nutritional status identification is shown in Fig. 2 [29].
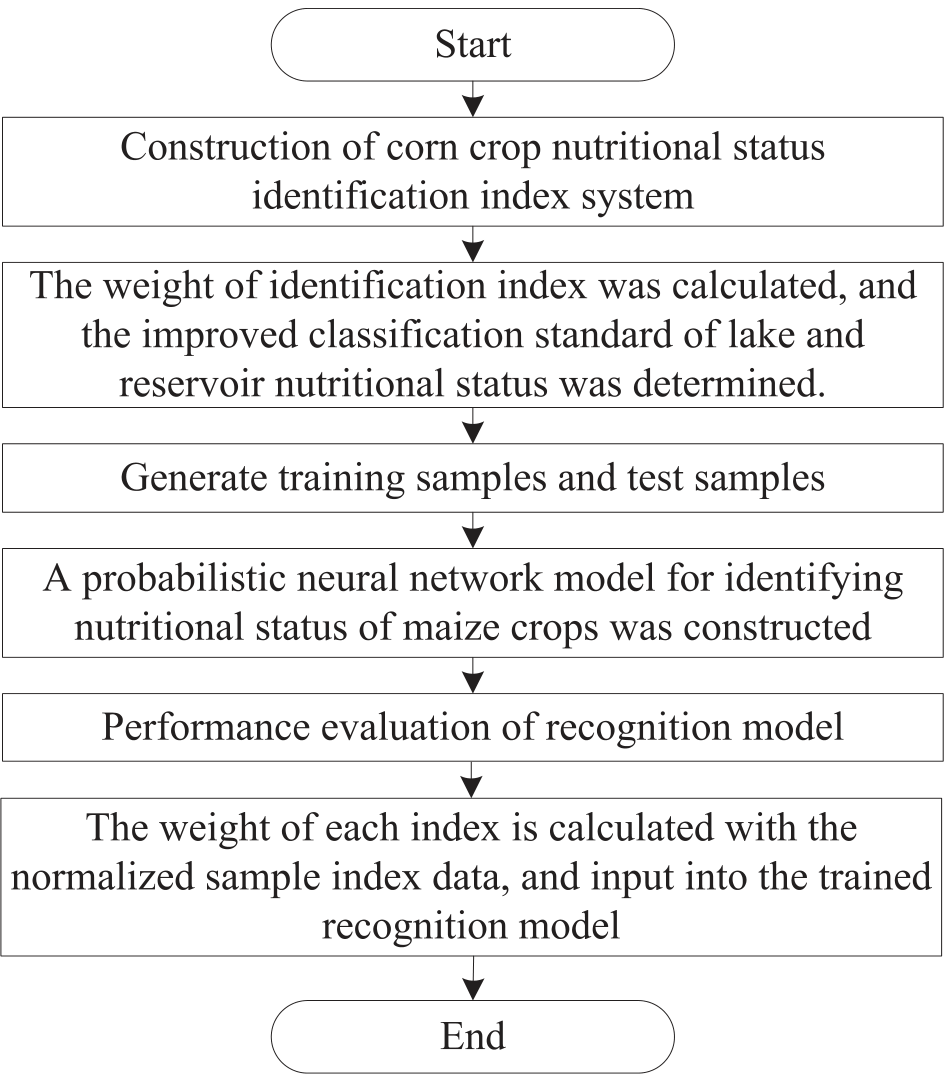
A. Based on the successful experience of the identification index system of crop’s nutritional status at home and abroad, the identification index system of maize crop’s nutritional status is constructed in combination with the planting characteristics of maize crops.
B. The optimal combination weighting method is used to calculate the weight of identification indexes, and the improved classification standard of lake and reservoir nutritional status is determined. According to relevant national standards, the nutritional status of maize crops is divided into 9 levels, and each state level is described in appropriate language on the basis of the original standard.
C. Generating training samples and test samples. The random interpolation method is used to generate a certain volume of samples between the grading standard thresholds of lake and reservoir nutritional status. 3/5 of the total sample is selected as the training sample and the remaining samples are used as the test sample. The generated samples are normalized, and a reasonable network output mode is designed [30].
D. Building recognition model. Based on MATLAB environment, an identification model of the maize crop’s nutritional status based on a probabilistic neural network is constructed. The randomly generated samples are used to train and test the model to determine the best spread value of radial basis function expansion coefficient.
E. Performance evaluation of identification model. The model runs N times randomly, and two indexes of correct recognition rate and running time are selected to evaluate the recognition accuracy, generalization ability, convergence speed and stability of the model, so as to obtain the recognition model architecture that meets the accuracy requirements.
F. Example application and result analysis. Using the index weights obtained in step B and the normalized sample index data for matrix calculation, the input matrix considering the index weight is obtained, which is input into the trained recognition model to obtain the recognition results of nutritional status of maize crop samples.
Results
This paper studies the identification method of maize crop’s nutritional status based on index weight. In order to verify the effectiveness of the identification method studied in this paper, 8 corn crops are randomly selected as the evaluation and identification objects in a municipal agricultural crop research institute [31]. The proposed method is used to identify the nutritional status of each identification object. The results are as follows.
Calculation of Index Weight
In order to verify the performance of the identification method in this paper for the weight calculation of identification indicators, five experts are selected to calculate the subjective weight of the identification indicators shown in Table 1 and determine the deviation degree of each expert’s weight. Fig. 3 shows the calculation results of the deviation degree between the subjective weight calculation of each primary indicator and the expert’s weight.
It can be seen from Fig. 3 that the deviation degree of all expert weights is less than 10%, so there is no need to eliminate any expert opinions. If there are divorce expert opinions, the opinions shall be eliminated before evidence fusion.
The fusion results and conflict factors of subjective weights of primary indicators are shown in Fig. 4, where mi is the fusion result of subjective weights of the top i experts.
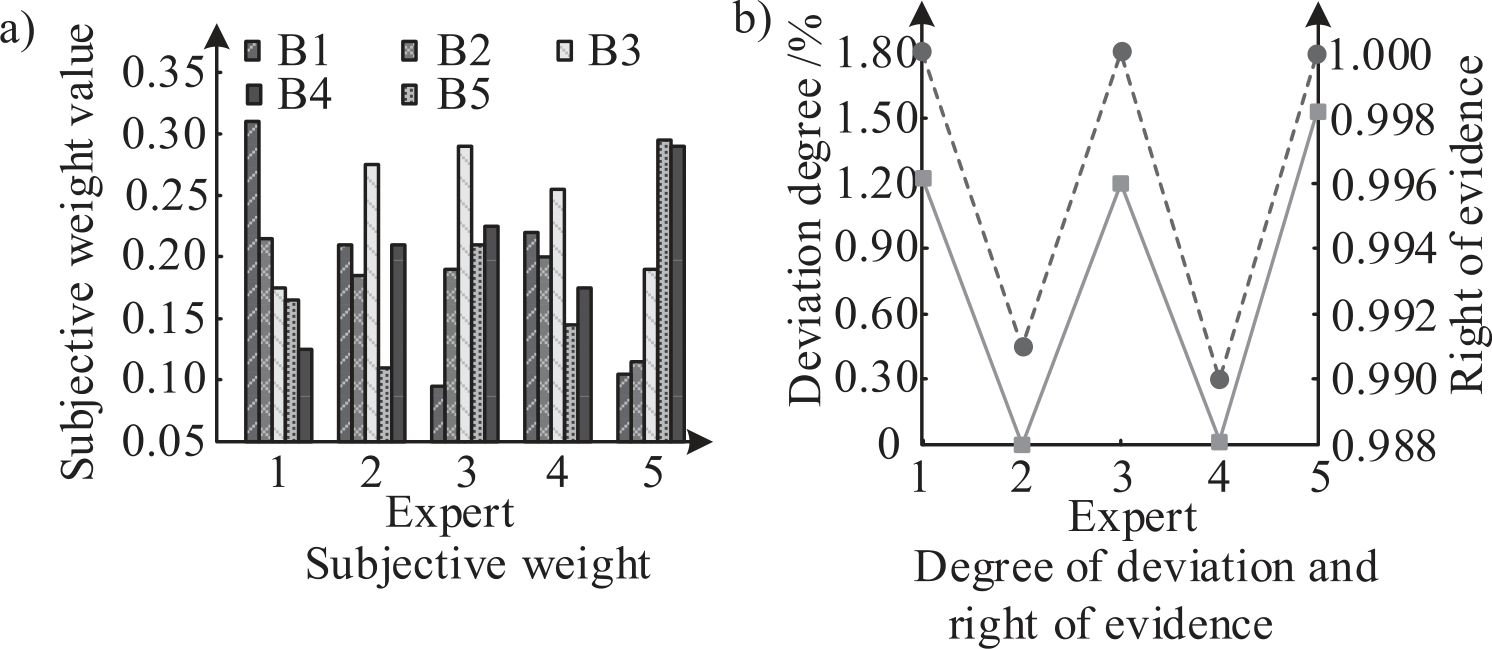
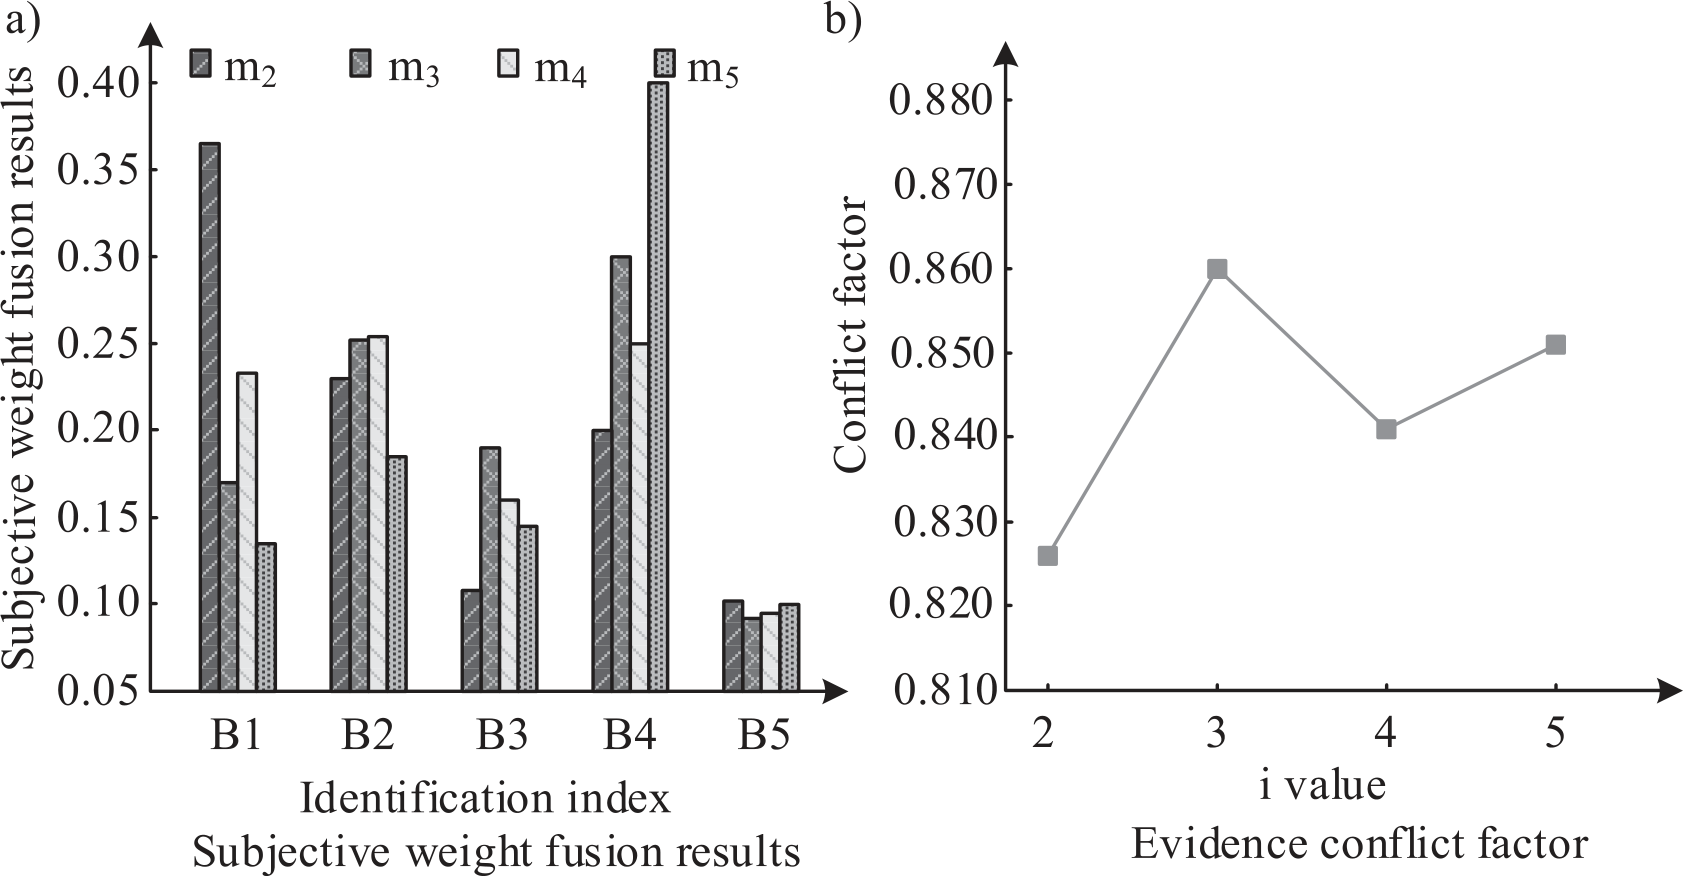
It can be seen from Fig. 4a) that when the second expert opinion is fused, the conflict factor is 0.8261>0.7, indicating that the expert opinion is not completely reliable evidence and needs to be discounted. It can be seen from Fig. 3 that the evidence weight of the second expert opinion is 0.9911, and the uncertainty probability of the information after the transformation of the basic reliability distribution function is 1-0.9911 = 0.0089. However, it should be noted that not all evidence that the conflict factor is greater than the threshold is unreliable. For example, when the third expert opinion is integrated, the conflict factor is 0.8608>0.7. However, since the evidence weight of the third expert opinion is 1, it indicates that the conflict is caused by the deviation of the second expert opinion, so it does not need to be discounted. Similarly, the fusion of the opinions of the 4th and 5th experts is completed in turn to obtain the subjective weight of the primary index. Because the primary index in this paper belongs to the index that cannot obtain the original data type, and the subjective weight meets the sufficient evidence conditions, the subjective weight is the final primary index weight result. Fig. 3 and Fig. 4 show that after removing the expert opinions with a large degree of divorce and discounting the uncertain opinions, the comprehensive weight after the fusion of expert weight evidence is more reliable than that of a single expert. At the same time, it can also be seen from Fig. 4 that the weight of crop productivity is the highest among all primary indicators, which is the main identification index to identify the nutritional status of corn crops.
Training Set Test Based on Probabilistic Neural Network Model
Based on MATLAB environment, the algorithm program is written to train and test the samples designed in Table 2. After debugging, the probabilistic neural network recognition model has a good recognition effect when the radial basis function expansion coefficient spread is 0.01. Since the training samples and test samples are generated by random interpolation, the results of each run of the model are different. The results of five random runs are excerpted, as shown in Table 3.
The following conclusions can be drawn from Table 3: A. Whether it is training samples or test samples, the overall correct recognition rate of the probabilistic neural network recognition model in this method is more than 95% and the running time of the model is less than 3s. It shows that the probabilistic neural network recognition model established by the proposed method has the characteristics of high recognition accuracy, strong generalization ability and fast convergence speed, it is reasonable and feasible to identify the nutritional status of maize crops.
Table 3.
Probabilistic neural network recognition model training and sample recognition results.
B. In terms of the grade recognition rate of extreme poor nutrition to extreme severe eutrophication, the recognition rate of training samples and test samples of mesonutrition is relatively low, with an average of 90%~100% and 92.5%~100% respectively for five times. The correct recognition rate of other grades is higher than that of mesonutrition, indicating that the probabilistic neural network recognition model used in this method has good stability. Based on 5 times of random operation, the overall and all levels are unclear, and the fluctuation of recognition rate is small, which meets the needs of practical application.
Discussion
This paper studies the identification method of maize crop’s nutritional status based on index weight. On the basis of determining the identification index weight by optimizing the combination weighting method, the probabilistic neural network identification model is used to identify the nutritional status of maize crop samples. The recognition results show that the comprehensive weight after the fusion of expert weight evidence by the proposed method is more reliable than a single expert weight, and the probabilistic neural network recognition model has good stability. The study conducted a simulation test of their algorithm in the literature [32] and verified that it was used to identify the nutritional status of corn crops and found that there was no significant difference in the results obtained using the method proposed in the study and the method proposed in the literature. It is reasonable and feasible because the optimal combination weighting method used in this method is a combination evaluation method that combines subjective evaluation and objective calculation. This is because the optimal combination weighting method used in the proposed method is a combination evaluation method that combines both subjective evaluation and objective calculation. It is widely used in sensitive industries such as finance, chemical industry and coal mining. This method can take into account the combination weighting method of subjective and objective weighting results at the same time. It not only combines the advantages of the two weighting methods, but also can prevent the single weighting method from being affected by its own limitations and the bias of the results. At the same time, the probabilistic neural network model used in the proposed method, as a common classification algorithm, uses the neural network structure to realize the Parzen estimation process. Probabilistic neural network model also uses probability distribution to classify query sample data, but it is an unsupervised learning model, so it is not necessary to estimate the probability distribution in advance; In addition, the probabilistic neural network model considers not only positive samples but also negative samples. The model has the advantages of simple structure and fast training speed, so it can improve the accuracy of recognition results.
Conclusion
This paper studies the identification method of maize crop’s nutritional status based on index weight, and puts forward the closed-loop calculation method of identification index weight based on evidence fusion theory, which overcomes the defects of using subjective weighting method and objective weighting method alone, realizes the combination of expert experience and objective theory, and ensures the reliability of fusion results. The experimental results verify the applicability of the proposed method.

