

Introduction
Floods and droughts occur more frequently with the increasing impact of climate change and human activities, and one response is the change of hydrological elements such as water and sand in the basin and transport processes. [1-3]. Poyang Lake is located to the south of the Yangtze River in northern Jiangxi Province, and is the destination for runoff from five major rivers including the Ganjiang, Xinjiang, Fei, Rao, and Xiu. Poyang Lake is the largest freshwater lake in China [4], is a regulator of Yangtze River water volume and downstream runoff, and has important ecological, political, and socio-economic functions [5]. Recently, the hydrological conditions of Poyang Lake have changed significantly due to the influence of global climate change and human activities [6]. The Ganjiang River is the input stream of Poyang Lake, and its water and sand variations affect the evolution of Poyang Lake. The study of water and sand variations in the Ganjiang River basin can provide guidance for comprehensive management of Ganjiang River and the Poyang Lake basin, as well as the protection and development of the Yangtze River basin [7].
The analysis of water and sand changes in the Ganjiang River basin and its influencing factors has received increasing attention. Huang [8] et al. used runoff data and precipitation data from three stations in the upper, middle, and lower reaches of the Ganjiang River from 1959-2016 to analyze runoff changes in the basin, showing that precipitation has a large impact on runoff, as well as human activities. Peng [9] et al. found that human engineering activities played a key role in water-sand changes in the Ganjiang River basin. Zhang Ying[10] et al. found that the concentration of runoff and sand transport, as well as their heterogeneity, have decreased year to year, with the main factors being reservoir construction, vegetation improvement, and artificial sand mining. Most of the runoff data studied have relatively short time scales or few hydrological stations involved. We here improve these analyses through consideration of the characteristics and influencing factors of water and sand changes in the upper, middle, and lower reaches of the Ganjiang River basin using continuous hydrological data from 1958 to 2019 from multiple stations, which is a significant improvement over previous studies.
We use hydro-meteorological data from 1958-2019 in the Ganjiang River basin to analyze variations of runoff and sand transport and their influencing factors, which may provide improved guidance for scientific management and planning of water resources in the basin. Our study focuses on: (1) The characteristics of runoff and sand transport changes in the Ganjiang River basin from 1958 to 2019; (2) The correlations between runoff and sand transport changes in the basin;
(3) The factors affecting water and sand changes in the basin.
Research Data and Methods
Overview of the Study Area
The Ganjiang River is located in the middle and lower reaches of the Yangtze River, mainly within Jiangxi Province, with a total length of 751 kilometers. The topography of the basin is elevated in the south and low in the north, with many mountainous hills and alluvial plains downstream (Fig. 1) [11, 12]. The watershed is characterized by four distinct seasons, ample light, abundant rainfall, a long frost-free period, and a humid subtropical climate [5]. The average multi-year temperature is around 18ºC, the average multi-year precipitation is 1400-1800 mm, and May to September is the flood season of the Ganjiang River basin. Since the 1980s, large-scale afforestation, and soil conservation measures have been carried out in the Ganjiang River basin , to protect the environment and control soil erosion, and several national key soil and water conservation projects have been implemented [13]. A large number of water conservancy engineering facilities have been built in the basin. By 2021, many various types of reservoirs have been built in the basin, including 18 large reservoirs, 123 medium-sized reservoirs, and 3828 small reservoirs [14].
The Ganjiang River flows through Ganzhou, Ji'an, Zhangshu, Nanchang, and other cities and counties. and is economically important to Jiangxi Province. Accelerated industrialization and urbanization has significantly impacted the water resources of the Ganjiang River basin [15]. A series of policies and regulations have been formulated and introduced in recent years to protect the environment of the basin, and ecological compensation has been actively carried out to strengthen the comprehensive ecological and environmental management of the Ganjiang River basin [16].
Data Sources
Hydrological data in the Ganjiang River basin from 1958 to 2019 were obtained from the Jiangxi Provincial Hydrological Monitoring Center, and the main stations are the Ji’an and Waizhou stations in the middle and lower reaches of the Ganjiang River, Bashang station in the upper reaches of Zhangshui, Xiashan station in Gongshui, Julongtan station in Taojiang and Hanlinqiao station in Pingjiang. Six hydrological stations cover the whole Ganjiang River basin, with locations shown in Fig. 1. The statistical values of multi-year average runoff and sand transport at each station are shown in Table 1. The meteorological data comes from the National Meteorological Science Data Center, which provides multi-year precipitation data from a total of 38 meteorological stations in the upper, middle, and lower reaches. The data on hydraulic engineering facilities come from Jiangxi Provincial Water Resources Department.
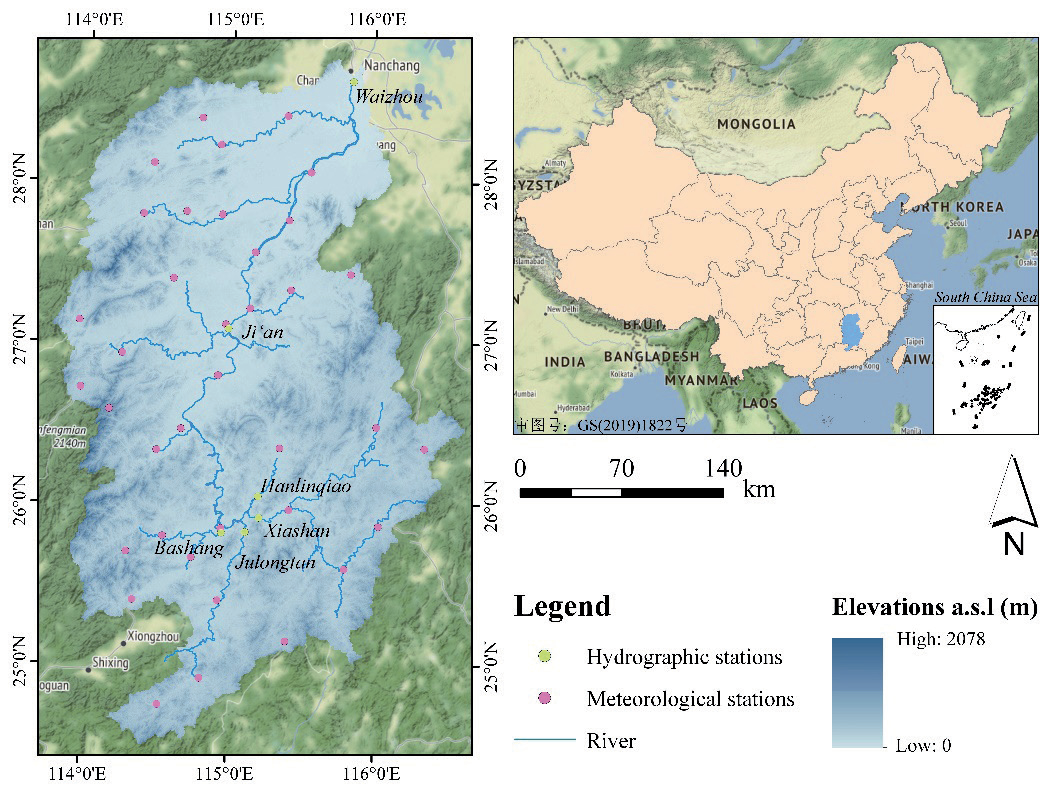
Table 1.
Multi-year averaged water and sand statistics from hydrological stations.
Research Methodology
Mann-Kendall Test
The Mann-Kendall test is used to determined tendencies of time-series data to increase, decrease or remain unchanged over time. This analysis method has a wide range of applications, high degree of quantification, and low human interference. We here used the Mann-Kendall test to analyze the changes in runoff volume and sand transport in the Ganjiang River basin from 1958 to 2019. The formula for the Mann-Kendall test is given in Ref [17].
For a time series x with n sample sizes:
The Sk is the cumulative count of the number of values at moment i which are greater than the number of values at moment j. taking the assumption of random independence of the time series:
where E(Sk), Var(Sk) are the mean and variance of the cumulative count Sk, which can be calculated with the following equation when x1, x2, …, xn are independent of each other and have the same continuous distribution:
where Ufk is a standard normal distribution, calculated by time series x order x1, x2, …, xn, given significance level α, if |Ufi|>Uα it indicates that there is a significant trend in the series.
If x is inverted (xn, xn-1, … , x1) , one can repeat the above process while making |UBk |= −UFk, k = n, n−1, …, 1, UB = 0. If UFk is greater than 0, it indicates an increasing time series, and less than 0 indicates a decrease. If they exceed the critical straight line, it indicates a significant increase or decrease. If the 2 curves, UFk and UBk have an intersection point between critical straight lines, then the moment corresponding to the intersection point is the moment when an abrupt variation occurs.
Sliding T-Test Method
If there is a significant increase or decrease in the runoff volume and sand transport before and after a certain year, we denote this a “sudden change point”. We apply the sliding t-test method to analyze sudden changes of runoff and sand transport in the Ganjiang River basin. The specific formula is shown in Ref [18].
Let the distribution functions of the overall two series before and after the variation point T be F1(x) and F2(x), respectively, and two samples of capacity n1 and n2 are taken from the overall F1(x) and F2(x) to construct the T-statistic as:
where x̅ 1, x̅ 2 are the sample means and s12, s22 are the sample variances. T obeys t(n1+n2−2). At a confidence level of α, when
Technical Route
The analysis of interannual variation in sand transport and runoff in the Ganjiang River basin includes gathering hydrological and meteorological data. The Mann-Kendall trend test is used for trend behavior analysis, along with the sliding t-test and Mann-Kendall mutation test to assess water and sand mutation. Human activities are also considered. The technical route is represented in Fig. 2.
Results and Analysis
Annual Runoff Characteristics
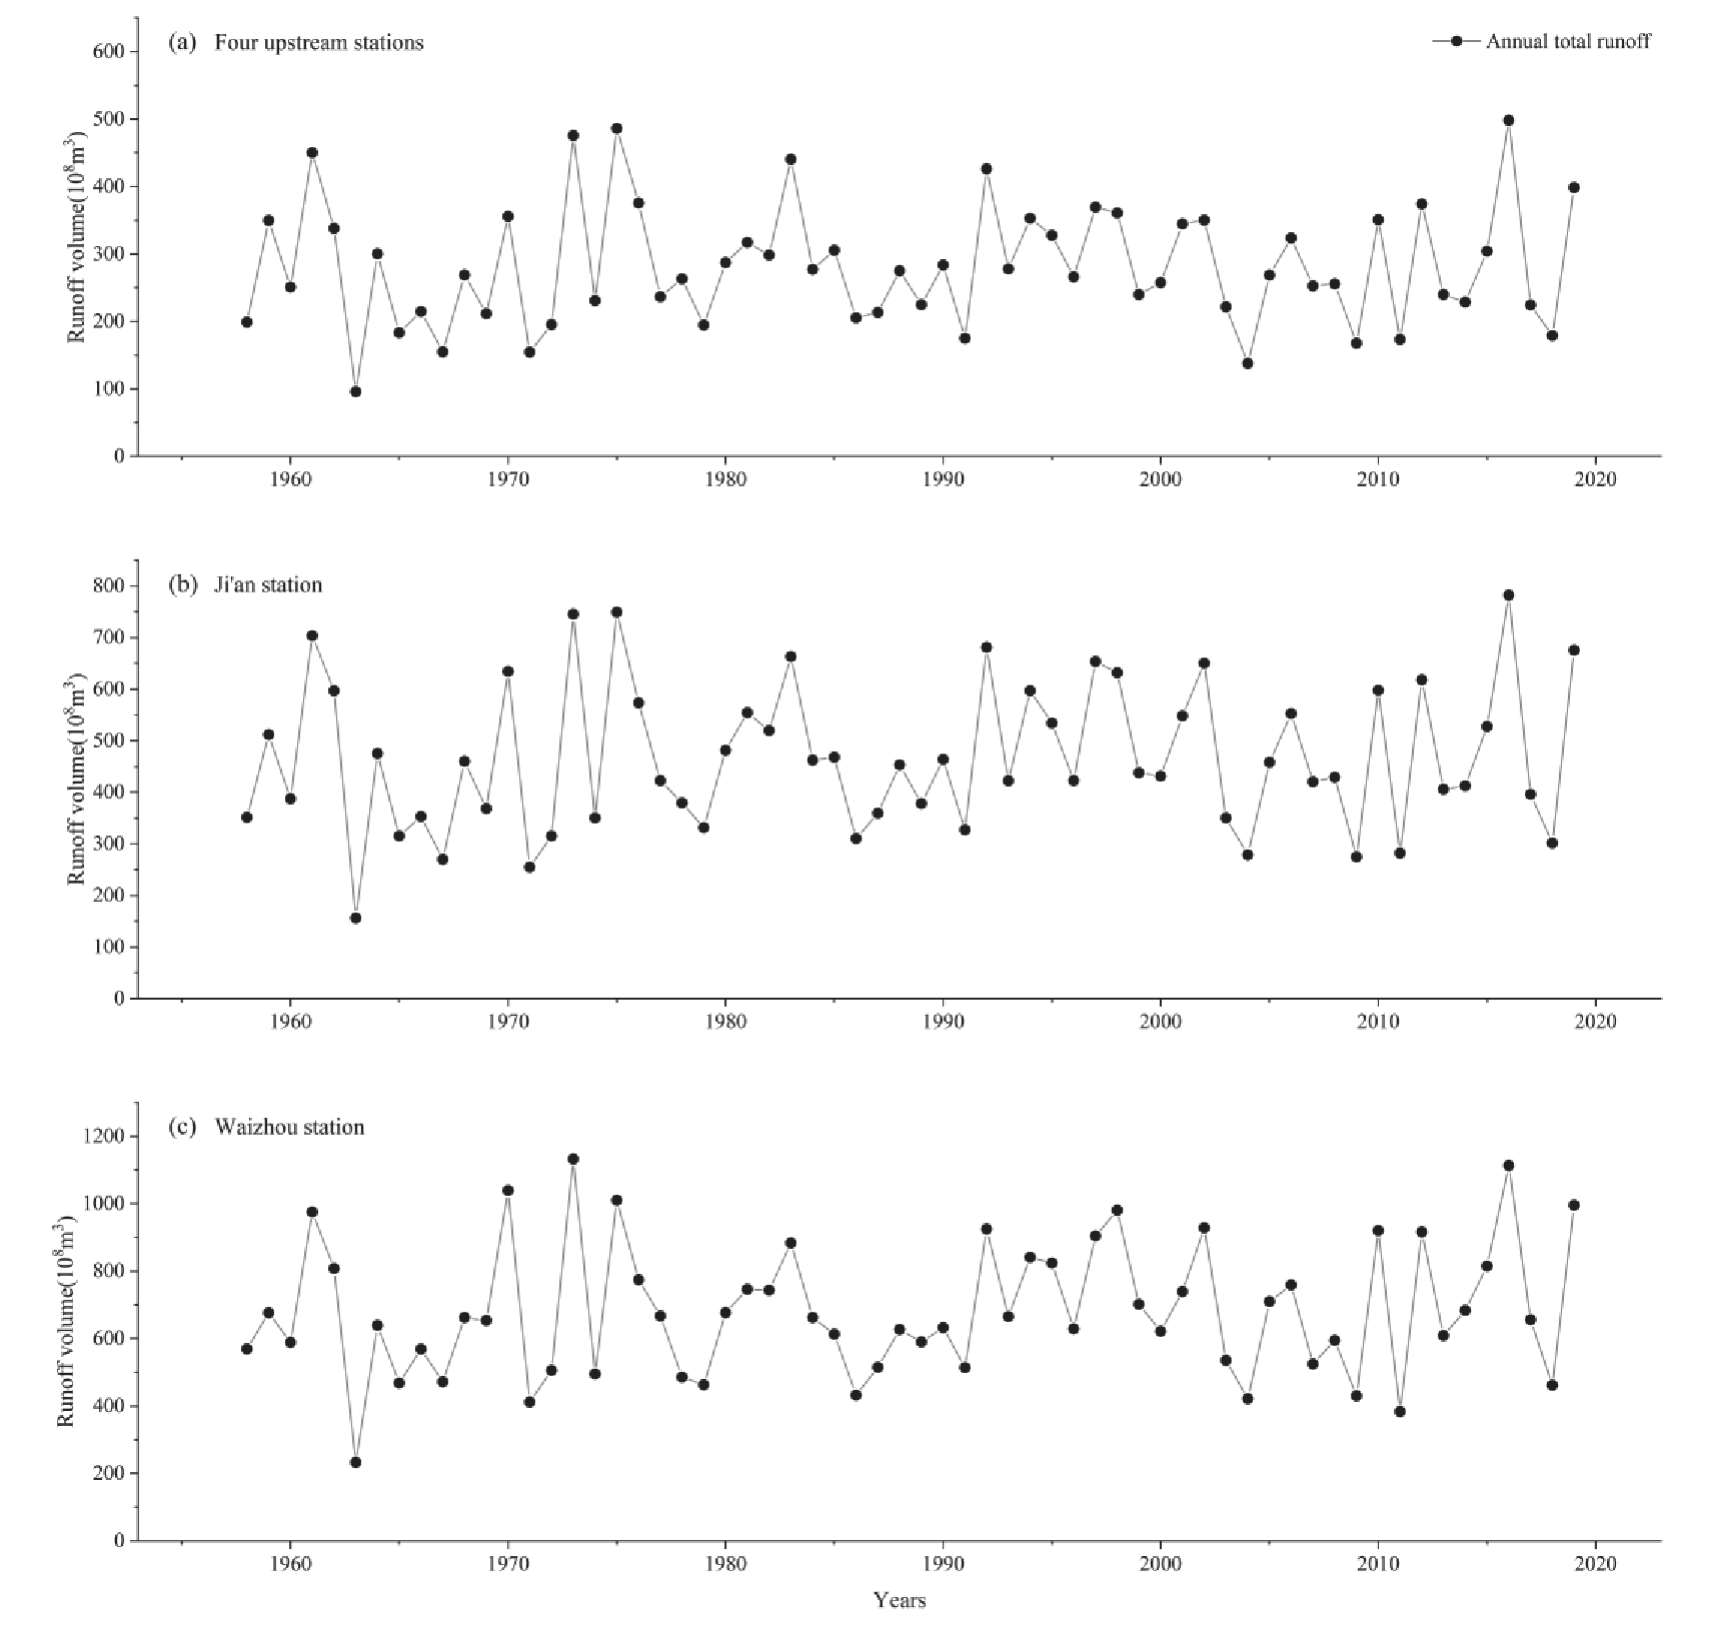
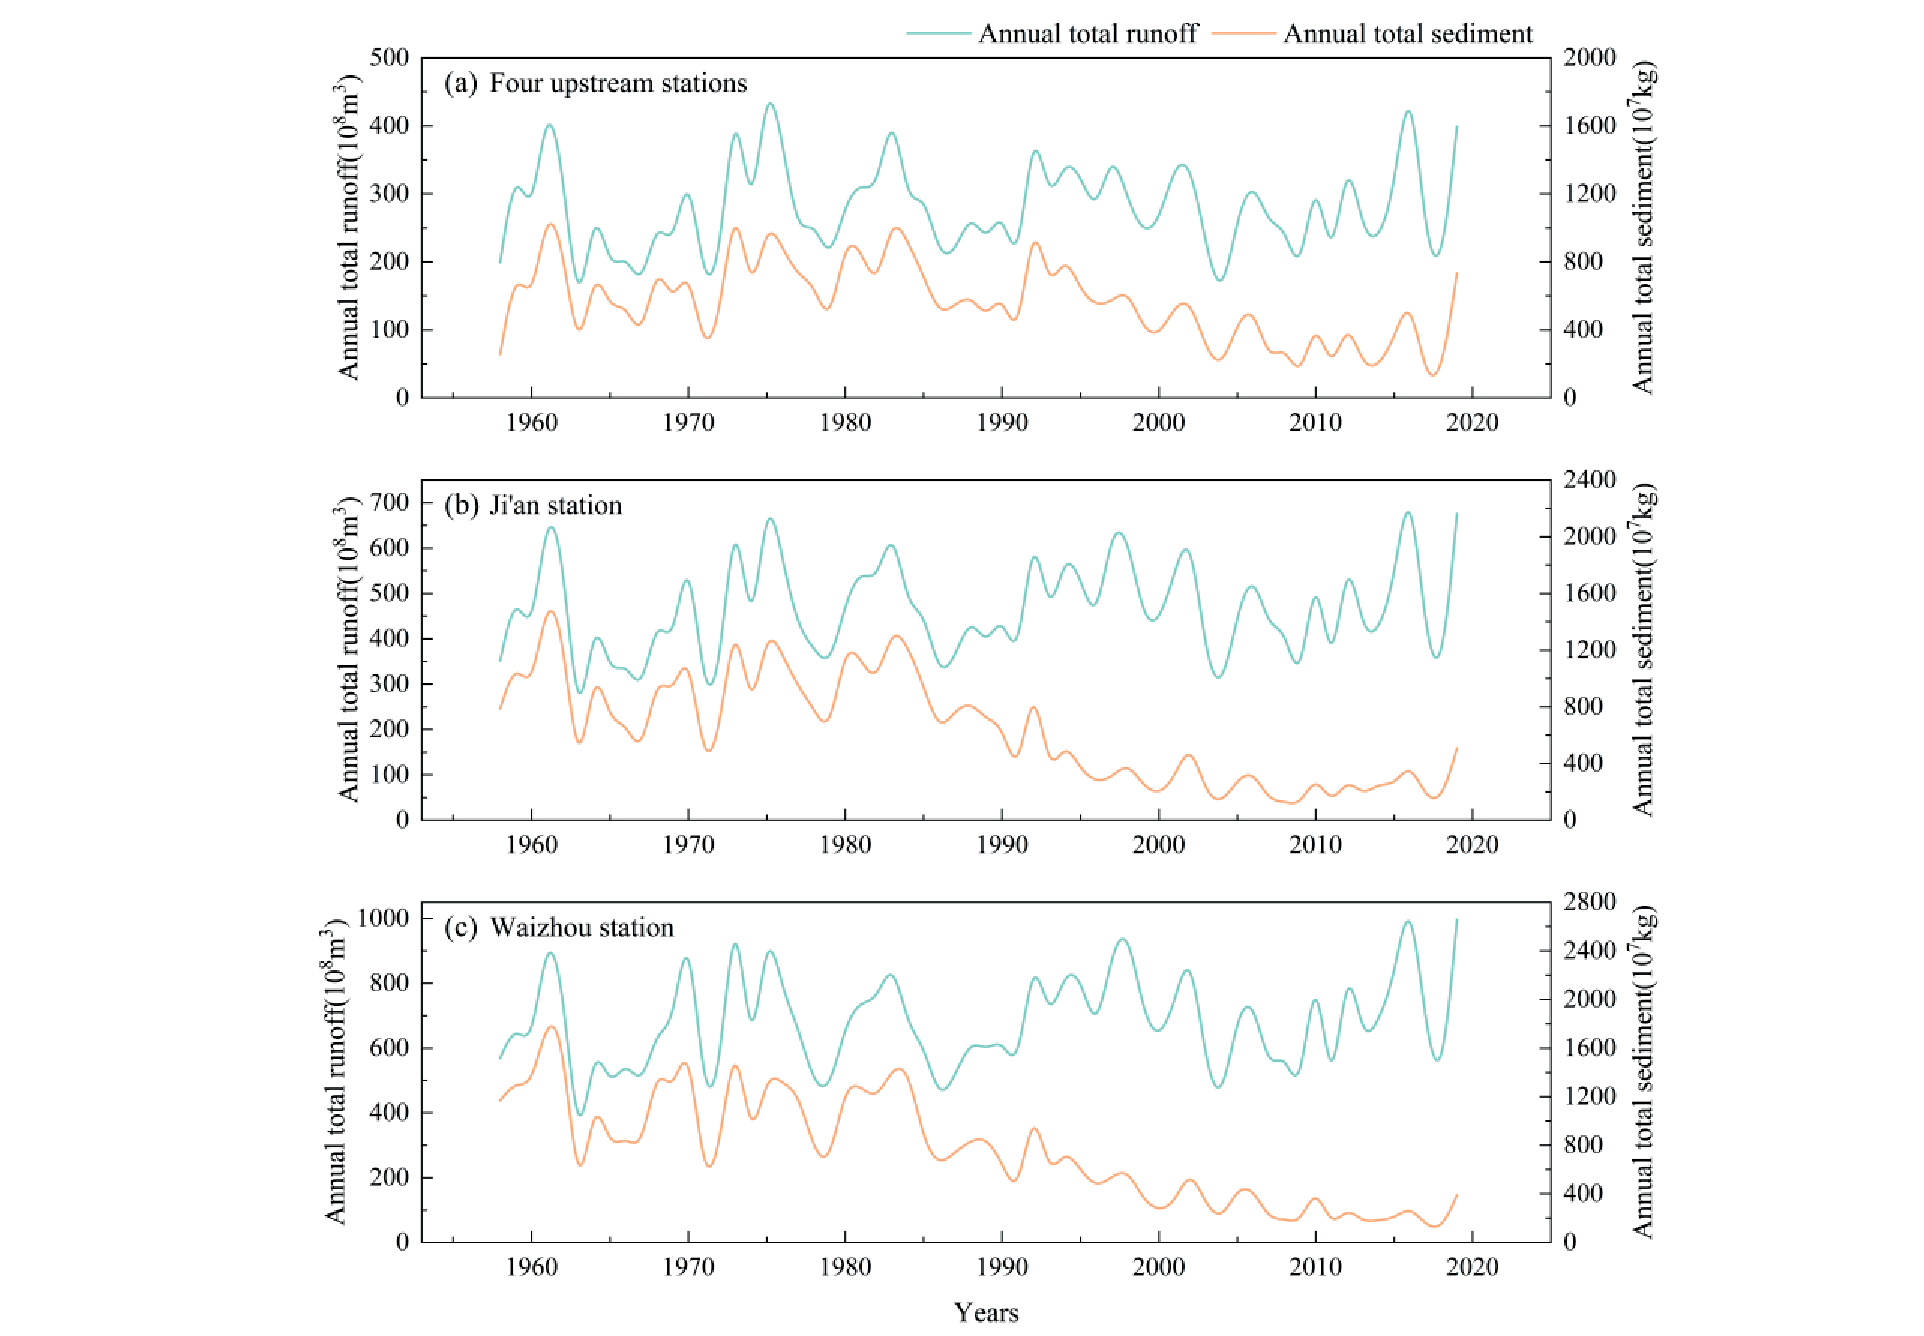
Runoff trends in each river section of the Ganjiang River basin during 1958-2019 are relatively similar (Fig. 3). The annual variation of runoff at each station is relatively large, and abundant water years are typically followed by flat water years or even dry water years, and thus the runoff is not maintained as a relatively flat state. Downstream runoff includes the upstream and midstream runoff, so the trends of runoff from each station are relatively similar. 1963 was a dry year, and the water level at each station in this year was the lowest value during the study period, with an annual runoff of 95.90×10⁸m3 at the four upstream stations, 156.32×10⁸m3 at Ji’an station, and 233.12×10⁸m3 at Waizhou station; Both 1973 and 2016 were abundant water years, and the maximum runoff at the four upstream stations and Ji’an station occurred in 2016, with their annual runoff being 498.25×10⁸m3 and 782.47×10⁸m3, respectively. The maximum runoff of Waizhou station occurred in 1973, with an annual runoff of 1113.56×108m3.
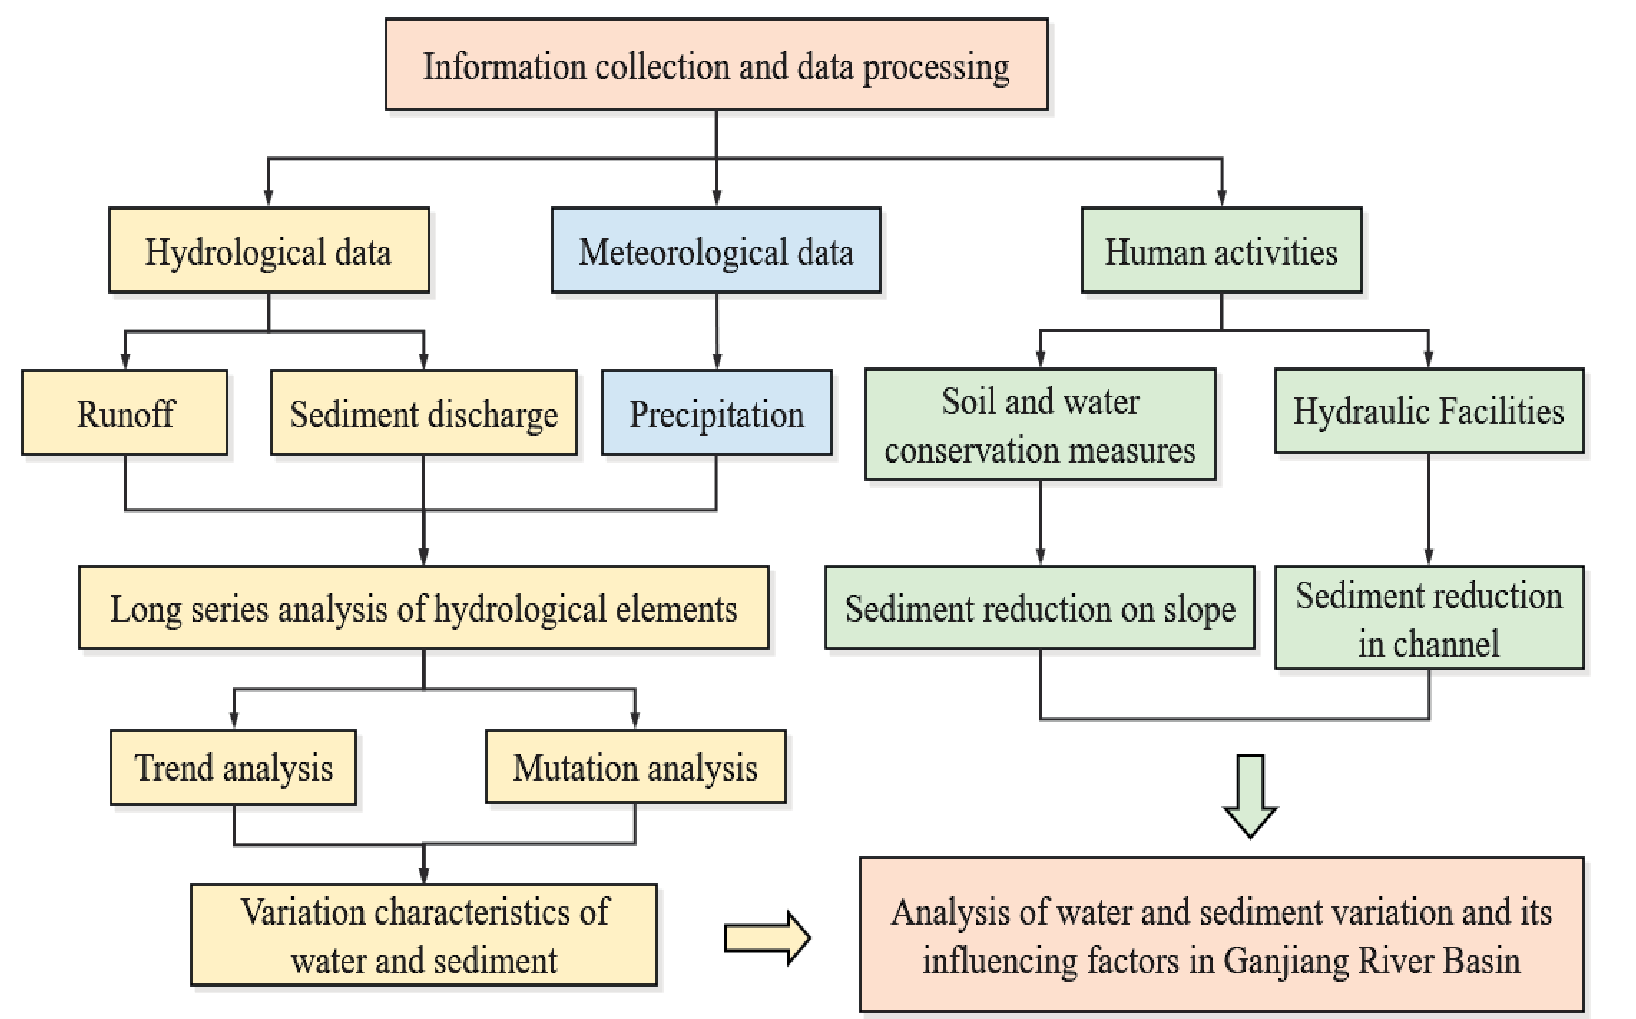
Fig. 3.
Changes in runoff volume of the Ganjiang River at each representative station from 1958 to 2019.
The chronological changes of runoff in the Ganjiang River basin are shown in Table 2, with the Ganjiang River runoff showing alternating changes of flat water, dry water, and abundant water. The 1990s were abundant water years , in which the annual average runoff at the four upstream stations, Ji'an station, and Waizhou station were 301.1×10⁸m3, 517.2×10⁸m3 and 761.8×10⁸m3, respectively, which were 107.3%, 110.8% and 111.9% of the multi-year average. The 1980s was a flat water period, with the annual average runoff at the four upstream stations, Ji’an station, and Waizhou station being 284.5×10⁸m3, 465.1×10⁸m3 and 649.0×10⁸m3, respectively, which are 101.4%, 99.7% and 95.3% of the multi-year average. The 1960s were a dry water era, with the annual average runoff at the four upstream stations, Ji’an station and Waizhou station being 247.0×10⁸m3,408.7×108m3 and 606.6×10⁸m3, respectively, which are 88.0%, 87.6% and 89.1% of the multi-year average.
The Mann-Kendall trend test was applied to show that the annual runoff in the upper and middle, and lower reaches of the Ganjiang River basin showed a weak and insignificant growth from 1958 to 2019 (Table 3).
The Mann-Kendall mutation test revealed that the UB and UF curves of the annual runoff series at the upper and lower reaches crossed within the confidence line several times (Fig. 4), but there were small fluctuations and no large differences in the mean values around these intersections, and the existence of mutation points was tentatively determined. We next use the sliding t-test method to analyze the annual runoff at each station for abrupt changes, which is more accurate in determining true abrupt change points (Fig. 5). Where the set step size is 6 and the significance level is 0.05, the degree of freedom is 10, corresponding to t = 2.23 (Table 4). It can thus be assumed that the annual runoff at all three stations in the upper and middle reaches between 1958 and 2019 changed abruptly in 1990.
Table 2.
Chronological changes of runoff at representative stations of Ganjiang River (108m3).
Table 3.
Ganjiang River runoff trend test.
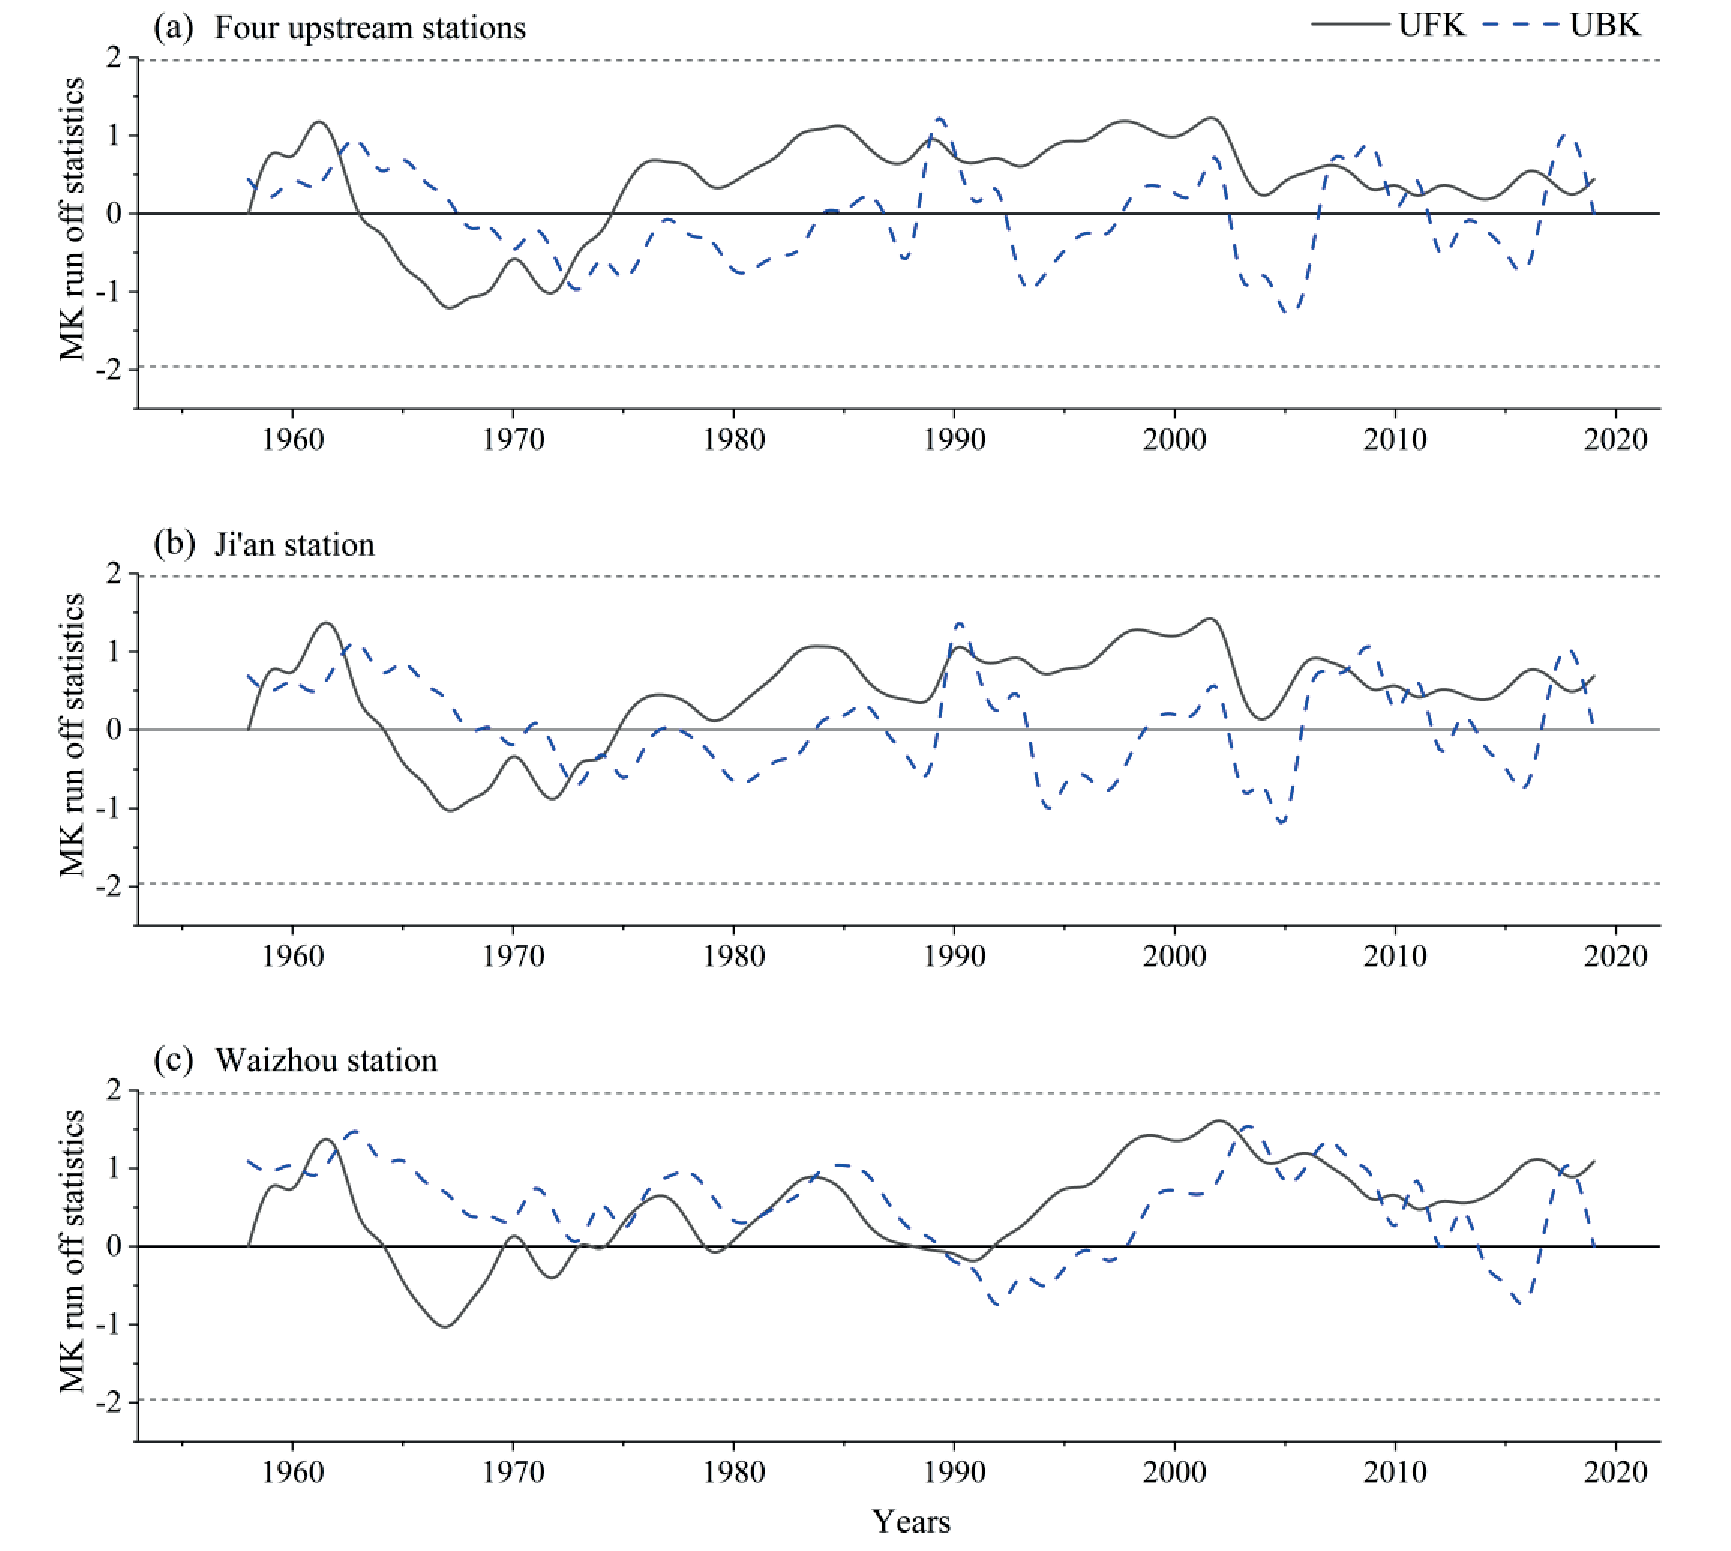
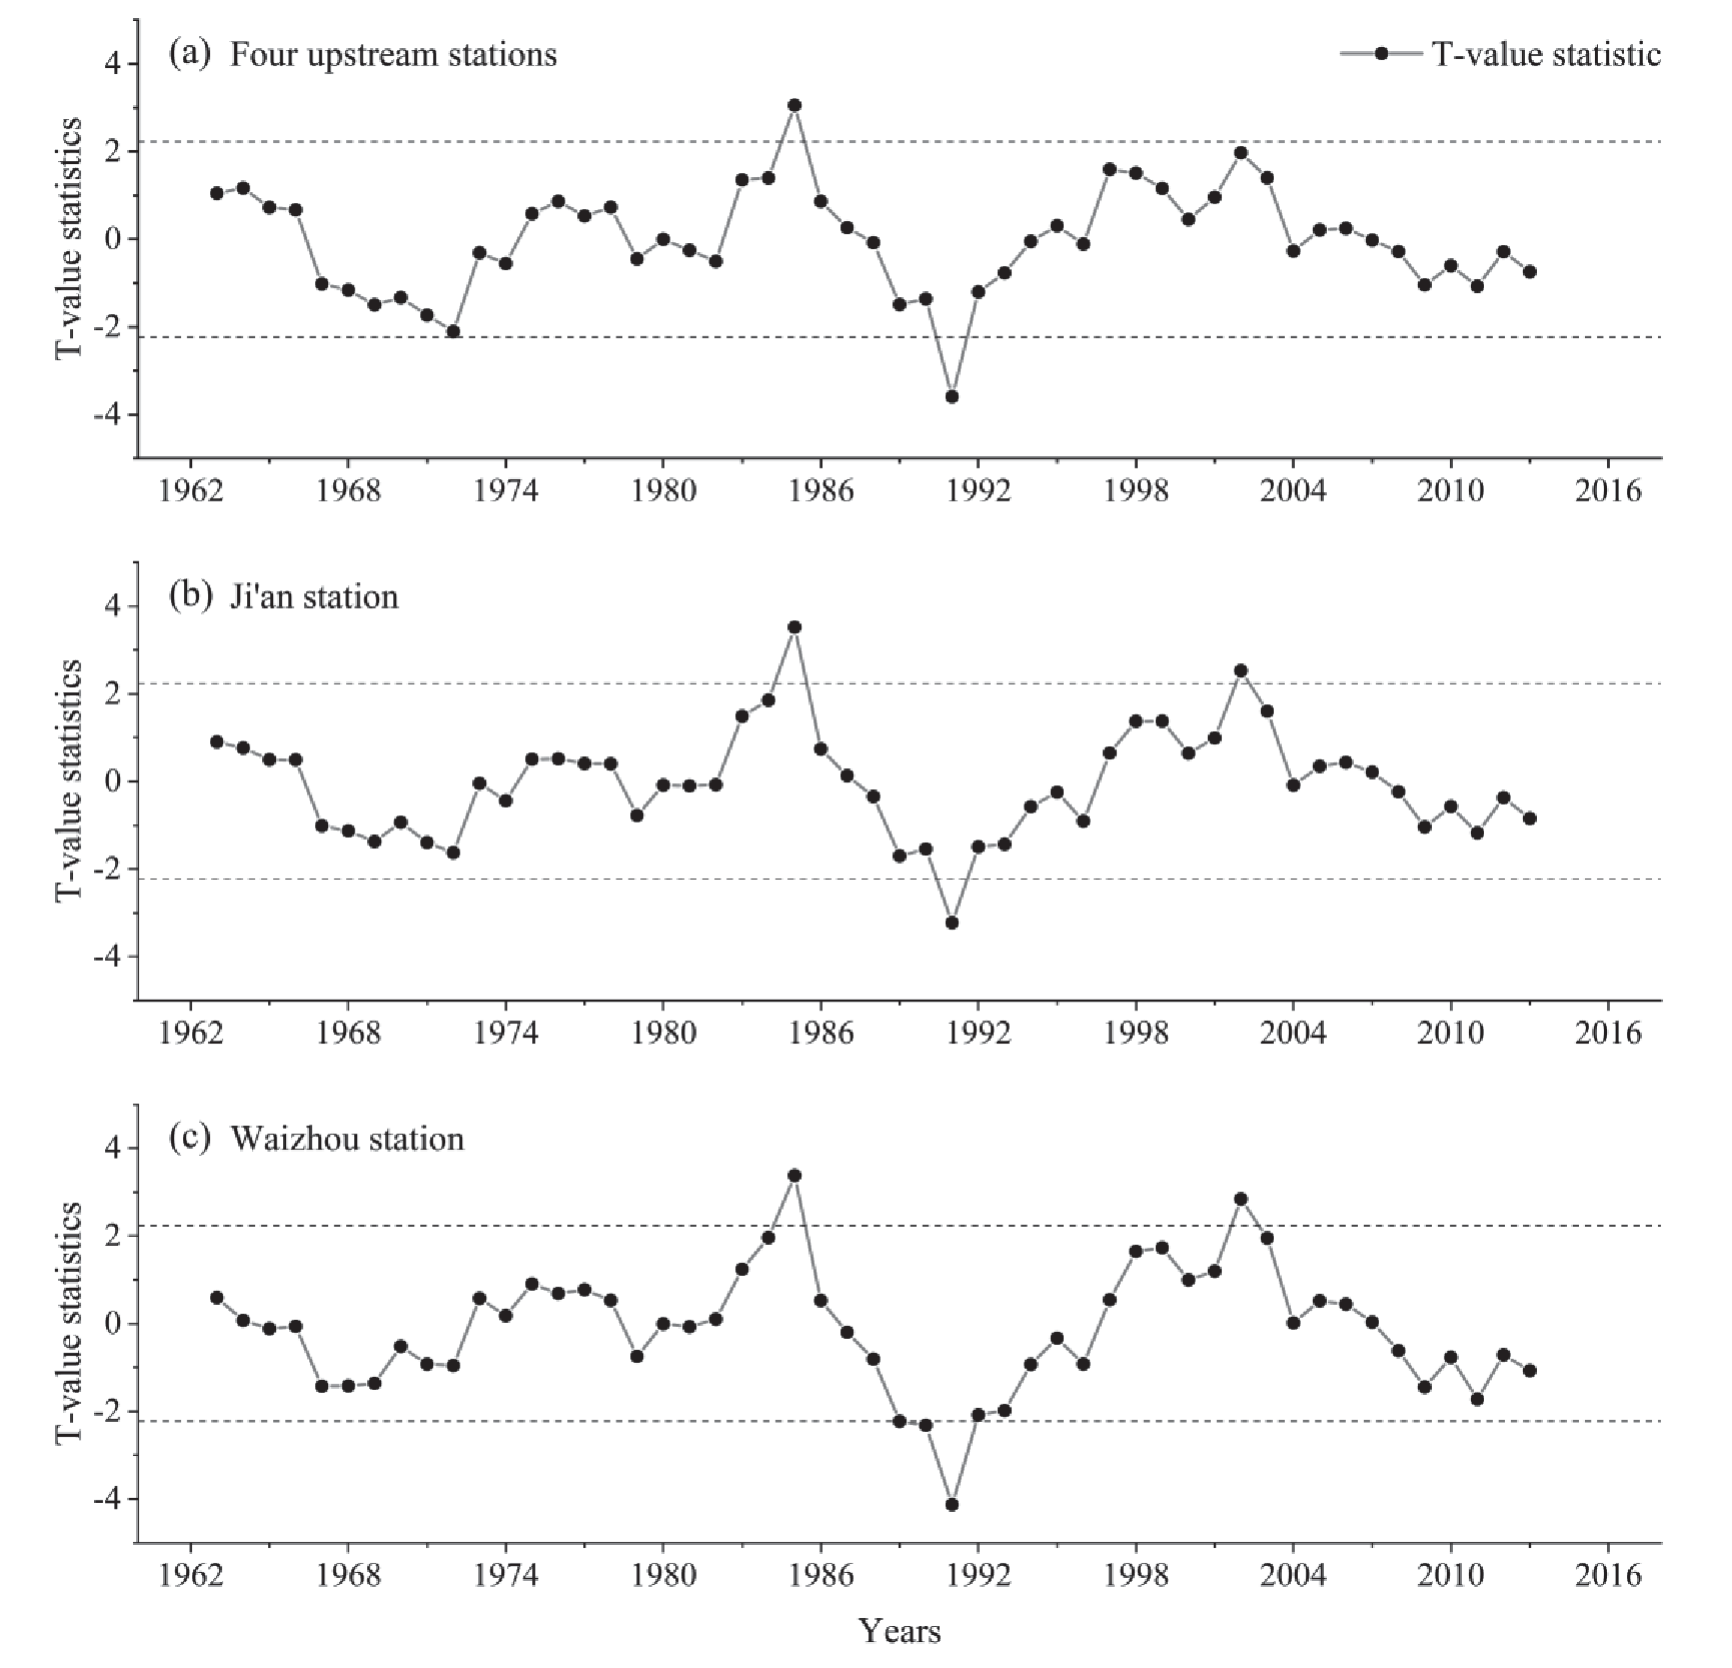
Table 4.
Stages of runoff evolution in the Ganjiang River basin.
Characteristics of Annual Sand Transport Variation
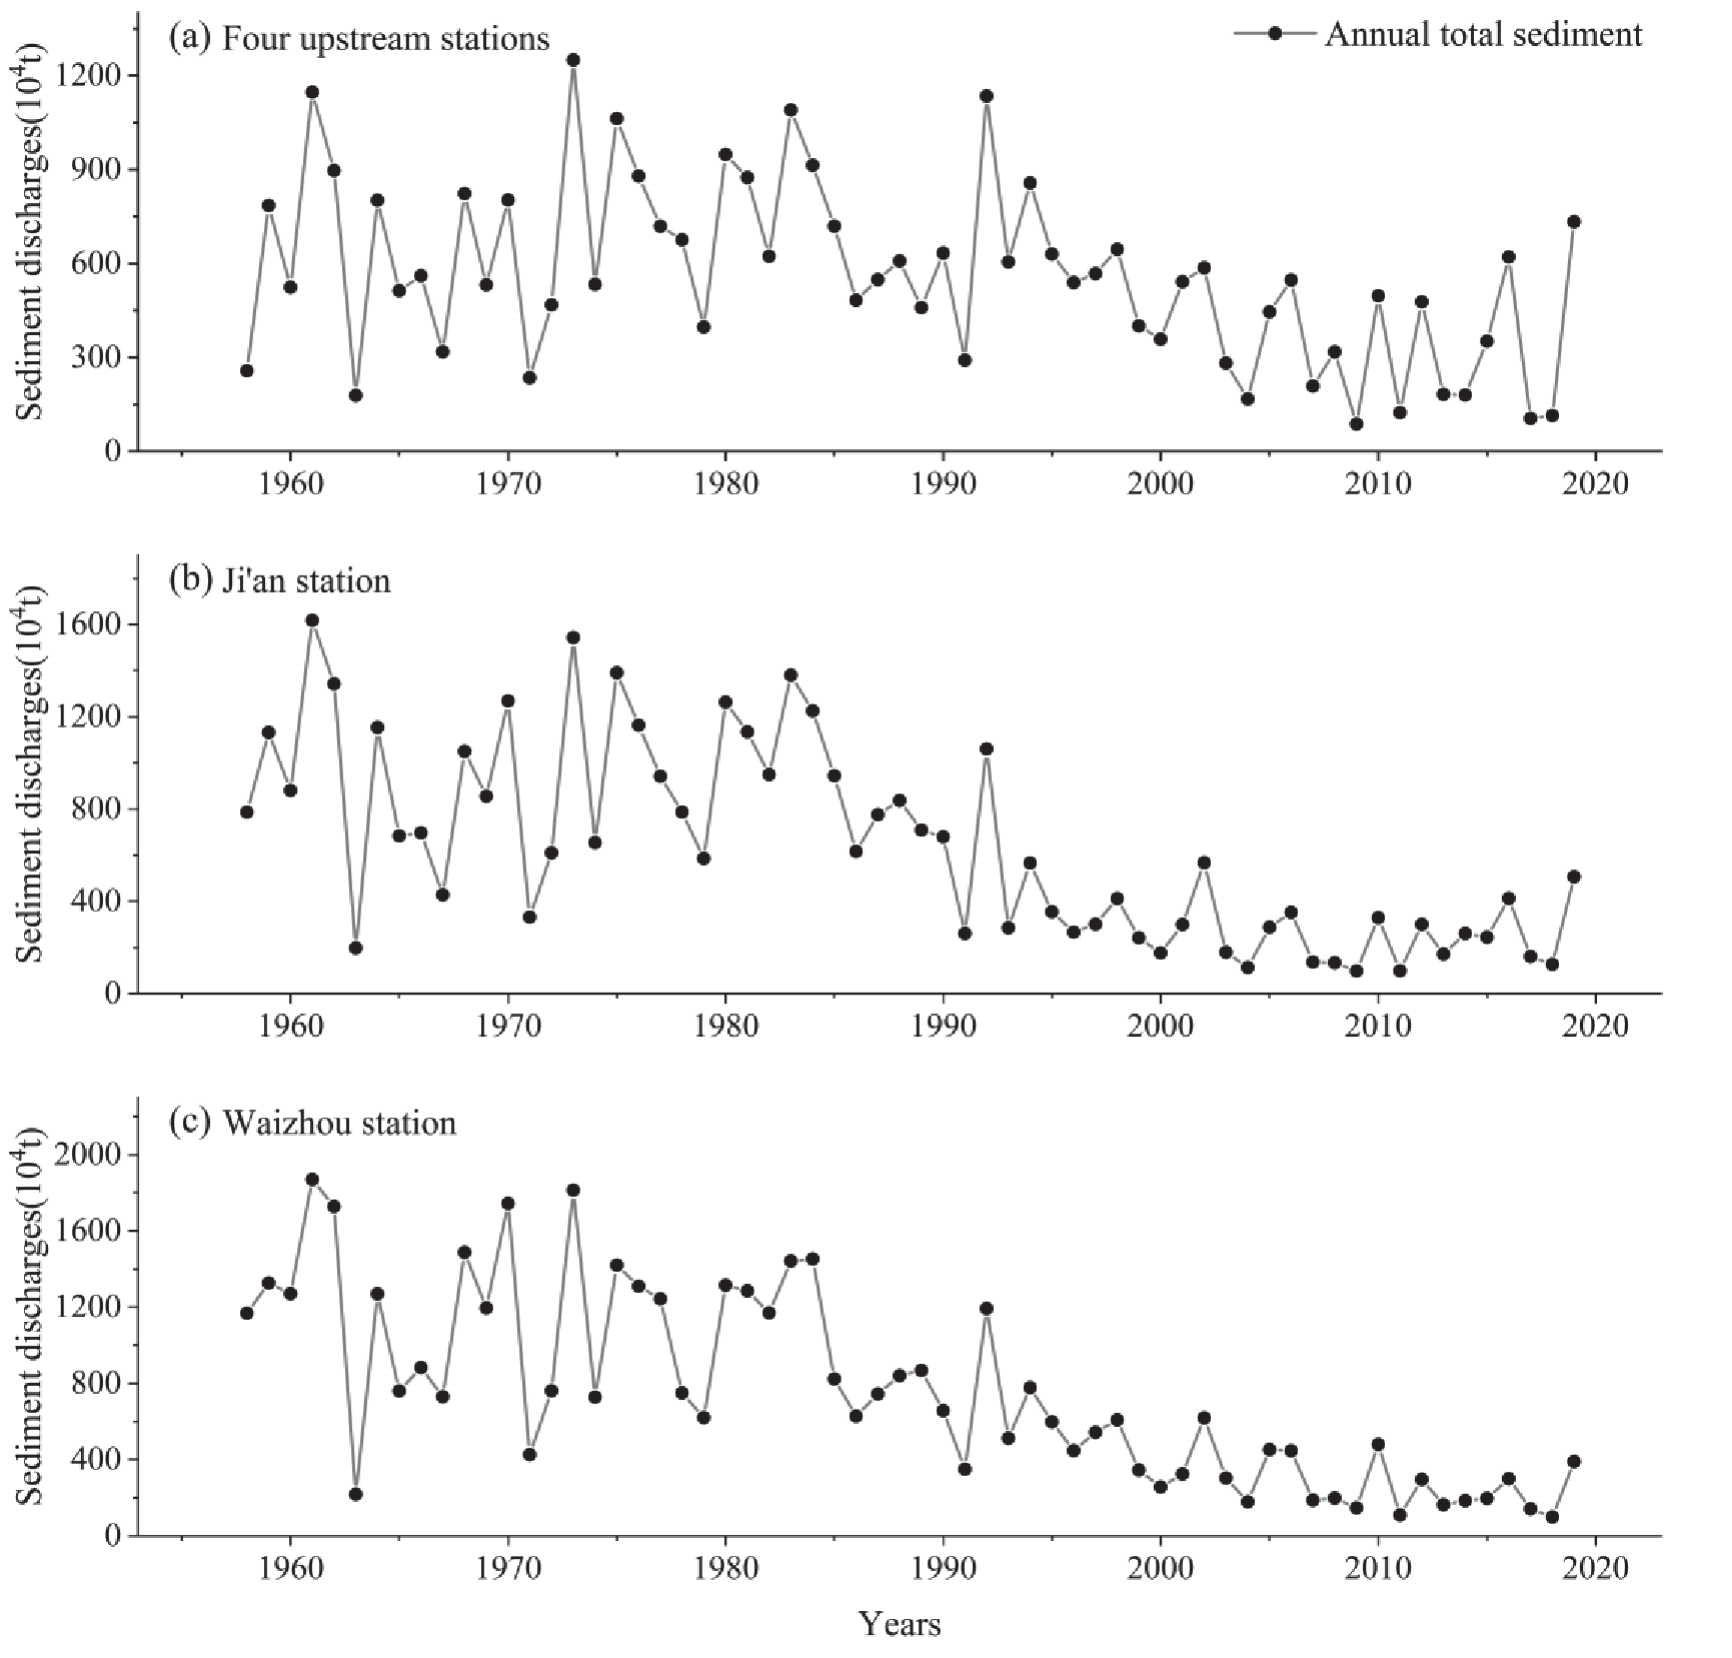
Sand delivery trends were analyzed using the Mann-Kendall trend test, and it was found that the overall sand delivery showed a significant decrease between 1958 and 2019 (Fig. 6). The sand transport in the basin in 2018 was very small during the study period, the annual sand transport in the upper, middle, and lower reaches were 99.12×10⁷kg, 126.61×10⁷kg and 114.77×10⁷kg, respectively, and the interannual variation of sand transport in each station from 1958 to 1992 was very large. Sand transport also increased and decreased over time. The sand loss at the four upstream stations is much less than that at Waizhou and Ji’an stations. However, after 1993, the amount of sand transported in the Ganjiang basin decreased significantly, the reduction of sand transported in the middle and lower reaches was much larger than that in the four upstream stations, and the amount of sand transported in the four upstream stations was higher than that in the Ji’an and Waizhou stations.
Fig. 6.
Variation of sand transport at representative stations of the Ganjiang River from 1958 to 2019.
The results of the sand transport trend test for each station in the upper, middle, and lower reaches of the Ganjiang River are shown in Table 6. Each hydrological station in the basin shows a significant decrease, with Waizhou and Ji'an stations being more significant than the upstream stations. The results of the Mann-Kendall mutation test for the sand transport series are shown in Fig. 7 below. The UF-UB curves of the sand transport at the four upstream stations show that the sand transport increased from 1958 to 1998, but decreased after 1998. The UF and UB of the four upstream stations have a unique intersection point between 2001 and 2003 and are within confidence limits. Independent sample sliding t-tests were then used to examine the three points in 2001, 2002 and 2003 (Fig. 8), showing that 2002 was when an abrupt change in sand delivery occurred at the four upstream stations. The results of the Mann-Kendall mutation test and the sliding t-test method determine that the mutation points of sand transport at Ji'an and Waizhou stations occurred in 1994 and 1997, respectively.
Next, the annual average of sand transport before and after the abrupt change was calculated for each hydrological station. The abrupt change point divides the process of sand transport in the four upstream stations into two stages, 1958-2001 and 2002-2019, and the multi-year average sand transport during each stage is 655.31×10⁷kg and 334.94×10⁷kg, respectively; The mutation point at Ji'an station divides the evolution of sand transport into two phases, 1958- 1993 and 1994-2019, with an average annual sand transport of 894.99×10⁷kg for the phase 1958-1993 and 272.89×10⁷kg for the phase 1994-2019; The abrupt change point at the outer station divides the evolution of sand transport into two stages, 1958-1996 and 1997-2019, with an annual average sand transport of 1021.12×107kg for the stage 1958-1996 and 303.01×10⁷kg for the stage 1993-2019.
Table 5.
Interdecadal variation of sand transport at each representative station of Ganjiang River (104t).
Table 6.
Sand transport trend tests in the Ganjiang River basin.
Characteristics of the Relationship between Runoff and Sand Transport
The interannual variation of runoff and sand transport at hydrological stations in the Ganjiang River basin are compared (Fig. 9). The sand transport at the main hydrological stations in the Ganjiang River basin shows an variable decrease for 1958-2019. Although the runoff fluctuates, the changes are relatively consistent, and there is a significant correlation between runoff and sand transport. The relationship between cumulative runoff and sand transport (Fig. 10) shows that the cumulative curves of runoff at the four upstream stations, Ji'an station, and Waizhou station are relatively flat, indicating that the annual change of runoff is not significant. The cumulative behavior of sand transport has an upward convex curve, which indicates that sand transport increased in a certain year. This suggests that the change in sand transport was greater than the change in runoff during that period.
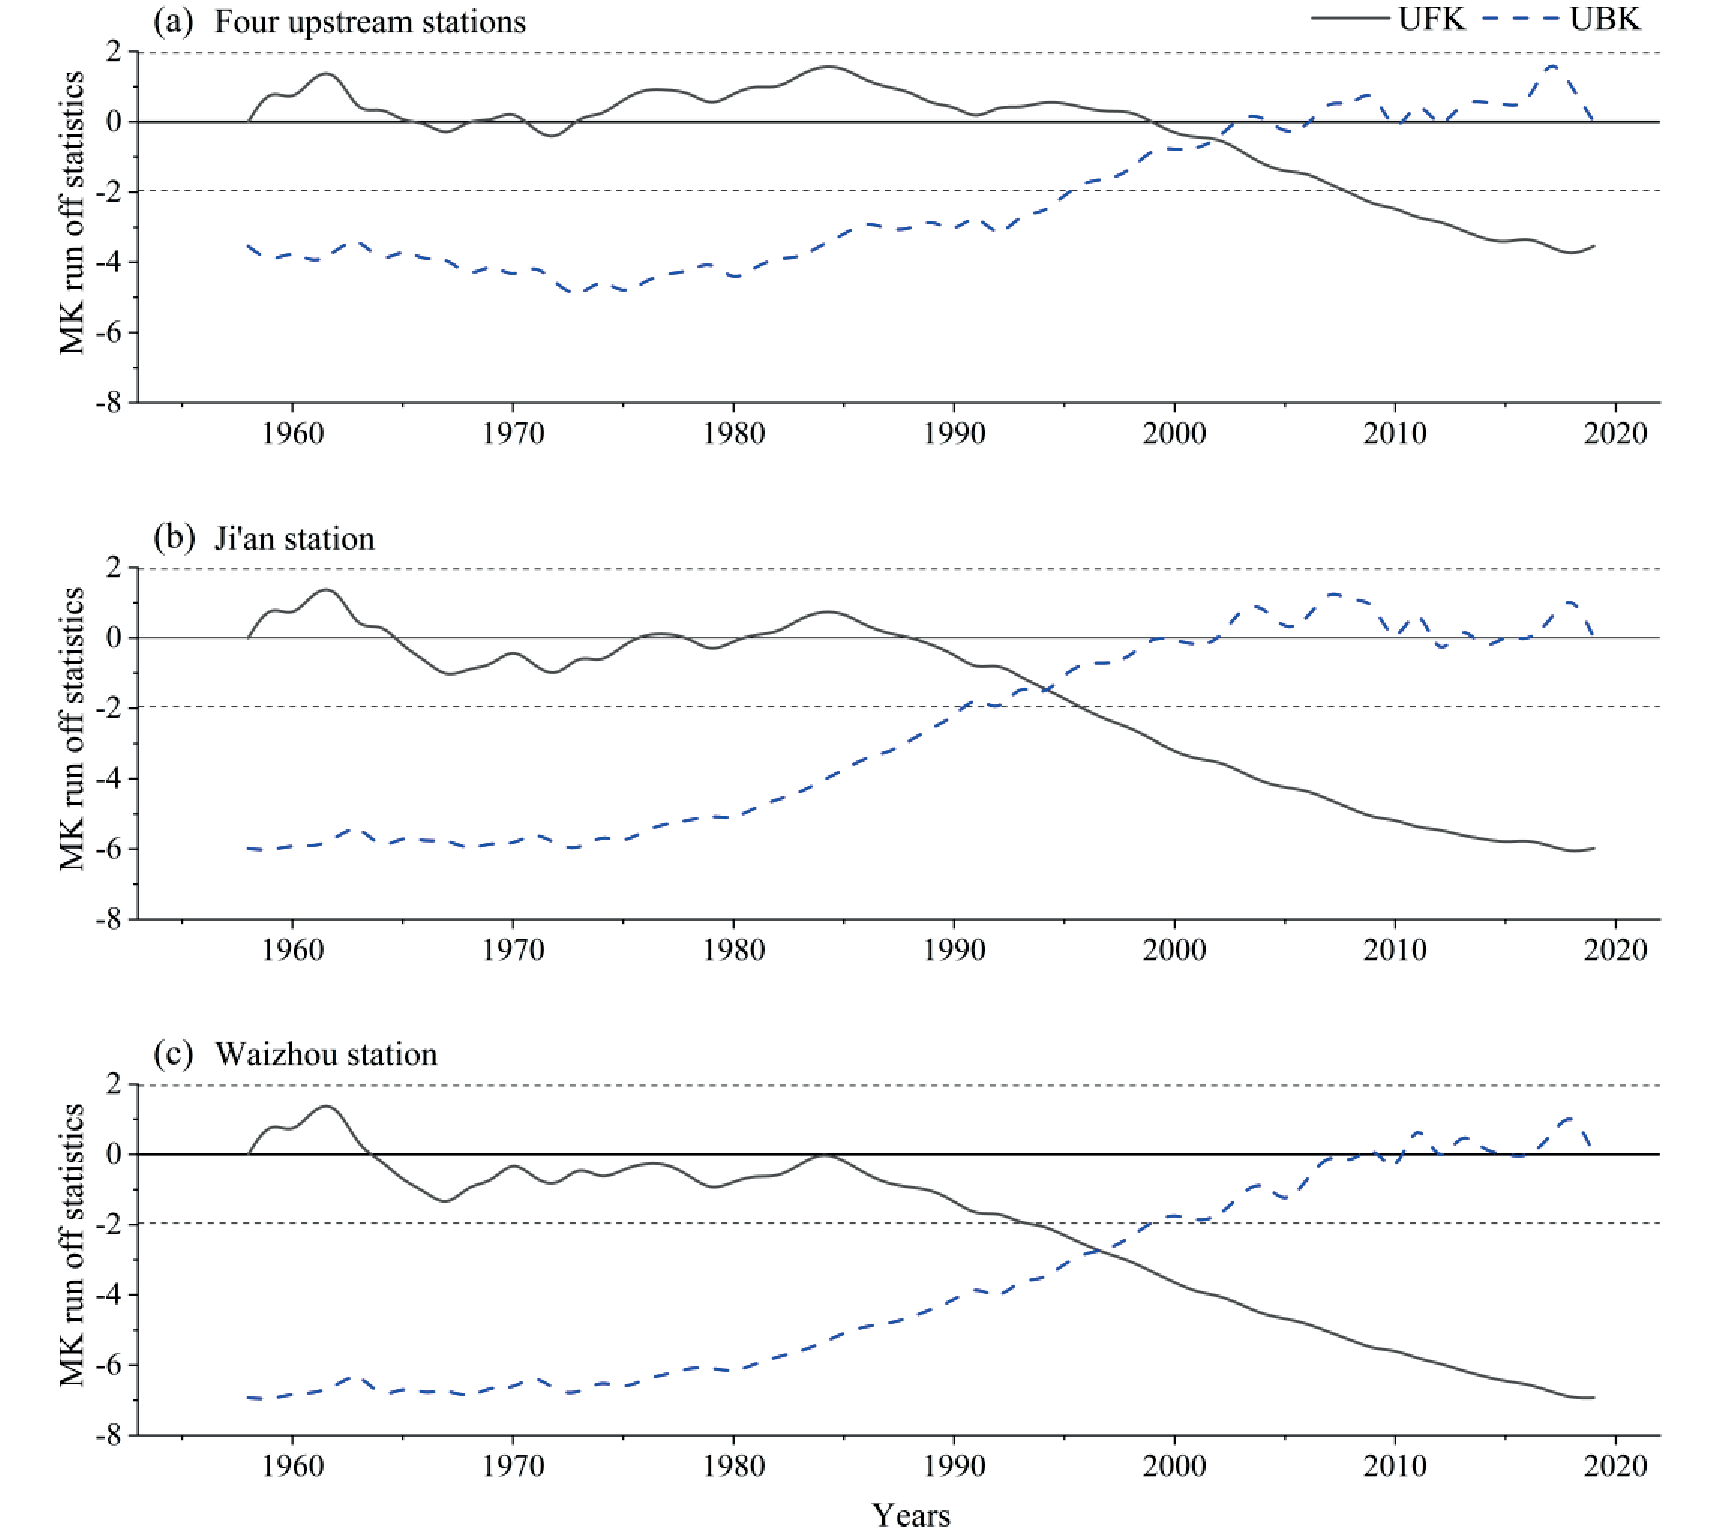
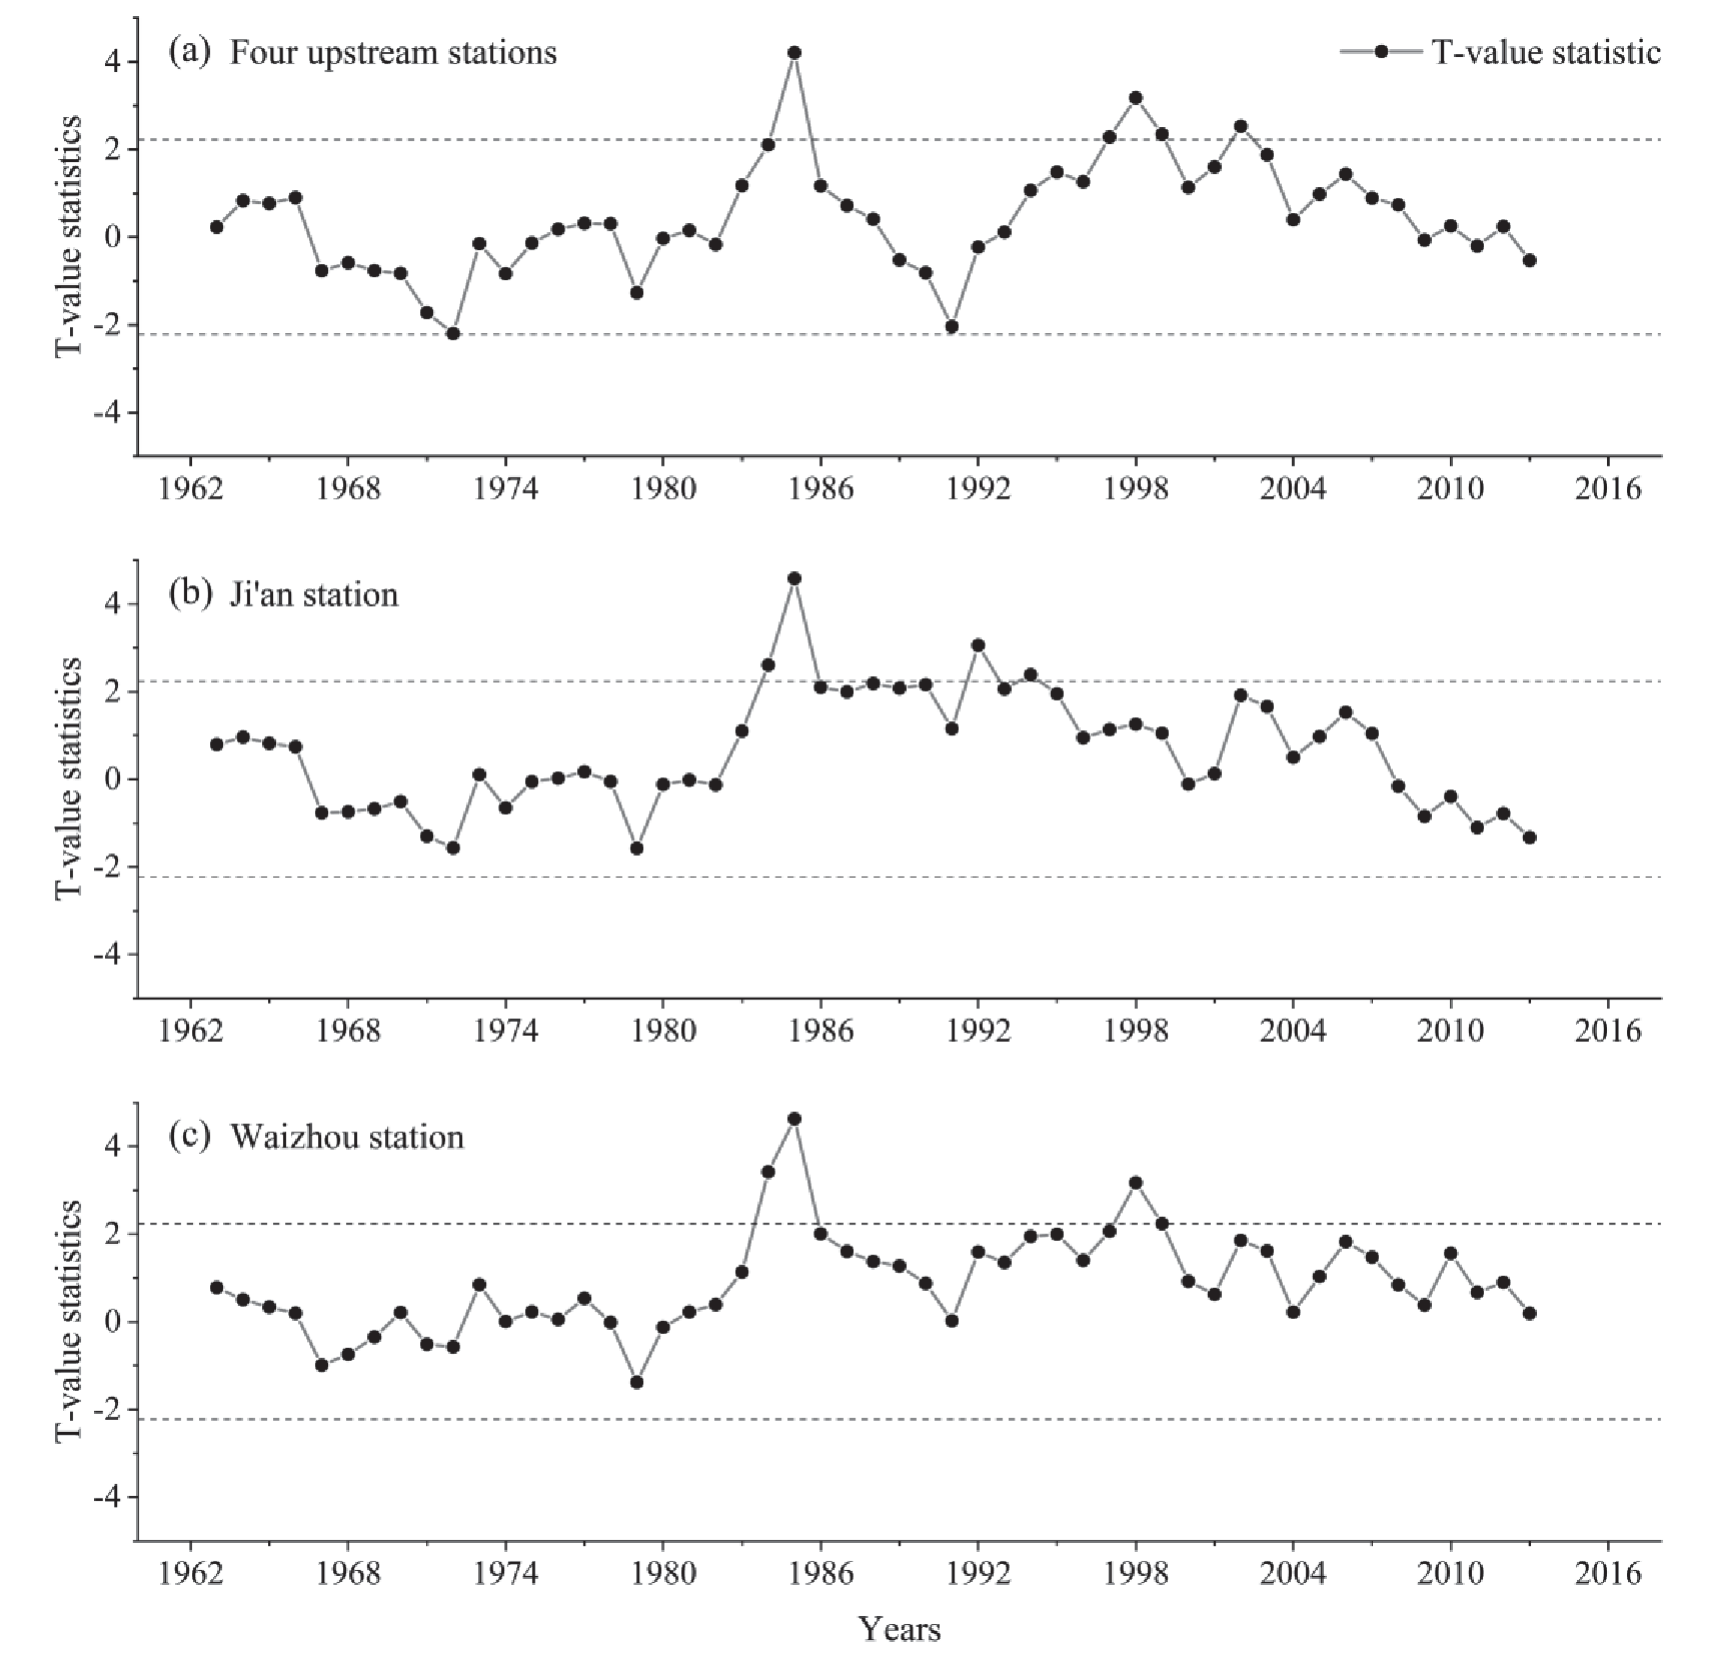
Table 7.
Evolutionary stages of annual sand transport in the Ganjiang River basin.
Discussion
Analysis of Runoff Factors
The Ganjiang River basin runoff showed an insignificant increase, with abrupt changes at all stations in 1990. The water recharge in the Ganjiang River basin is mainly from precipitation. Changes in precipitation and runoff are in good agreement, showing that the runoff increases and decreases with the increase of precipitation (Fig. 11); Fig. 12 shows the double cumulative curve of precipitation and runoff in the Ganjiang River basin.
Fig. 9.
Comparison of inter-annual variation of runoff and sand transport at representative stations of the Ganjiang River basin.
The correlation coefficient between precipitation and runoff is close to 100%, indicating that precipitation is the main cause of runoff changes. However, human activities also have some influence on runoff. Also, the vegetation cover in the watershed increased significantly from 1990 to 1991, which is consistent with the time of sudden change of runoff [8]. In addition, a large number of water conservancy projects have been constructed in the Ganjiang River basin during the study period (Table 8). The construction of a large number of water conservancy facilities has played an important role in the regulation and distribution of water resources in the Ganjiang River basin and has also had effects on runoff [19, 20]. The Wanan Reservoir, located upstream of Ji'an Station, for example, was completed and put into operation in August 1990. The operation of the Wanan Reservoir influenced change in runoff in the Ganjiang River basin and also contributed to the sudden change in the Ganjiang River basin in 1990 [21]. Similarly, agricultural irrigation, domestic and industrial water use in the basin may also impact runoff [22].
Analysis Sand Transport Variation and Contributing Factors
The annual sand transport in the Ganjiang basin decreases significantly and has abrupt change points at the four upstream stations, Ji'an station, and Waizhou station during 2002, 1994, and 1997, respectively. The correlation coefficient of precipitation and sand transport is 99.6% (Fig. 13), which is lower than that of precipitation and runoff. The consistency of interannual variability of precipitation and sand transport is relatively poor, and a significant decrease in sand transport occurred after the 1990s (Fig. 14). Human activities such as engineering and interception and integrated soil and water conservation management have a greater impact on the reduction of sand transport [24, 25].
There are large numbers of large reservoirs built in the Ganjiang River basin (Table 8). The operation of these reservoirs impacts downstream water and sand. Storing water intercepts river water, resulting in sediment accumulation at the reservoir bottom, leading to reduced sand content when water is released. Consequently, this also causes a decrease in sand transport downstream. The main reason for the sudden change in the amount of sand transported from Ji'an Station in 1994 is that the Wan'an Reservoir in the middle reaches of the Ganjiang River was completed and began to store water in 1990, which intercepted a large amount of sediment [26]. In the 1990s, Jiangxi carried out large-scale soil and water conservation measures (Table 9), and a series of soil and water conservation projects were carried out in the Ganjiang River basin, such as the key management of eight national soil and water conservation areas and the key management of Poyang Lake. About 420 small watersheds have had comprehensive management, and the sand interception rate of the management area increased to more than 60% [27]. The reduction of soil damage by human activities, the reduction of soil erosion, and the substantial reduction of soil erosion in the watershed, all lead to a reduction in annual sand transport, as well as the conversion of agricultural land to forest land by returning farmland to forest.
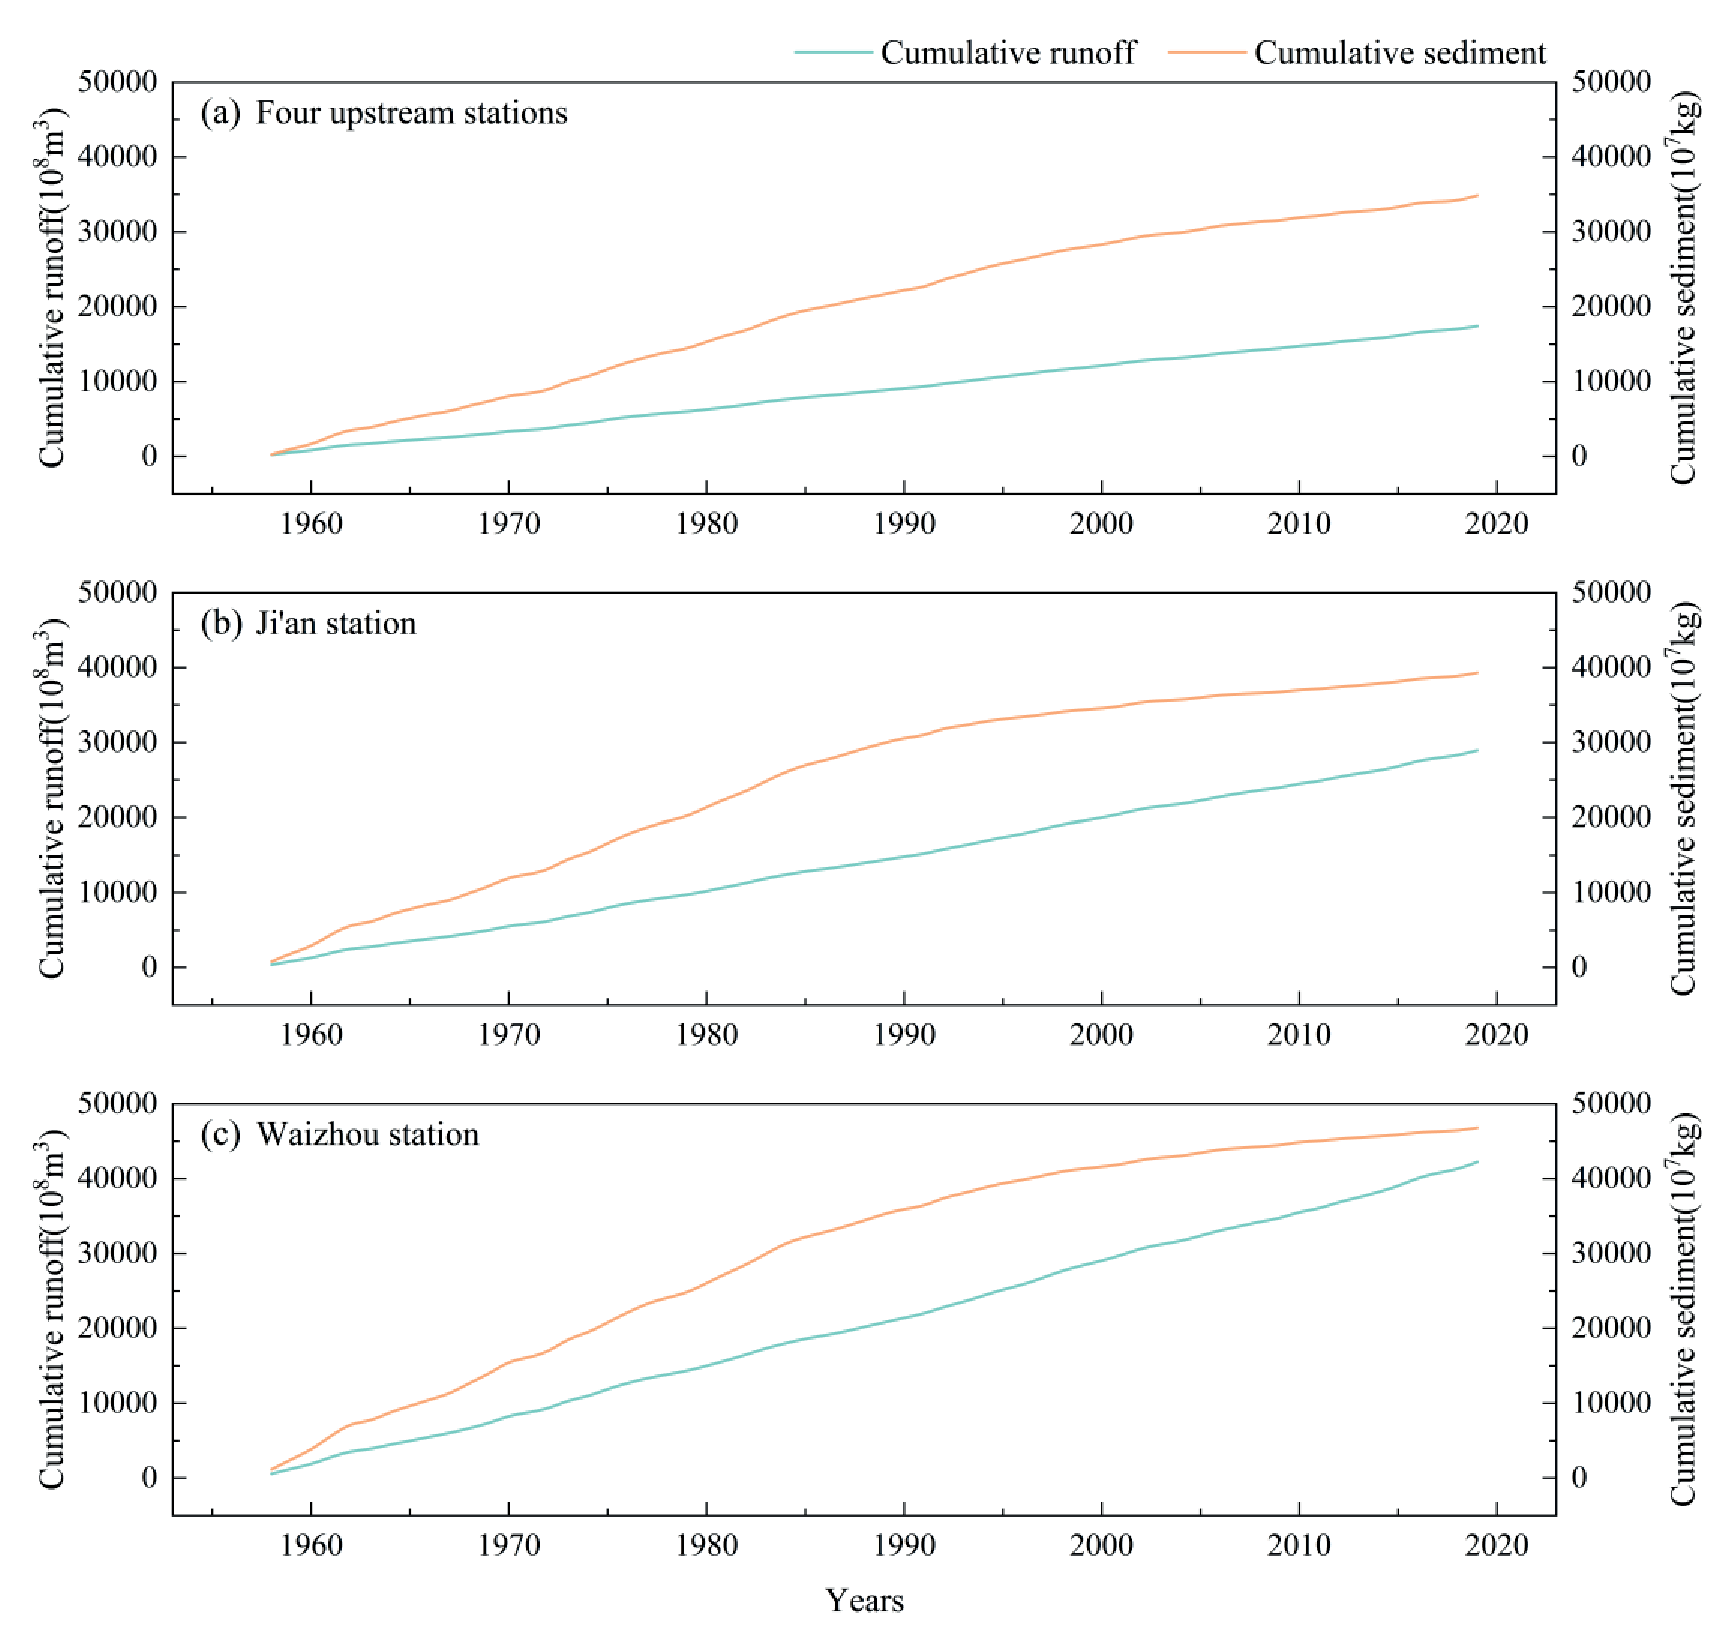
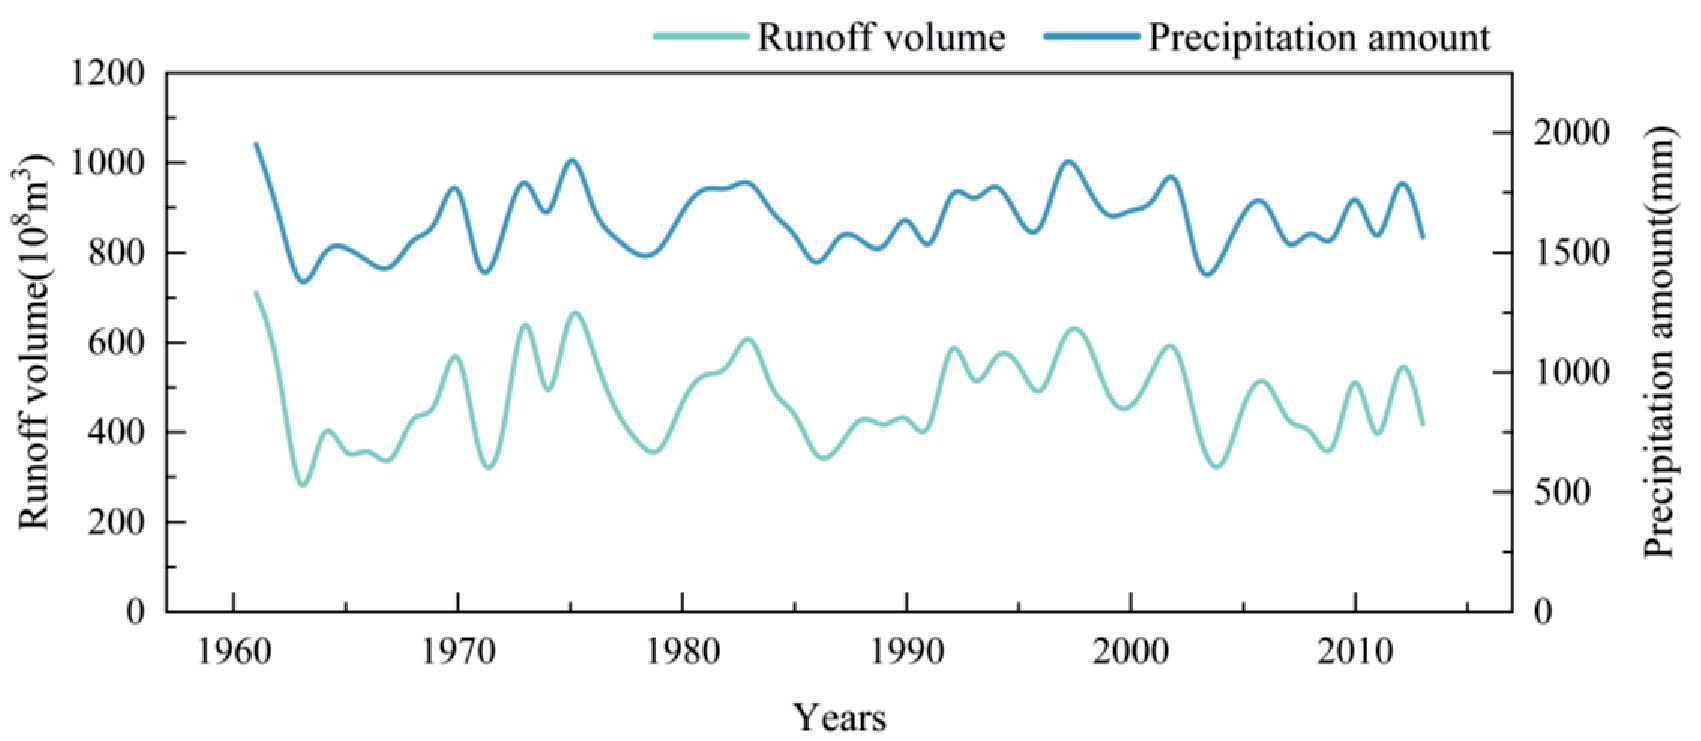
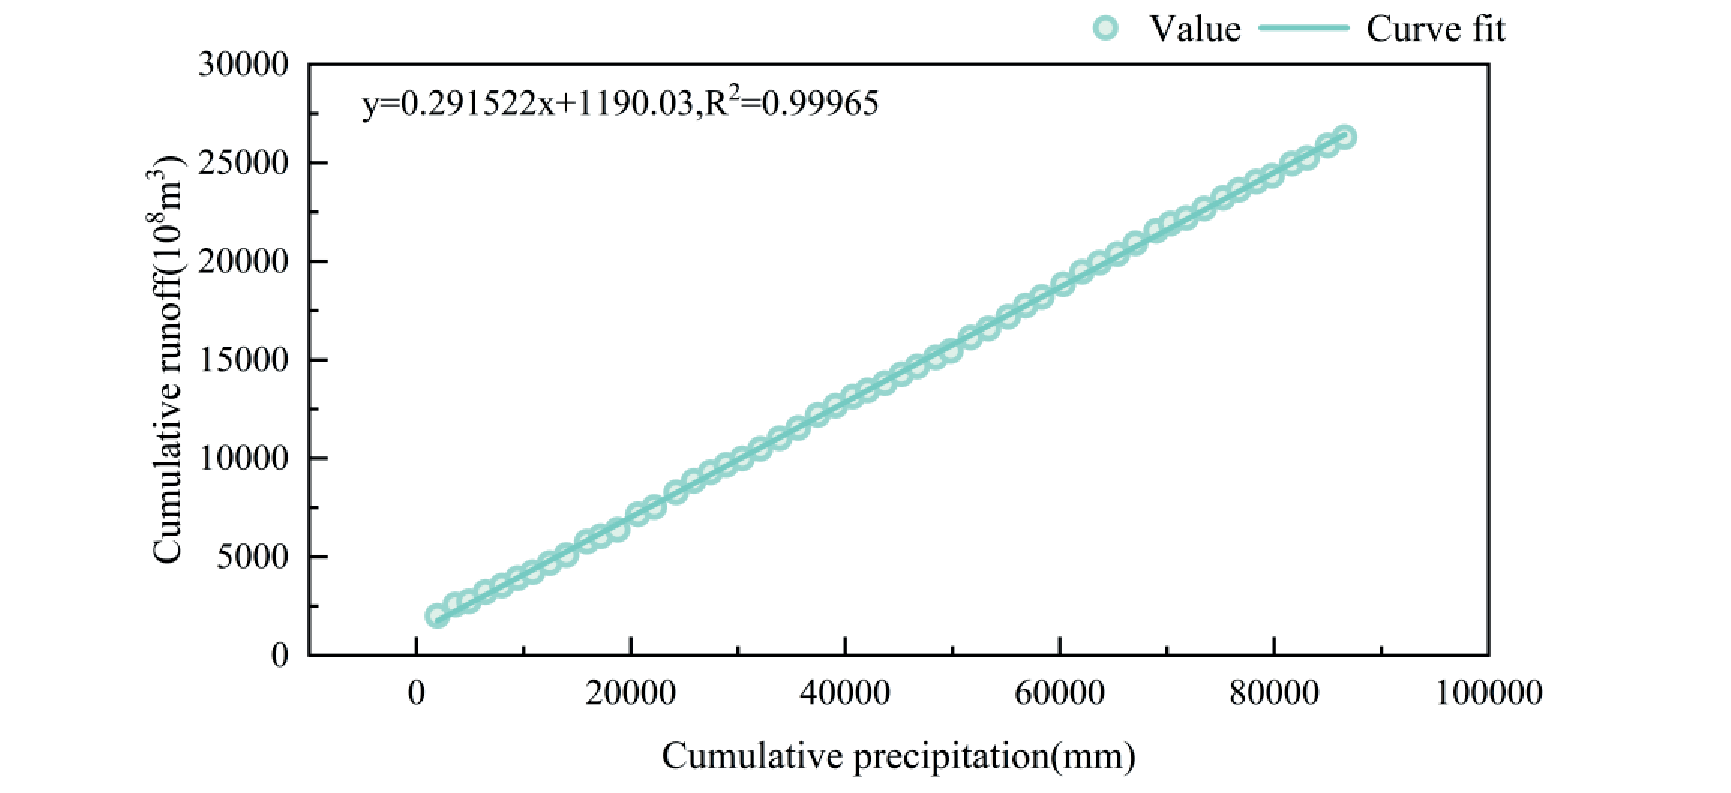
Table 8.
Ganjiang River basin water conservancy engineering facilities.
Fig. 13.
Double accumulation curve relationship of precipitation-sand transport in the Ganjiang River basin.
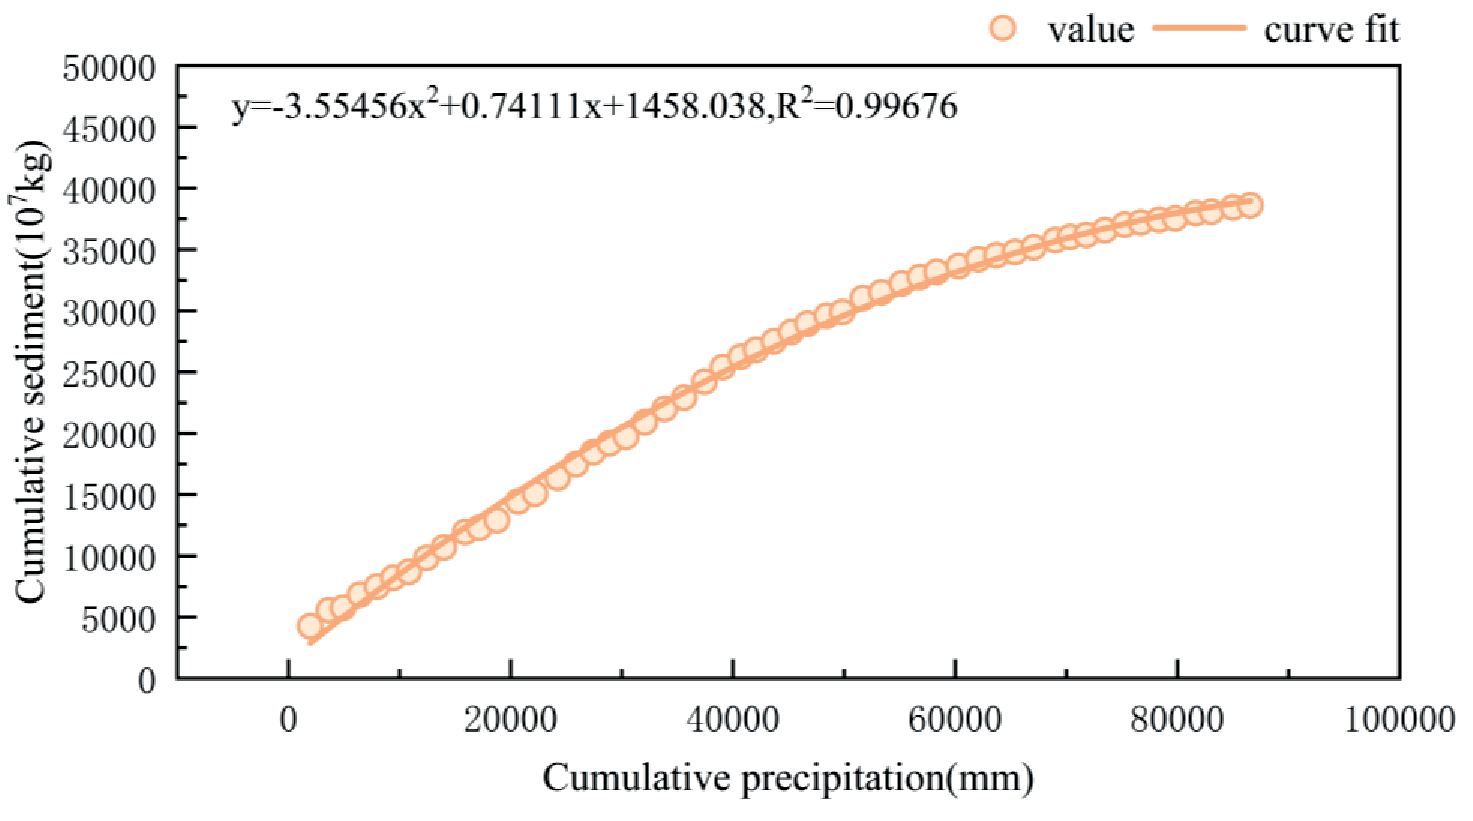
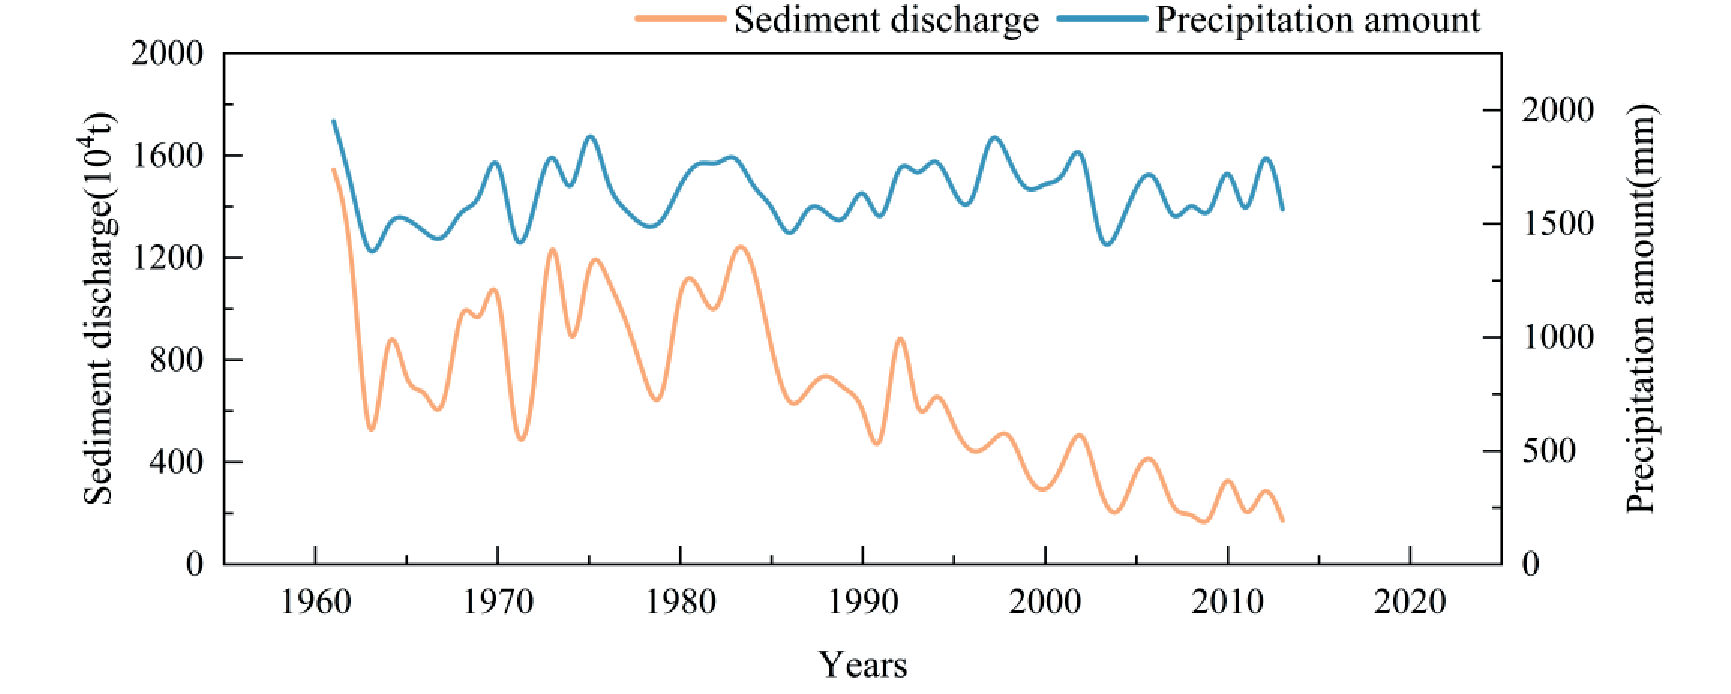
Table 9.
Comprehensive management of soil and water conservation in the upper Ganjiang River area.
Sand mining activities in the river can also affect the amount of sand transported by the river [28, 29]. After 2000, illegal sand mining was banned in the Yangtze River mainstream, and in response to some disorderly mining, indiscriminate mining, and other phenomena, various departments worked closely together to strengthen sand mining management [30]. However, the Ganjiang River basin has seen large-scale sand mining and a decrease in the sand content of the river [31, 32], and the reason for the sudden change in the four upstream stations in 2002 is related to this.
Conclusion
The runoff in the Ganjiang River basin from 1958 to 2019 shows cyclical changes of dry water, flat water, and abundant water. The maximum value of annual runoff in all years occurred in 1973 and the minimum value occurred in 1963, the multi-year average runoff from 1958 to 2019 in the study period was 681.3×10⁸m3, with significant variability over this time period. The average annual runoff in the 1960s and 2000s is less than the multi-year average, the average annual runoff in the 1980s is close to the multi-year average, and the average annual runoff in the 1970s, 1990s, and 2010s is greater than the multi-year average. There was no significant trend in the annual runoff, but all stations experienced a sudden change in 1990.
Mann-Kendall trend tests found that the annual sand transport in all river sections of the Ganjiang basin from 1958 to 2019 showed a significant decrease, but sand transport trends at the four upstream stations were not as significant as Waizhou and Ji'an stations. Sand transport at each station has changed abruptly, during 2002, 1994, and 1997 for the four upstream stations, Ji'an station, and Waizhou station, respectively.
The abrupt change in runoff of the Ganjiang River basin in 1990 is primarily attributed to the impact of precipitation and human activities. Meanwhile, the abrupt change in sand transport is influenced by several human activities, including the construction of the Wan'an Reservoir in Jiangxi Province, which intercepted river water and sediment. Additionally, the development of soil and water conservation projects in the 1980s contributed to increased surface vegetation cover, water conservation, and reduced soil erosion. Furthermore, the impact of sand mining activities also was instrumental in the sudden change in sand transport in the Ganjiang River.

