

Introduction
The constant exploitation of non-renewable resources, such as minerals, has reached a point where the accumulation of mining waste occupies large areas of land for storage. These waste materials are a significant source of pollution of air, water and streams [1]. This is why increasingly, mining industries are interested in technologies that transform mining into an environmentally sustainable activity [2]. However, in Mexico hardly anyone dares to reprocess large amounts of waste that have no use because their benefit is considered “unaffordable” [3]. This makes it necessary to develop processing alternatives that allow the treatment and use of these pollutants, reducing operating costs. This is the reason why researchers are changing the focus of residues to perceive them as new resources that can have a useful application [4]. Even knowing this, the reuse and reprocessing of mining waste largely depends on its practical applications and economic return.
One of the processes required for the solid waste management is the physical separation of the material. In this sense, the use of strong magnetic field gradients and high magnetic fields generated by permanent magnets, has found applications in mining processes [5]. Magnetic separation has been used in physical separation processes of strongly magnetic materials since the mid-nineteenth century [6]. This separation is used as a means of physical separation to separate magnetic materials from non-magnetic materials [7]. Magnetic separation is a clean, pollution-free, low-cost, and high-efficiency method for separating minerals with different magnetic properties [8]. The collection of magnetic particles depends on the creation of a magnetic field, the particle size, and the magnetic properties of the material. For successful collection, the magnetic force of attraction on the particles through the field lines must overcome fluid drag forces, gravitational forces, inertial forces, and diffusion forces, as the particle suspension flows through the separator [9].
One of the concerns for the reuse of these wastes is that some metals and metalloids (such as Cu, Pb, Zn, Ni, Cr, As, Hg and Cd) are toxic in low concentrations [10]. Currently there are investigations that prove the use of magnetic separation for the recovery of As, Cd, Cu, Pb and Zn from polluted sediments, verifying the feasibility of the magnetic separation for metal and metalloid recovery from polluted sediments [11]. Some physical separation methods such as Eddy current separation, have achieved recovery for magnetic metals, such as Fe, Ni, Co, etc. from waste electrical and electronic equipment [12]. Recent research has shown that with magnetic separation it is possible to separate ferrous mixed oxides from mining waste such as ferrosilite (FeO3Si), calcic montmorillonite (Al2Ca0.5O12Si4) and brownmillerite (Ca2Fe2O5) [13].
Magnetic system is the core component of a magnetic separator, there for the design is important to the success of the process [14]. In this research, an alternative low-cost process for the separation of magnetic material in mining waste is presented, with the objective of evaluating the effect of magnetic separation parameters on the concentration and recovery of material. For the tests, neodymium magnets (Nd-Fe-B) were used since they have good properties and a strong magnetic power [15], especially due to an excellent induction/weight ratio and the possibility of implementing them as separators by the wet method. With this, it is expected to build a low-intensity magnetic pre-industrial separator, economical, with the possibility of obtaining a high degree of recovery of fine iron particles, reducing the environmental damage caused by metals contained in these wastes.
In the case of material processing, the industry uses Design of Experiments (DOE) techniques to reduce process variation in an environment where noise factors exist that cannot be controlled due to people, material, machines, etc.; being useful both to explore new processes and to improve existing ones. DOE refers to the process of planning, designing, and analyzing experiments that allow valid and objective conclusions to be drawn effectively and efficiently [16]. Among the DOE techniques, the orthogonal array or Taguchi design is a balanced design in which each factor can be evaluated without considering the other factors, allowing to know the effect of one factor without affecting the estimation of another, reducing time and cost of experimentation, energy, labor and material resources [17]. To determine the optimized control factors for the best performance of the system, Taguchi Design of Experiments and Analysis of Variance (ANOVA) facilitate the systematic approach [18]. The Taguchi design allows determining a process that works with greater consistency in an operating environment, considering that not all the factors that cause variability in the results can be controlled; allowing to identify controllable factors that minimize the effect of noise factors [19].
The influence of the processing parameters on the separation of magnetic particles in mining waste is currently unknown. Therefore, the Taguchi DOE is used to investigate the main effects of processing parameters on the magnetic separation of these waste; said parameters analyzed are the intensity of the magnetic field, the concentration of solids in the slurry and the flow of the material. Four levels were evaluated for each factor, so a Taguchi L16-43 design was used; this notation indicates that the design used has 16 runs and 3 controllable factors with four levels each.
Material and Methods
Device Description
A laboratory magnetic separator (Fig. 1) consisting of two magnetic plates of ~1.3 T Nd-Fe-B permanent magnets was designed, creating a magnetic field of up to ~1.3 T on the surface of the magnets and ~0.5T in the center; two adjustable plates that support the magnets in such a way that the distance between magnets can be adjusted to carry out the experimentation; a stainless steel metal mesh as a matrix to amplify the magnetic field (intensity increased up to 50% in tests) and provide collection sites for magnetic particles; pulp distributors of different sizes (4, 5, 6 and 7 cm) to adjust the distance between the magnets; and a plastic cover for the mesh. A station of magnetic separation was set up (Fig. 1), which consisted of a stirring system using a propeller stirrer; a peristaltic pump calibrated to regulate the flow of the material, the magnetic separation device, and a container of non-magnetic material.
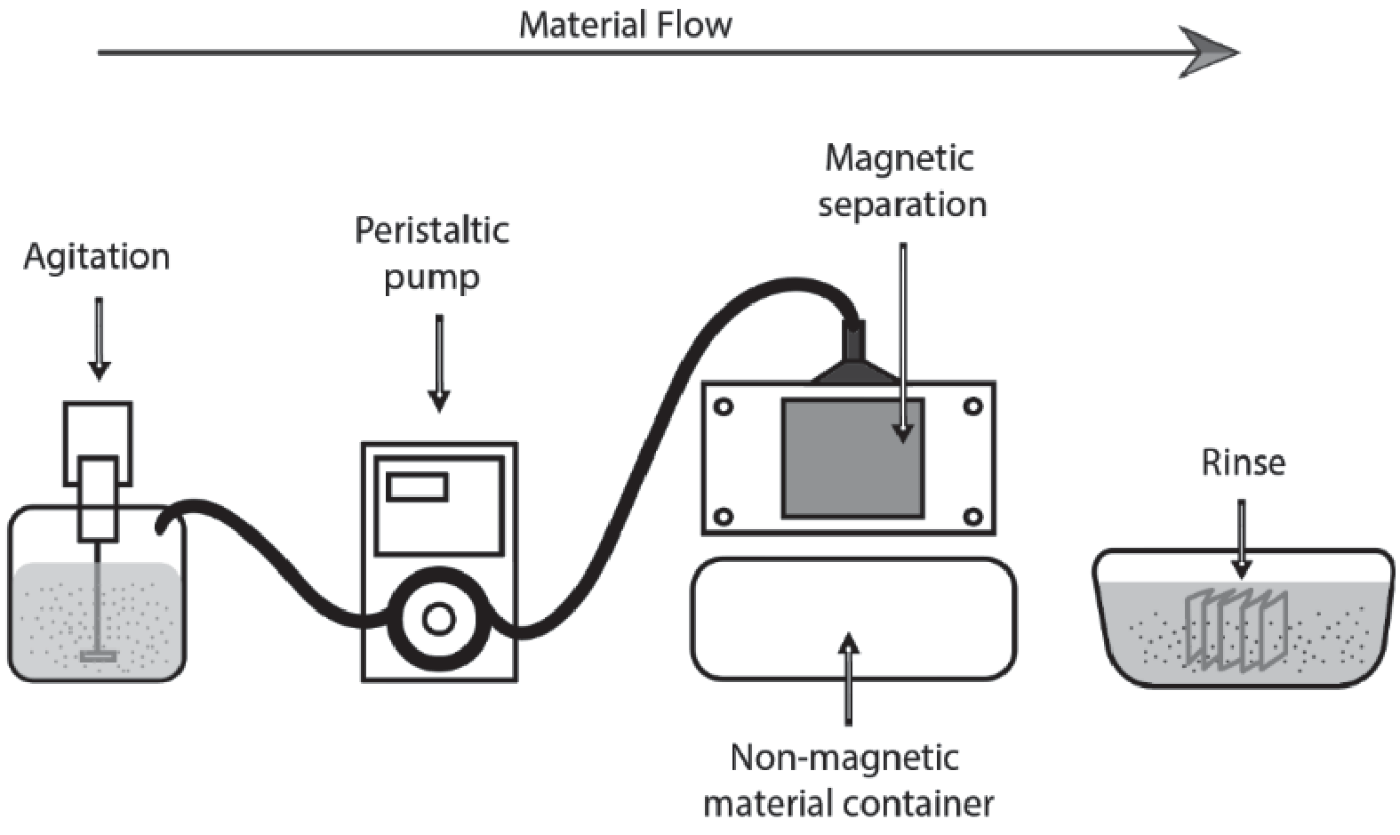
Experimental Design
For the experimental design, a DOE Taguchi L16 43 design was carried out using the statistical program MiniTab, to achieve a process that works with greater consistency, taking into account that the process has noise factors that are not controllable, such as quality and waste components, as they differ between discharge layers. The design was made with K factors of 4 levels each, defining 3 controllable factors (A, B, and C) with 4 levels each, as can be seen in Table 1.
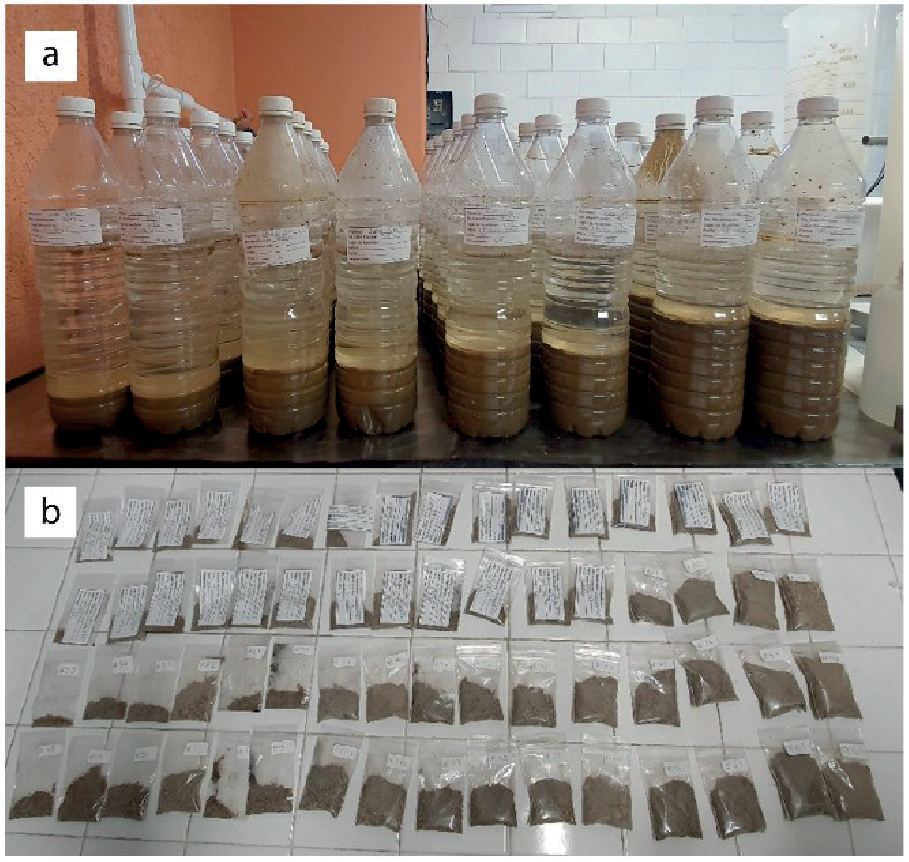
The experimental runs were carried out following the design of experiments designed using the software MiniTab, varying the factors as requested by the experimental plan shown in Table 2. In addition, for each experimental run, 4 trials were made, because the external arrangement considers 2 noise factors with 2 levels each (Table 3); so that, with a 3-factor experiment with 4 levels, it was required to prepare 64 samples in total at different concentrations of solid in water (16 at 20%, 16 at 30%, 16 at 40% and 16 at 50%) (Fig. 2a).
Each sample consisted of one liter of slurry, which were attritioned for 30 minutes in a DENVER flotation cell, bottled and labeled. For each run, the material collected on the mesh was rinsed, dried, and weighed, obtaining 64 samples of dry magnetic powder (Fig. 2b). The weights obtained were recorded to run the analysis.
Subsequently, a laboratory magnetic separation was carried out to evaluate the percentage by weight of the concentration of magnetic material in each sample, thus determining the efficiency of the collection. Laboratory magnetic separation was performed using a neodymium permanent magnet. The procedure was performed 20 times for each sample, to ensure that the largest amount of magnetic particles contained in the sample was collected. The materials obtained were weighed on an OHAUS brand Pioneer precision balance, the weights were recorded to determine the percentage of magnetic particles contained in the material.
Results and Discussion
The objective of the experiment was to determine the key parameters that affect the percentage and quality of the recovery of magnetic particles. The 64 samples were processed making the variations in the corresponding factors, after each run the weights of the dry samples of collected magnetic material were obtained, which can be seen in Table 4. The Minitab software was used for the analysis and the results of the main effects for arithmetic means are shown in Fig. 3.
Table 1.
Taguchi 4k design factors.
Table 2.
Internal arrangement of experimental plan based on Taguchi L16.
Table 3.
External arrangement of experimental plan based on Taguchi L16
| External arrangement | ||||
|---|---|---|---|---|
| % magnetics in the sample | Low | High | Low | High |
| Accumulation of particles | High | High | Low | Low |
| Y1: Trial 1 | Y2: Trial 2 | Y3: Trial 3 | Y4: Trial 4 | |
As can be seen, the higher the magnetic field (Factor A), the greater the collection by weight of magnetic material. In addition, since factor B involves the concentration of solid material in the pulp, it can be observed, as expected, that the higher the concentration, the greater the collection of magnetic material; however, this does not reflect the quality of sample collection. With the results of factor C, it can be seen that the higher the material flow rate, the less magnetic material is collected, so the time that the particles have to adhere to the mesh influences the amount of material collected.
As shown in Fig. 3, the greatest collection of mass occurs with an A4 magnetic field of 79-1230 Gs (see Table 1), a B4 concentration of 50% and a C2 flow of 772 ml/min. However, in the main effects plot for standard deviation (Fig. 4), the smallest deviation is found with an A1 magnetic field of 60-900 Gs, a B1 concentration of 20% and a C2 flow of 772 ml/min, which indicates that, with these parameters, the system is more consistent. This analysis allowed us to verify the correct operation of the Magnetic Separation System, also showing that the intensity of the magnetic field and the speed of the flow are influential factors in the amount of sample collected.
To identify the effect of these factors on the quality of magnetic material collection, the quality of the magnetic content of the collected magnetic material was determined by manual laboratory magnetic separation using the following equation:
Where WT is the total weight of the sample (gr) and WMP is the weight of magnetic particles contained in the sample (gr). So that the percentage by weight of the concentration of magnetic particles in each sample was obtained. Table 5 presents the experimental scheme with the factors and the results in separation quality of the magnetic particle samples collected with the separator. In this way, there is a value that allows an effective comparison between the parameters, regardless of the amount of magnetic particles contained in each sample. With the data obtained, the statistical analysis was run again, Fig. 5 presents the main effects plot for these data, where it can be seen that the highest magnetic concentration occurs with a magnetic field A2 of 65-1075 Gs (see Table 1), a concentration B1 of 20% and a flow C4 of 1169 ml/min.
Fig. 2.
a) pulp samples at different concentrations, b) dry samples obtained with the collection of the magnetic separator.
However, in the main effects plot for standard deviation (Fig. 6), the smallest deviation is found with an A4 magnetic field of 79-1230 Gs, a B3 concentration of 40%, and a C1 flow of 662 ml/min, which indicates that, with these parameters, the system is more consistent. This graph also shows that the average standard deviation is 2.8, so the concentration of magnetic particles in the process samples can fluctuate ±2.8%.
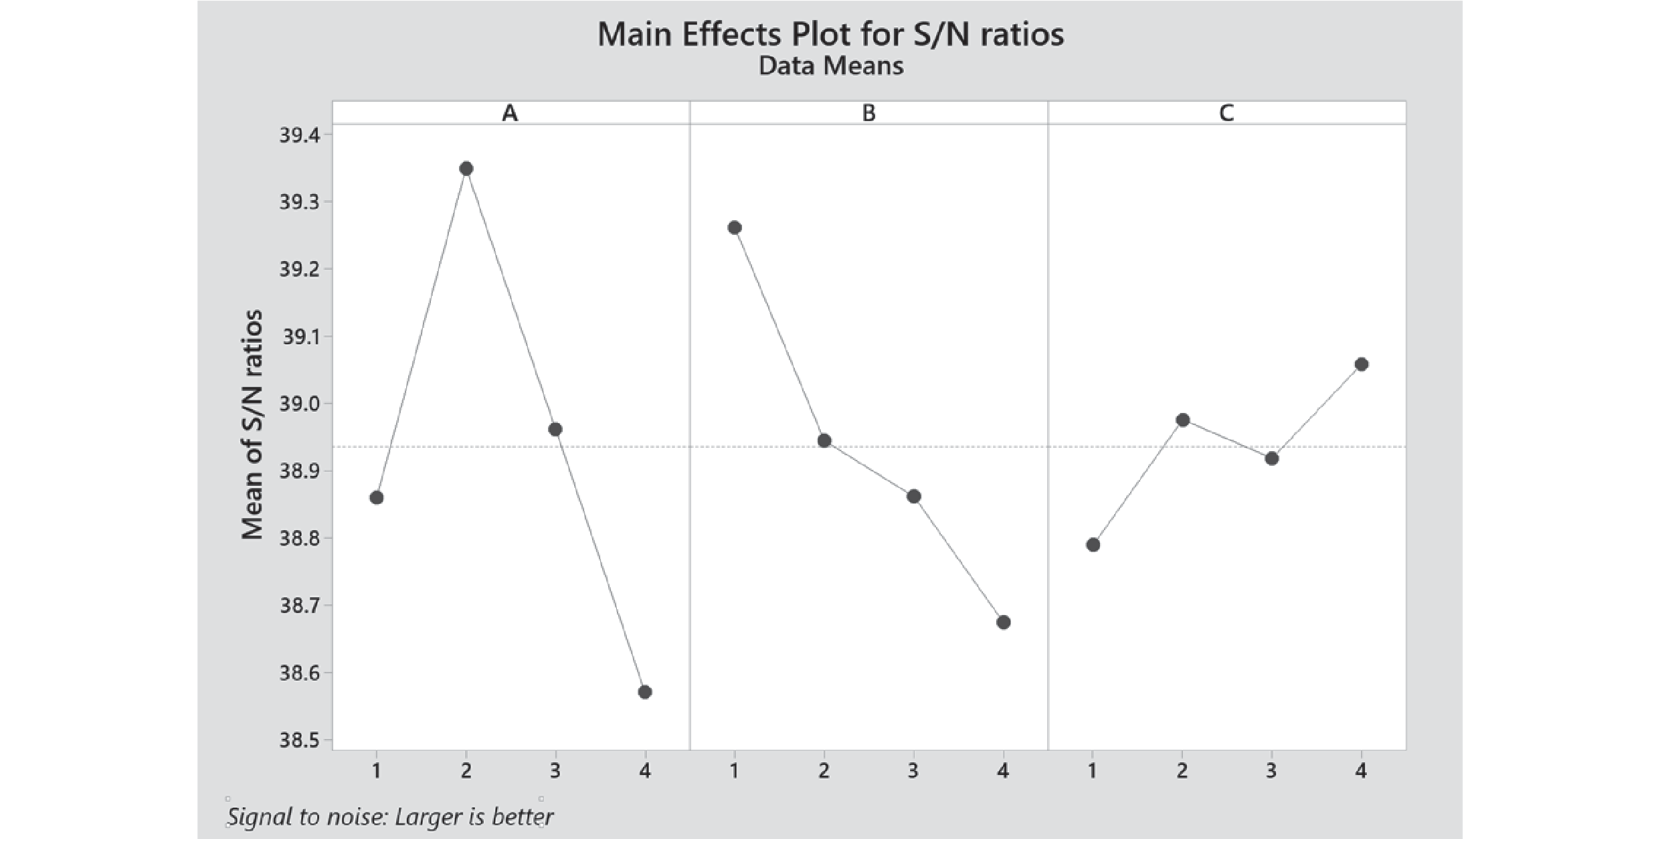
The response variation using S/N ratio is important because it can minimize variations in Quality due to uncontrollable parameters [20]. Where S (signal) is the desirable value and N (noise) is the undesirable value. The quality of the separation must be as high as possible, therefore the S/N ratio “larger is better” was used, which was calculated with the following equation [21]:
Where yi = experimental results, and n = number of experiments. The main effect plot for the S/N ratios is presented in Fig. 7. In the main effect plot, the factor with the larger S/N ratio has the better-quality characteristic. Fig. 7 reveals that the optimal stability for quality is obtained with factor A2 of 65-1075 Gs, a concentration B1 of 20% and a flow C4 of 1169 ml/min. In this plot, if the line for a certain factor is near horizontal, the factor has no significant effect on the response, and the factor with the highest slope of the line has the most considerable effect. It can be observed that the factor with the greatest effect on the response is factor A and the factor with the least effect on the response is factor C, data that is corroborated with the analysis of variance.
Table 4.
Experimental layout of Taguchi L16 (43) orthogonal array and results for weights of the dry samples.
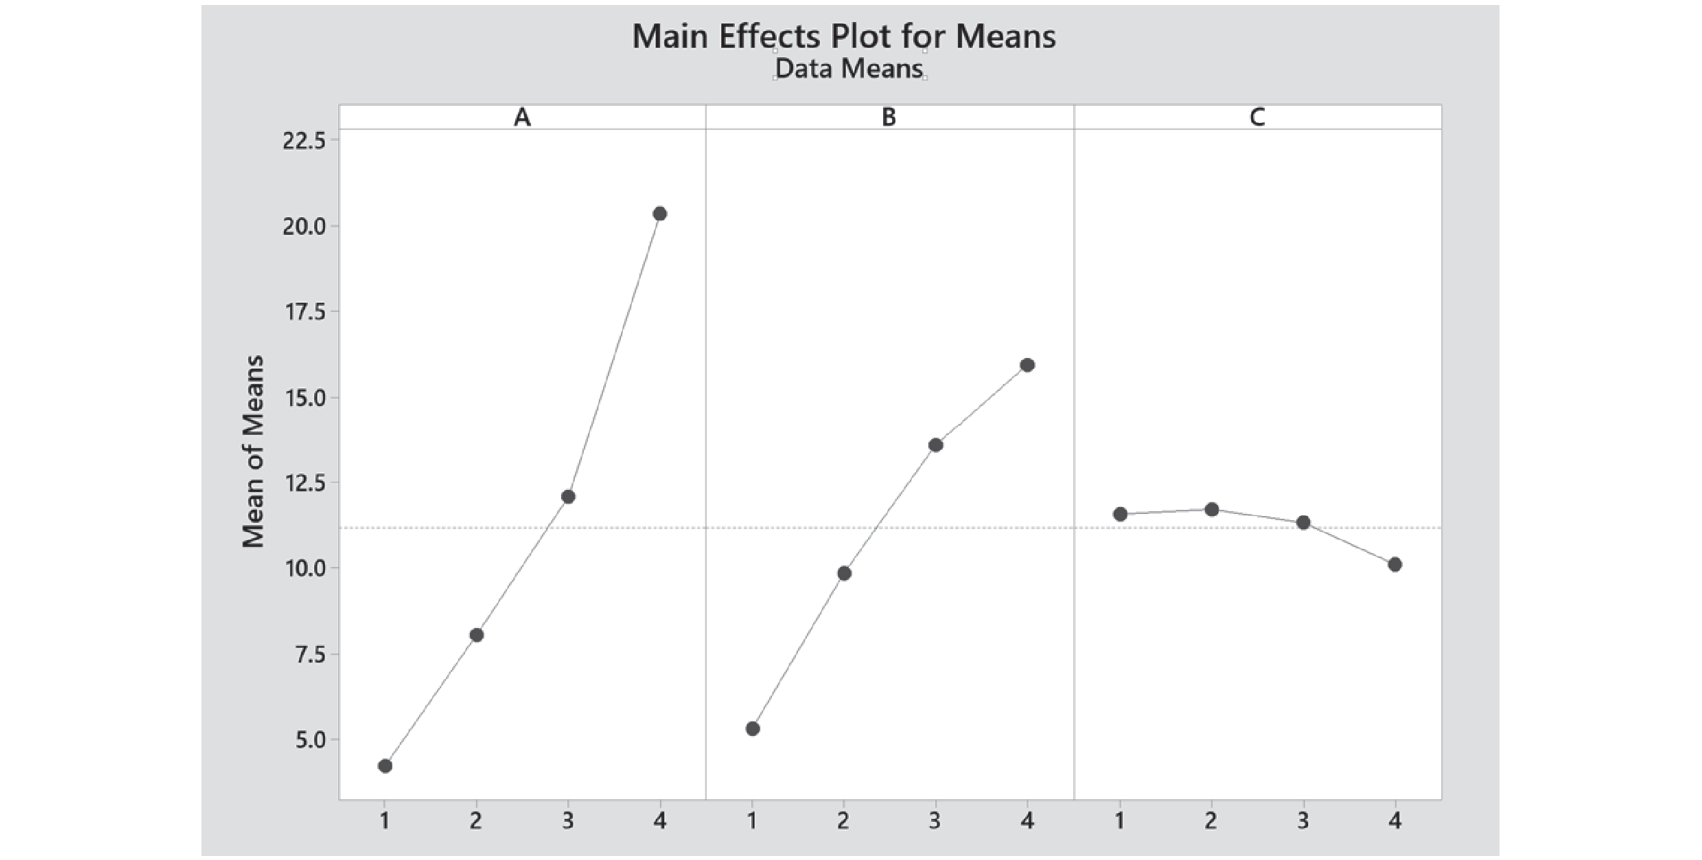
Fig. 4.
Main effects plot for standard deviation with respect to the total weight collected in each sample.
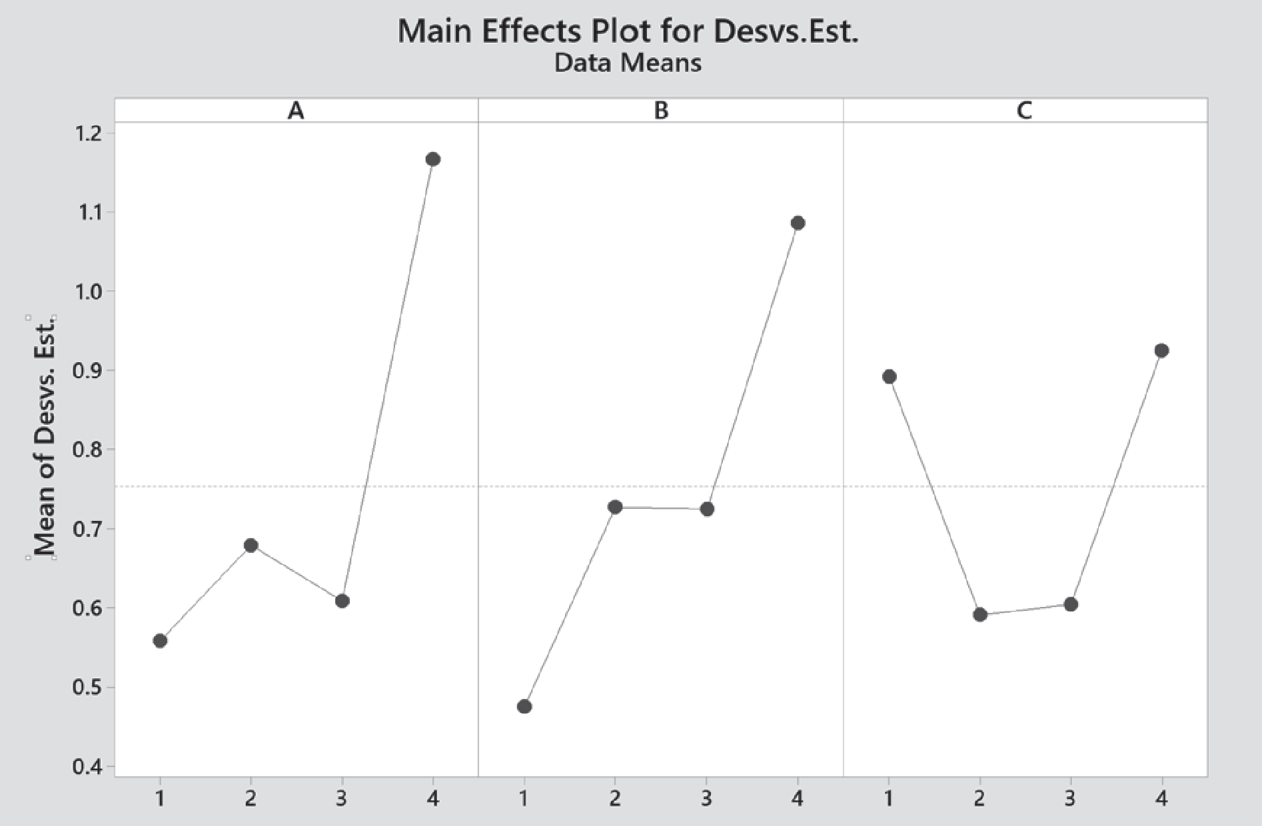
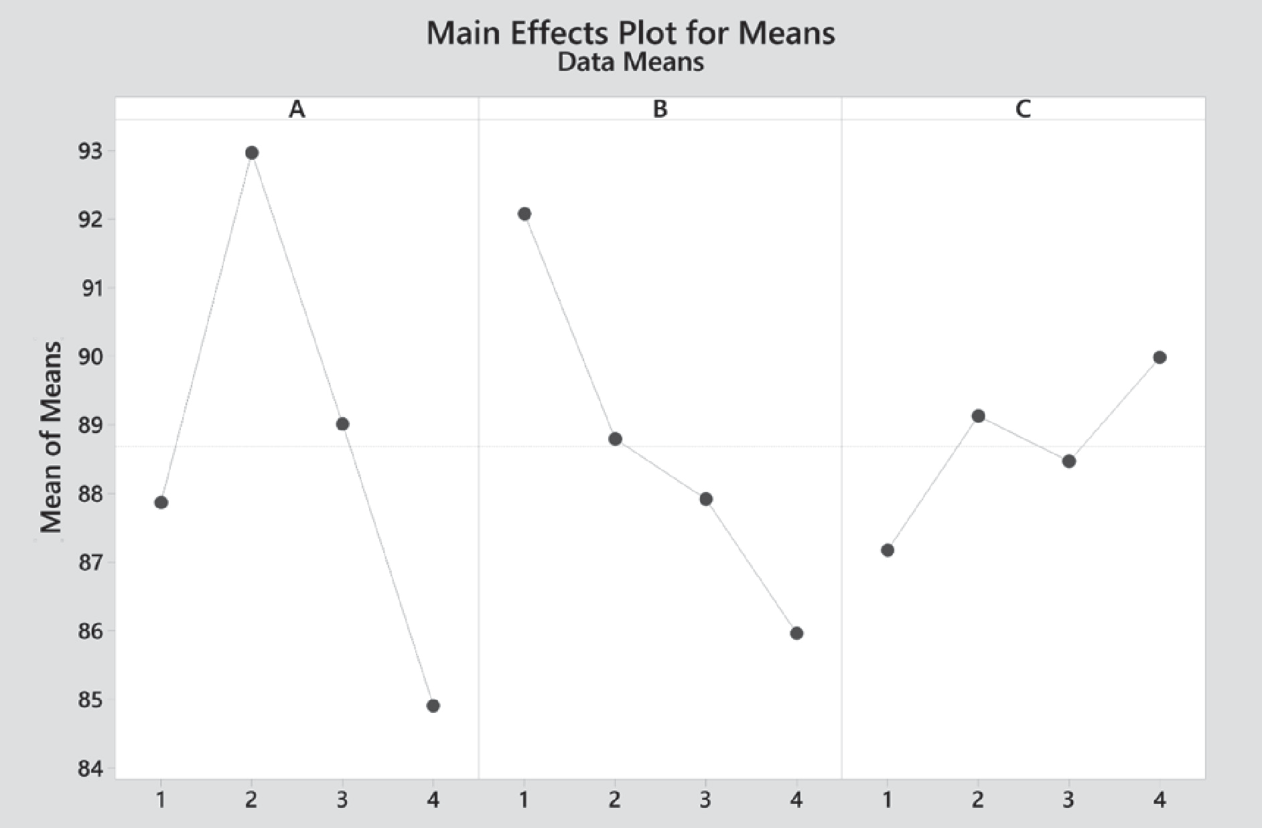
Table 5.
Experimental layout of Taguchi L16 (43) orthogonal array and results for magnetic percentages of the dry samples.
The Analysis of Variance (ANOVA) of means (Table 6), is evaluated for a confidence level of 95% (α = 0.05), so a factor with a P-value less than 0.05 is considered to have statistically significant contribution to the response parameter. The percentage contribution of P was determined using the following equation:
Fig. 6.
Main effects plot for standard deviation with respect to the magnetic concentration in the samples.
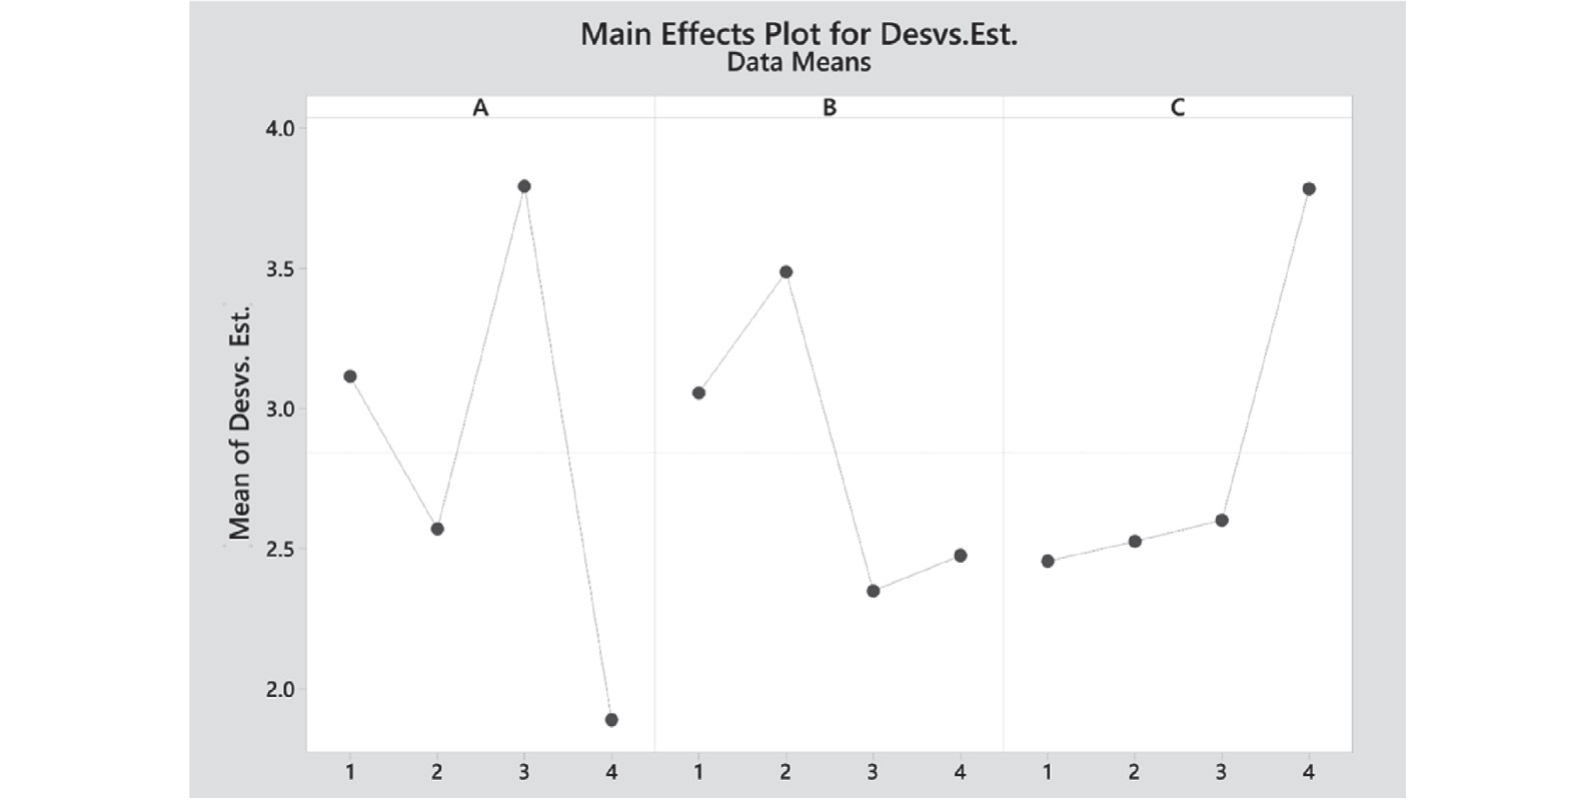
Table 6.
Analysis of Variance of Means.
| Source | DF | Seq SS | Adjs SS | Adj MS | F | P | Contribution (%) |
|---|---|---|---|---|---|---|---|
| A | 3 | 133.66 | 133.66 | 44.554 | 9.40 | 0.011 | 51.99 |
| B | 3 | 78.10 | 78.10 | 26.033 | 5.49 | 0.037 | 30.38 |
| C | 3 | 16.89 | 16.89 | 5.629 | 1.19 | 0.391 | 6.57 |
| Residual Error | 6 | 28.44 | 28.44 | 4.741 | 11.06 | ||
| Total | 15 | 257.09 | 100 |
As shown in Table 6, the factors that have a p-value less than 0.05 are factor A: magnetic field (p = 0.011) and B: concentration (p = 0.037). Consequently, these two factors are statistically significant at a significance level of 0.05. The contribution percentage of each factor is 51.99% for factor A, 30.38% for factor B, and 6.57% for factor C, which makes it clear that the factors with a significant effect on the quality of magnetic particle collection are factors A and B.
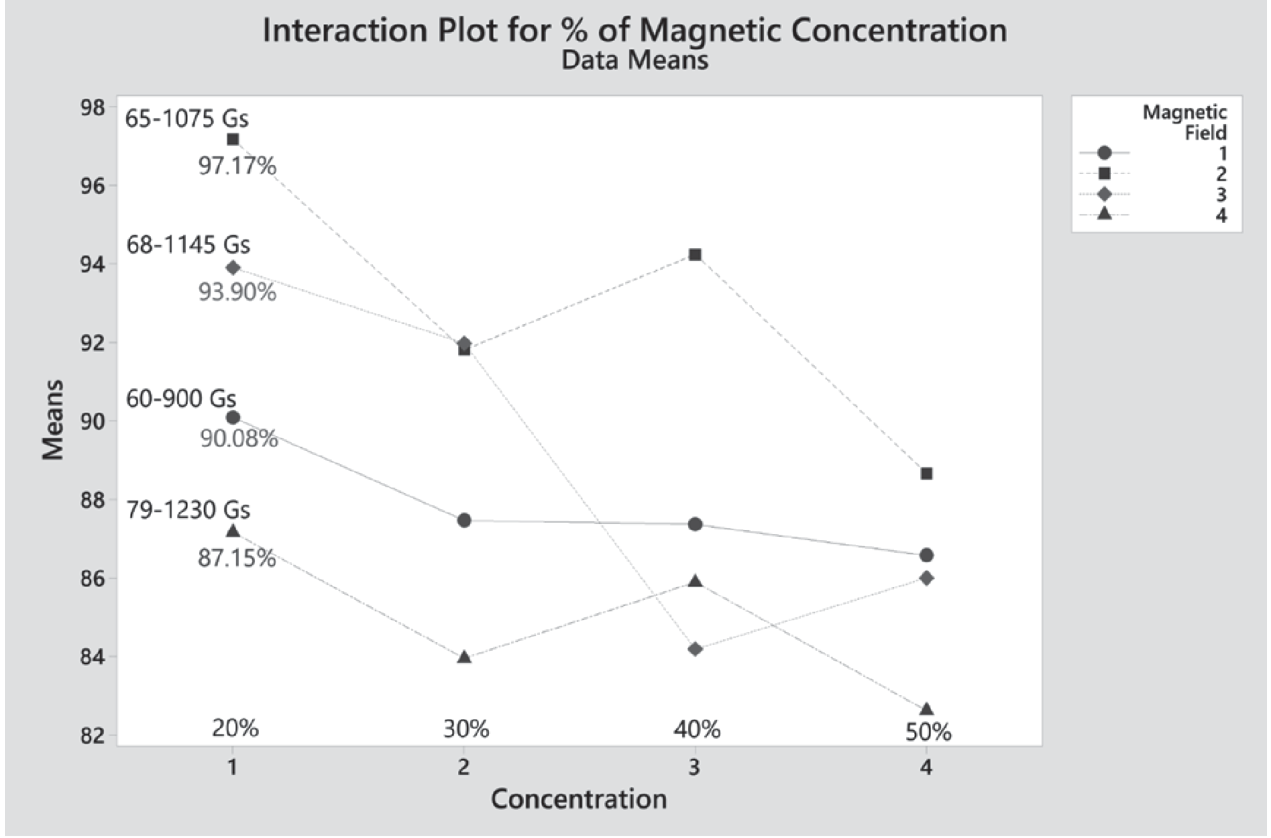
With the statistically significant parameters (A & B), the interaction analysis was performed to assess the quality of magnetic separation that can be achieved with this process. As can be observed in the Interaction Plot of statistically significant factors for % of Magnetic Concentration (Fig. 8), the interaction of factor A2 (65-1075Gs) with B1 (20%), reaches a quality in the magnetic separation of 97.17% which is acceptable to think about transferring this process to an industrial scale. Since the lines on the plot are not parallel, the interaction effect indicates that the relationship between quality of the magnetic separation and concentration (B) depends on the value of the magnetic field (A). These results are consistent with other studies where it has been demonstrated that even micron-order grains can be thoroughly separated without sample-loss by the low field produced by neodymium (Nd-Fe-B) magnets during short duration microgravity (μg) [22].
Conclusions
This paper describes a device inexpensive and easy to operate for magnetic separation, the DOE Taguchi L16 43 was used to evaluate the effects of magnetic field parameters, concentration of solids in pulp, and material flow in the process of magnetic separation of mining waste. 64 samples were run at different concentrations and data on the magnetic concentration of the samples were recorded. The controllable factors that are statistically significant at a significance level of 0.05, are the magnetic field (A) and the concentration of the material (B). The parameters with which the highest quality in the magnetic separation was obtained are a magnetic field A2 of 65-1075 Gs, a concentration B1 of 20% and a flow C4 of 1 169 ml/min. The results show that in this magnetic separator, the implementation of a stainless-steel metal mesh as a matrix to amplify the magnetic field, can cause the accumulation of non-magnetic particles when the distance between magnets is less than 6 cm, reason why the higher magnetic fields gave a lower quality in the magnetic concentration of the samples. These results will be used for the manufacture of a continuous flow magnetic separator for the reprocessing of mining waste powder.

