

Introduction
Land is a precious resource that humans rely on for survival, and all human production and living activities utilize land resources [1]. However, with the rapid socioeconomic development of China, the ecological landscape is becoming increasingly severe. With the requirements of the “Five in One” development strategy and sustainable development, as well as the continuous promotion of the integration of urban agglomerations into the construction of a “two-oriented society” process [1, 2], improving and addressing land ecological security issues has received widespread attention [3]. Therefore, as the first step in solving this problem, evaluating and analyzing the land ecological security patterns reasonably is particularly important.
Due to the late start in exploring land ecological security evaluation research in China, this research is still in the exploratory stage [4]. Existing research has primarily constructed an urban land ecological security evaluation system considering three dimensions: natural factors, economic factors, and social factors [5-8]. Reference [9] revealed the differentiation information of indicators by establishing a matter element model and evaluating the ecological level of urban land using empirical research methods. Zhang constructed an evaluation index system consisting of a target layer, project layer, factor layer, and indicator layer from three perspectives: resource and environmental pressure, resource and environmental conditions, and human environment response. They subsequently established a comprehensive model for analyzing cities such as Beijing and Shanghai [10]. In recent years, with the continuous development of machine learning, methods integrating land ecological security and machine learning have also received increased attention from scholars. For example, in reference [11], a BP neural network was used in the machine learning framework Keras to evaluate the land ecological security level of the Wuhan urban agglomeration from 2010 to 2017. Based on these findings, ArcGIS software was used to spatially identify the evaluation results, and corresponding land ecological security optimization strategies were proposed.
However, existing research methods often involve simply introducing machine learning methods without identifying or selecting machine learning methods that are suitable for land ecological security evaluation. The available sample size for learning in the land ecological security field is small, which is not suitable for most machine learning methods, and relatively little research has been conducted on Zhejiang Province [12-15]. Therefore, based on existing research, in this article, evaluation indicators that include naturalness, economy, and sociality are first constructed. Then, the advantages and disadvantages of the three types of machine learning methods are compared, and a support vector machine suitable for small samples with high data dimensions is selected as the machine learning method. Finally, the land ecological security pattern of the urban agglomeration in Zhejiang Province is evaluated and analyzed, and optimization strategies are proposed.
Methods
Construction of the Evaluation Index System
“Land Ecological Security” refers to the ability of land-based ecosystems to maintain their structural and functional integrity in the face of environmental changes and human impacts. This concept emphasizes the importance of sustaining land health and productivity to ensure that essential ecological processes, such as nutrient cycling, soil formation, and habitat provision, are preserved. It encompasses strategies to mitigate risks such as soil degradation, contamination, and habitat loss, aiming to protect and enhance the resilience of land areas so they can continue to support biodiversity, agricultural productivity, and human well-being. Based on this definition, the urban land ecosystem is a complex system of interactions between various biotic and abiotic elements in urban areas that include the mutual influences of natural ecology and human construction. These influencing factors are mainly categorized into natural factors, social factors, and economic factors, which are coupled with, influence, and provide feedback to each other, forming a complex urban land ecosystem. Therefore, the evaluation indicators selected in this article can be divided into natural evaluation indicators, social evaluation indicators, and economic evaluation indicators. Compared with the original index selection scheme, this paper uses the Construction Indicators of Ecological Counties, Ecological Cities, and Ecological Provinces (Revised Draft) and the Series Standards of National Garden Cities as guidance and directly selects the indicators of the Chinese government when assessing the level of land ecological security. Based on this, it can be better to provide a more comprehensive understanding of the drivers that affect land ecological security in urban environments, and the final selected indicators are shown in Table 1.
Data Collection and Preprocessing
To analyze the spatiotemporal pattern of land ecological security, data samples must be sampled in both spatial and temporal dimensions. To ensure that the temporal and spatial dimension indicators show significant changes, the temporal sampling interval is selected to be 2 years in this paper, and the spatial dimension is divided by the actual administrative regions under its jurisdiction.
Due to the large number of indicators mentioned above, which come from different fields and have different dimensions, to eliminate the influence of dimensions for unified analysis, the maximum value is used as the standard for data normalization. Notably, to enable the analysis of the spatiotemporal distribution pattern of soil ecological security, the maximum value selection must include indicator data from the entire year. The specific formula is shown in Equation (1):
In this equation, Xi* represents the normalized indicators, Xi represents the data before normalization, and Xmax represents the maximum total sample value.
Table 1.
Summary of evaluation metric selection.
Table 2.
Learning sample classifications.
Moreover, to correctly evaluate the land ecological security pattern, in this article, land ecological security registration is divided into five levels, and 21 indicators are selected. The samples were manually divided and constructed based on the quartiles of each indicator. The minimum value corresponds to the unsafe level, the first quartile corresponds to the relatively unsafe level, the second quartile corresponds to the critical safe level, the third quartile corresponds to the relatively safe level, and the maximum value corresponds to the security level. The specific details are shown in Table 2.
Table 2 shows that the constructed learning samples contain only five pieces of data. To meet the sample size requirements of machine learning, interpolation expansion is needed for the samples. Because the quantiles of the sample data are not simply linearly related, segmented interpolation is used to expand the learning sample size from 5 to 50. Segmented interpolation [16] is a method adopted to mitigate the disadvantages of higher-order interpolation polynomials. The interpolation interval is divided into several subintervals, and a low-degree interpolation polynomial is constructed for each subinterval. This approach yields a better approximation, especially as the number of nodes gradually increases and the interpolation curve becomes more stable at the edges. At this point, the learning samples have been constructed.
Comparison of Machine Learning Methods
In the field of machine learning, support vector machines (SVMs), random forests, and neural networks are widely used in data modeling and classification tasks. These three methods represent different learning paradigms and algorithm strategies, and each has unique advantages and disadvantages [17].
Neural networks [18-20] simulate the structure of human brain neurons and have strong learning ability and adaptability. Neural networks perform well when handling complex nonlinear relationships, but their adaptability to small sample sizes and high-dimensional datasets is relatively weak. Neural networks require a large amount of training data, and selecting and adjusting the model parameters is relatively cumbersome. The random forest algorithm is an ensemble learning-based method that improves the robustness and generalizability of a model by constructing multiple decision trees and synthesizing their prediction results. The random forest algorithm is suitable for processing high-dimensional data and large-scale datasets and has high efficiency during training [21].
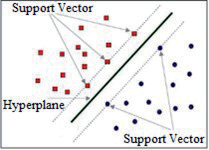
SVMs are renowned for their powerful classification performance in high-dimensional spaces. In SVMs, an optimal hyperplane is identified between data points to effectively separate different categories, as shown in Fig. 1. SVMs perform well in small sample scenarios and can map data to high-dimensional space through kernel functions to achieve linear separability, giving them good generalizability in nonlinear high-dimensional feature scenarios [22-24].
In summary, considering that 22 indicators were selected for the analysis of land ecological security patterns and given the high feature dimensions, only 5 effective source data points, and only 50 data points after interpolation expansion, the ability of SVMs to process small samples of high-dimensional feature data highly aligns with the needs of the scenario in this article. Therefore, in this article, SVM is chosen as the machine learning method for subsequent research.
Analysis
Introduction to the Analysis Area
Zhejiang Province is located in the southeastern coastal region of China and belongs to the subtropical monsoon climate zone, covering an area of approximately 109000 square kilometers. Its flat terrain, well-developed water system, and abundant natural resources effectively support transportation and economic development. Zhejiang Province governs 11 prefecture-level administrative units, including Hangzhou, Wenzhou, Ningbo, and Jinhua.
As one of China’s strong economic provinces, Zhejiang has become an important center of the Chinese economy due to its large economic output and sustained and stable economic growth rate. Social development in Zhejiang is showing a trend of diversification and openness, with a high level of urbanization and close economic connections forming between cities. This development trend has attracted many people to Zhejiang for development. As of the end of 2021, the total population of Zhejiang Province had reached approximately 53 million.
However, with the rapid advancements of industrialization and urbanization, excessive land development and pollution have become the main factors restricting sustainable development. The decreasing agricultural land area and increasing ecosystem damage and soil pollution, among other issues, are becoming increasingly prominent, posing major challenges to land ecological security. Therefore, an in-depth analysis of the ecological security patterns in the region must be urgently conducted. This analysis helps to comprehensively illustrate the importance of rational utilization of land resources and healthy maintenance of ecosystems and provides a scientific basis for formulating sustainable development strategies.
The relevant data in this article is sourced from official reports such as the Zhejiang Statistical Yearbook, the China Urban Statistical Yearbook, the 14th Five Year Plan for Energy Development in Zhejiang Province, and the Zhejiang Low Carbon Development Report. Some of the data are sourced from the official websites of various statistical bureaus in Zhejiang Province. To form the basic data of this article, the above sources are summarized, and indicators are extracted.
SVM Multi-Classification Model Structure
SVM is usually a binary classification algorithm, but it can be roughly extended to multiclassification problems. In this paper, the SVM multiclassification OAA (One Against-ALL) method, which has high recognition accuracy in small sample environments, is adopted. The OAA method includes two main steps: First, a binary classifier is trained for each category, treating that category as a positive example and all the other categories as negative examples. During testing, the category corresponding to the classifier with the highest decision value is selected as the final classification result. The multiclassification problem is then converted into multiple binary classification problems. Because land ecological security is classified into five levels in this article, five SVM binary classifiers must be constructed with the same structure but different data labels.
The key parameters of the SVM classifier are set as follows:
(1) Kernel function: Commonly used kernel functions include the linear kernel function, polynomial kernel function, and radial basis function (RBF). In nonlinear situations, the best-performing RBF kernel function is typically used. The corresponding kernel function is represented as follows:
In the equation, Zj and Zi are input vectors, and σ is the Gaussian function standard deviation.
(2) Penalty parameter C: Parameter C controls the degree of punishment for misclassification. A smaller C value can lead to smoother decision boundaries and tolerate more misclassification; this is suitable for situations with high data noise. A larger C value forces the model to classify each sample as accurately as possible, which may lead to overfitting. In this article, the optimal C value of 0.1 is selected through cross-validation.
(3) Hyperparameters: SVM uses an optimization algorithm called sequential minimum optimization (SMO). In contrast to traditional neural network training, standard SVM libraries and implementations do not require setting parameters similar to the number of training iterations and batch size in neural networks. Personalized configurations must be constructed only for hyperparameters similar to gradient descent, including the learning rate and number of iterations. In this article, the default hyperparameter values are adopted.
Results
The Temporal Trend of the Land Ecological Security Pattern in Zhejiang Province
In this article, the TensorFlow framework in Python is used to construct an SVM multiclassifier, with learning samples used as training samples for SVM multiclassifier training. 22 indicator vectors from various cities in Zhejiang Province in 2015, 2017, 2019, and 2021 were used as data inputs to determine the land ecological security level of the Zhejiang urban agglomeration, as shown in Table 3.
As shown in Table 3, the land ecological security level did not significantly change in most cities from 2015 to 2017; however, in 2019, the land ecological security levels of all cities except Jinhua City and Taizhou City decreased. In 2021, the land ecological security levels significantly changed only in Jiaxing City. Overall, from 2015 to 2021, the land ecological security level in Jiaxing City first increased, then increased, and finally recovered to a relatively safe level. The security levels of Taizhou City and Jinhua City significantly improved from 2015 to 2021, increasing by one level and reaching the critical safe level. The security levels of all other cities decreased by one level, and the land ecological security levels were generally low. The land ecological security levels of Huzhou City and Zhoushan City even decreased to the least safe level.
The Spatial Distribution Trend of Land Ecological Security Patterns in Zhejiang Province
To analyze the spatial distribution trend of the land ecological security pattern in Zhejiang, the evaluation results in Table 3 were combined with a spatial distribution map of the land ecological security pattern in Zhejiang, as shown in Fig. 2.
Table 3.
Summary of evaluation metric selection.
| City | 2015 | 2017 | 2019 | 2021 |
|---|---|---|---|---|
| Hangzhou City | 4 | 4 | 3 | 3 |
| Ningbo City | 2 | 2 | 3 | 3 |
| Wenzhou City | 4 | 4 | 3 | 3 |
| Jiaxing City | 4 | 4 | 3 | 4 |
| Huzhou City | 2 | 2 | 1 | 1 |
| Shaoxing City | 4 | 4 | 3 | 3 |
| Jinhua City | 2 | 2 | 3 | 3 |
| Quzhou City | 4 | 4 | 2 | 2 |
| Zhoushan City | 2 | 2 | 1 | 1 |
| Taizhou City | 2 | 2 | 3 | 3 |
| Lishui City | 2 | 2 | 2 | 2 |
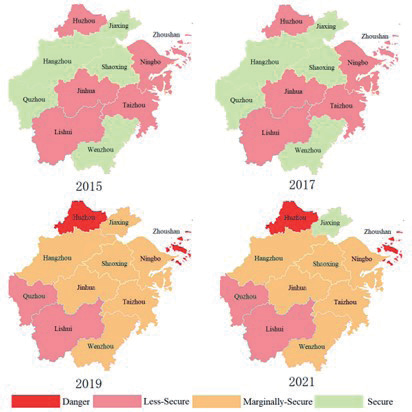
The graph shows that from 2015 to 2017, for the north-south pattern, the land ecological spatial security level in northern Zhejiang Province was greater than that in central and southern Zhejiang Province, excluding Huzhou City in the northernmost part and Wenzhou City in the southernmost part. Similarly, for the east-west pattern, the land ecological spatial security level of the western region of Zhejiang Province was slightly greater than that of the eastern region. From 2019 to 2021, the land ecological space security level in the southwest was lower than that in the central, southern, and northern regions, except for Huzhou, while in the easternmost part, the level in Zhoushan city was generally lower than that in the other regions.
Reasons for Changes in the Ecological Security Pattern of Land in Zhejiang Province
To analyze in depth the reasons for the changes in the land ecological security pattern of the Zhejiang urban agglomeration, the change trends are examined using naturalness, economy, and sociality indicators. First, the land ecological security level change trends corresponding to the three categories of indicators are trained based on the SVM model, as shown in Table 4.
The results in Table 4 show that the naturalness index is strongly correlated with the overall land ecological security level, and the spatiotemporal distribution patterns of the two indices are consistent; that is, the change in the naturalness index is the dominant factor in the changes in the overall land ecological security level. The source data collected in this article indicate that between 2015 and 2021, the per capita arable land area and the proportion of arable land area in most cities with declining ecological security levels for the land significantly decreased, while the emissions of industrial wastewater and industrial smoke (powder) dust slowly increased.
The trend of changes in the economic indicators shows that all cities are slowly improving, which is inconsistent with the distribution pattern of the overall land ecological security level. That is, the impact of economic indicators on the overall land ecological security level is relatively small. Analyzing the source data collected in this article reveals that from 2015 to 2021, the per capita GDP, disposable income of rural residents, proportion of the tertiary industry, per capita GDP, and total road freight volume in economic indicators increased annually, while the trend of energy consumption per 10 thousand yuan of GPD was consistent with the trend of changes in land ecological security levels.
The trend of changes in social indicators shows that except for Jinhua and Shaoxing, the distributions of land ecological security levels in other cities are relatively consistent, indicating that social indicators have a certain impact on the overall land ecological security level. Analyzing the source data collected in this article showed that the per capita water resources in social indicators are positively correlated with the land ecological level but strongly negatively correlated with the proportion of urban construction land and per capita residential area.
Table 4.
Trends of changes in three major indicators.
Conclusions and Optimization
Conclusions
In this article, a land ecological security pattern evaluation system that includes natural, economic, and social indicators is constructed. Using the TensorFlow framework in Python, an SVM multiclass trainer is designed, and the learning samples are interpolated and expanded to serve as training input. Finally, the model is used for land ecological security pattern evaluation in the Zhejiang urban agglomeration. The conclusions of this paper are as follows:
(1) The land ecological security level in the Zhejiang urban agglomeration generally declined between 2015 and 2021, and the land ecological security levels in most cities were relatively low, mostly at the critical safe level.
(2) The land ecological security pattern of the Zhejiang urban agglomeration has changed from the original pattern of “higher in the north and south, lower in the central level” to the current pattern of “lower in the southwest, slightly higher in other areas, and extremely low in a few areas (Huzhou city, Zhoushan city)”.
(3) The natural indicators, some social indicators such as per capita water resources and per capita living area, and the economic indicator of energy consumption per 10000 yuan of GDP are important factors in land ecological security pattern changes.
Optimization Strategy
(1) Improving the legal system: Improving the legal system is the primary task for ensuring land ecological security. The government should formulate and strengthen relevant regulations, regulate land use behavior, and increase the costs of illegal activities. By revising laws such as the Land Management Law and the Environmental Protection Law, punishments for illegal development and damage to the ecological environment can be made more severe. Moreover, these regulations should be more strongly enforced to ensure the laws are effectively implemented. In addition, social participation should be encouraged, reporting reward mechanisms should be established, and the breadth and depth of supervision should be improved.
(2) Enhancing public awareness: Public environmental awareness and participation are crucial for ensuring land ecological security. The government should take various measures, such as conducting environmental protection publicity and education activities, strengthening media publicity, and increasing public awareness of the importance of land ecology. Ecological civilization education in schools should be strengthened, and students’ environmental awareness should be cultivated. Moreover, community residents should be encouraged to actively participate in environmental protection activities; volunteers should be organized to conduct public welfare work such as afforestation and ecological restoration; and an atmosphere of joint participation in protecting the ecological environment should be created across overall society.
(3) Establishing warning mechanisms and scientifically formulating land use plans: To detect and respond to potential ecological risks in a timely manner, a sound land ecological security warning mechanism should be established. Advanced technologies such as remote sensing and geographic information systems can be introduced to monitor and evaluate the ecological status of land in real time, and to provide early alerts for potential problems. Moreover, the government should scientifically formulate land use plans, reasonably plan urban expansion and rural construction, and mitigate the adverse effects of excessive development on the ecological environment. Community planning standards should be developed to ensure that land resources are rationally used while preserving public spaces such as green spaces and parks and improving the ecological integrity of urban communities. We suggest strengthening cross-departmental cooperation, forming a comprehensive land use plan, and ensuring coordination between ecological needs and economic development.

