

Introduction
Trace element pollution is a dangerous type of contamination [1]. Therefore, its examination in rivers, lakes, benthic organisms, and sediments is vital to monitor toxicity and non-biodegradability, which has been the subject of several research works [2-4]. In this regard, trace elements are frequently defined as elements with an atomic number higher than 20 and a density of more than 5 cm-3. They occur naturally in a wide range of environments and anthropogenically in industrial, domestic, agricultural, and medical wastewaters [5, 6]. In this regard, population growth, industrialization, rapid urbanization, and overuse of pesticides, detergents, and agricultural chemicals are the main sources of water contamination with trace elements [7-9].
Oznur Isinkaralar et al. (2025) studied settled dust particles from various indoor environments of several supermarket chains. This study demonstrated that the concentrations of CO2 and PETs (polyethylene) exhibited a multi-distribution correlated with customer density. It also revealed that children's exposure to dust particles in urban markets primarily occurred through ingestion, followed by dermal contact and inhalation. These findings provide essential data to guide future monitoring and policy to safeguard coastal ecosystems and public health [10]. Bioaccumulation of trace elements can lead to toxic effects on tissues and organs. In fact, trace elements disrupt cellular events, including growth, proliferation, differentiation, damage-repairing processes, and apoptosis [11]. Although the toxic effects of trace elements depend on the forms and the way of exposure, interruptions of intracellular homeostasis include damage to lipids, proteins, enzymes, and DNA via the production of free radicals [12]. Trace elements’ ions are known to interfere with DNA and nuclear proteins, leading to DNA structural and functional impairments as well as changes that initiate carcinogenesis, apoptosis, and modulation of the cell cycle. Trace elements’ toxicity alters the activities of the central nervous system and causes mental disorders, alters the blood composition and the functions of the liver, kidneys, and lungs, resulting in the escalation of assorted human diseases [13].
Sediments serve a critical function in helping bottom-feeding fish absorb trace elements. These fish can be potentially useful bioindicators for tracking metal pollution in aquatic environments. Furthermore, trace elements in water and sediment after fertilizer application reveal a complicated interaction between biotic and abiotic variables in the system [14, 15]. In fact, some trace elements in the sediment are endowed with physicochemical properties that allow them to be remobilized and released back into the water column via hydrodynamics, biogeochemical processes, and anthropogenic activities [16, 17]. Furthermore, the bioaccumulation of trace elements in organisms can be passive or selective [13]. Maurya et al. (2016) showed that the presence of trace elements in water, sediments, and some benthic invertebrates can be considered an indicator of water quality in aquatic ecosystems highly polluted by domestic and industrial wastewater [15].
Aquatic organisms such as fish, crustaceans, and mollusks can accumulate trace elements. These contaminants can potentially magnify within the food chain to a level that can be highly toxic to humans [18]. Benthic organisms have the ability to bioaccumulate acquired trace elements in food webs, making the measurement of trace element concentrations in the natural environment possible even when the levels of those elements are less than the detection limits [19]. The high capacity of benthic organisms with shells in freshwater to magnify the trace elements in water ecosystems made them a good bioindicator for trace element pollution [20, 21]. El Shafei (2016) pointed out that the accumulation of trace elements progressively increases in aquatic living organisms [22].
The greatest river in Iraq, the Tigris, provides the majority of the city of Baghdad's water [23]. Due to excessive anthropogenic pressure and the release of pollutants into the river without any real treatments, the risk of water contamination by trace elements has increased considerably [24]. In Iraqi aquatic systems, few studies focused on using invertebrates as bioindicators to determine the levels of trace elements. However, several studies have used fish as bioindicators for trace element pollution and health risk assessment. In this aspect, most researchers highlighted the bioaccumulation discrepancies across fish species, especially fish with bottom feeding having greater trace element levels [25, 26].
The new study focuses on using the CA-MC (Cellular Automata, Markov Chain) model to monitor the pollution pattern. It is known that traditional methods used to clean polluted air, water, or soil require a lot of labor and economic capital. Hence, the new strategy is to develop a CA-MC model to estimate the spatial pattern where the possible trace elements risk is high in the future against pollution [27]. In addition, the Tigris River was studied in Mosul city, and the results showed that the average concentrations of Co, Cu, Cd, Pb, Zn, and Ni were higher than the WHO-accepted average. During the survey period, the enrichment factor (EF) showed that sediment was moderately contaminated by Cu, Cd, Ni, and Zn but not by Co and Pb [6].
To the best of the authors’ knowledge, this is the first study that concerns assessing trace elements in the Tigris River’s water, sediment, and some benthic invertebrates within Baghdad city. Thus, a thorough evaluation of trace element concentrations in water, suspended particulate matter, and sediment in some benthic organisms, including Oligochaetes, Physa gyrina, and Corbicula fluminea, is systematically conducted in this study. Samples were collected from four different areas along the side of the Tigris River, which are exposed to various degrees of anthropogenic inputs from different water contamination resources. Therefore, it is fair to admit that the research on trace elements in the Tigris River would meaningfully contribute to universal knowledge by identifying specific pollution sources, such as unregulated industrial wastewater and sewage discharges, which align with existing studies on societal health risks linked to toxic metals. Furthermore, investigating trace elements in the sediment and some benthic organisms is a prosperous technique for evaluating the degree of enrichment in trace elements in the studied regions. It should also be noted that evaluating trace elements in organisms can be considered an ideal biomarker of water and surrounding environment quality.
Materials and Methods
Study Area
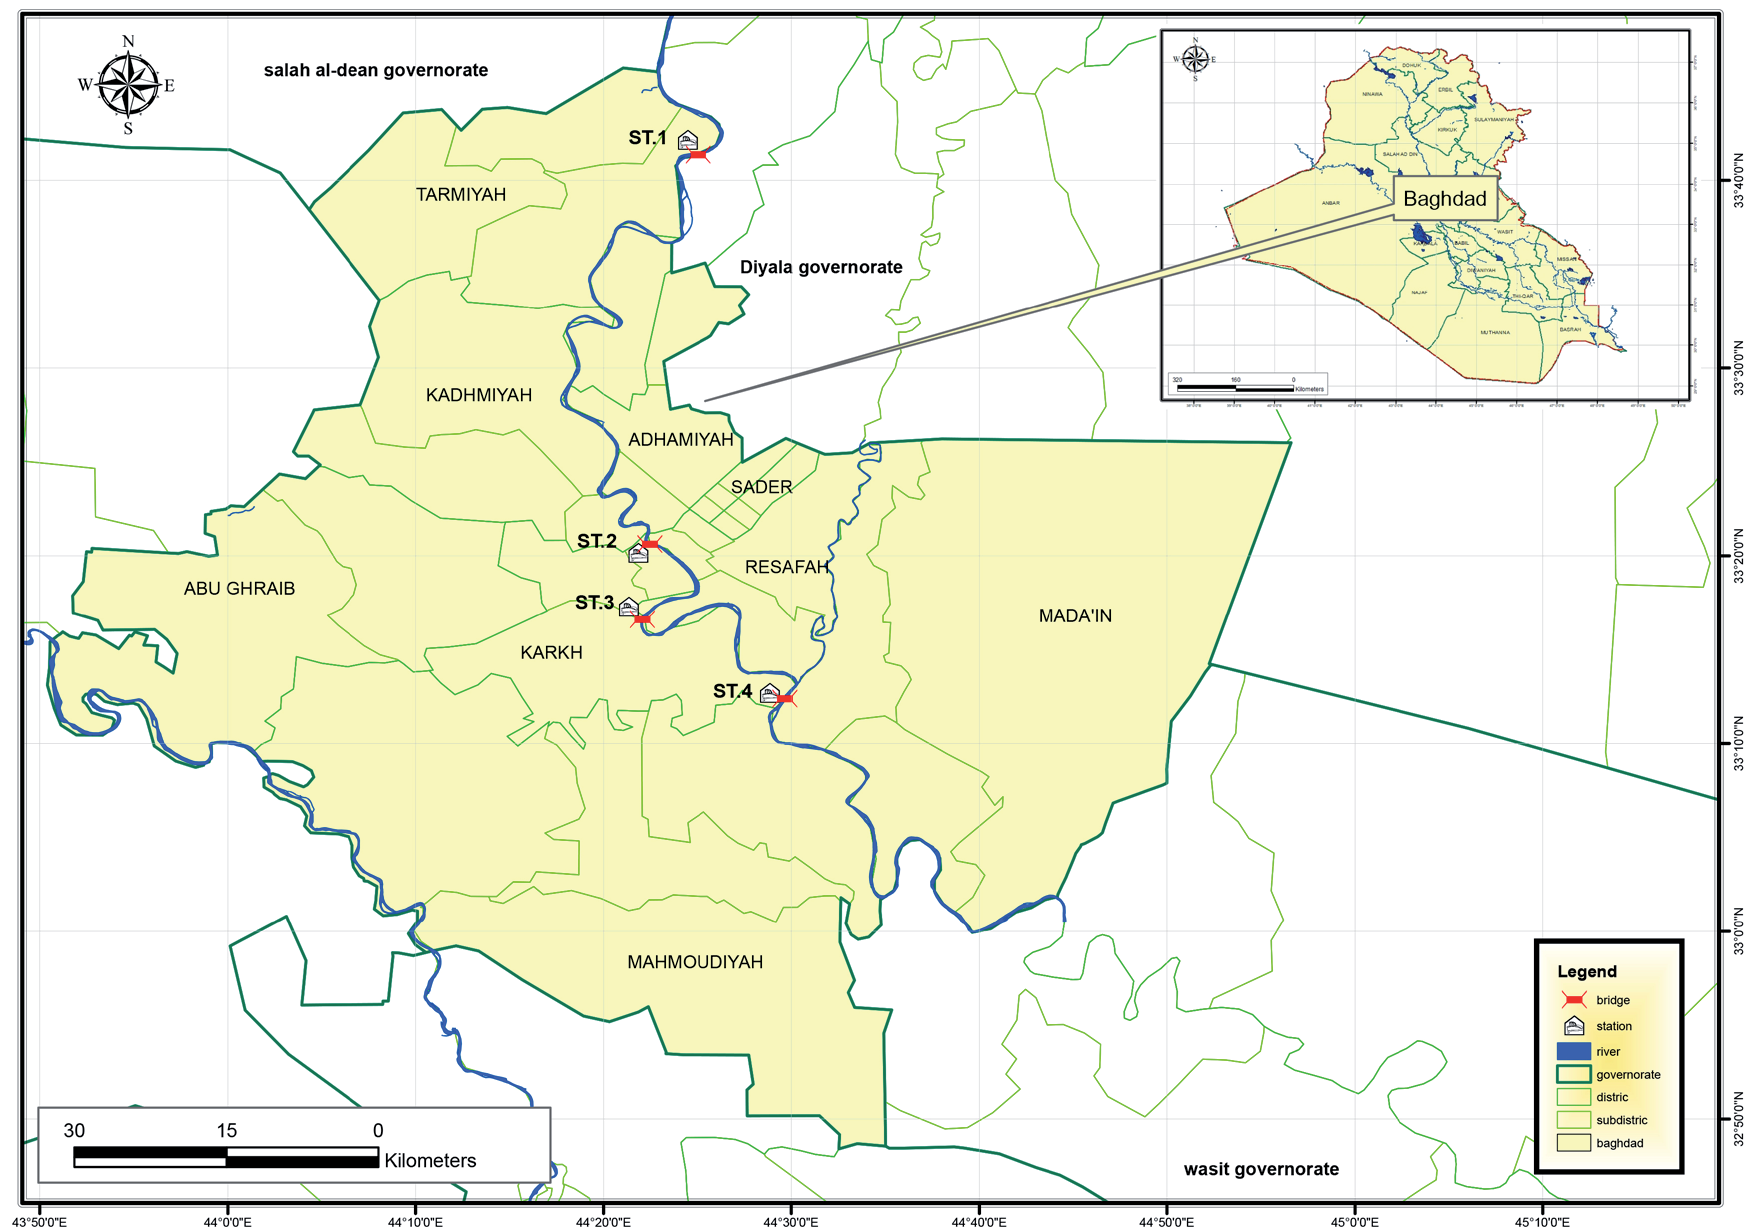
The Tigris River is the major river in Iraq. It shares the role of the primary supplier of water for human consumption, particularly drinking water, with the Euphrates River. It rises in the Taurus Mountains of eastern Turkey, around 25 km southeast of Elazig city and about 30 km from the Euphrates River sources (Isaev and Mikhailova, 2009). The Tigris River enters Baghdad City near the Al-Rashdea area and about 3 km south, joining the Diyala River, with a distance of approximately 58 km between those two points. The river divides Baghdad city into the right-side (Karkh) and left (Rusafa) districts with a flow direction from north to south [27]. The river has several twists due to the precipitation and decreased pace [26]. The Tigris River typically has islands covered with reeds and wild grasses during the dry season, which sink during the wet season as the river level rises [25]. Industrial waste sewages have burdened it in large towns like Baghdad and Mosul [28]. Four stations along the Tigris River in Baghdad City were chosen, taking into account the pollution level and gradient. These stations are listed below:
Station 1: Al-Rashdea Area: This station is located near the Northern Baghdad gate, agrarian in character, and abundant in orange and palm trees. Clay, silt, and sand comprise 29.91, 22.73, and 47.36% of the station's sediment, respectively. Sandy clay loam makes up sediments (Fig. 1).
Station 2: Bab Al-Moazam Area: This station is located near the medical city, situated on the Rusafa side. The dominant sediment is clay loam (Fig. 1).
Station 3: Al-Dora Area: This station is located near the Al-Dora thermal power plant near the industrial area. The Tigris River serves as a conduit for factory liquid waste. Sediments consist of clay, silt, and sand at 22.12, 19.34, and 58.54%, respectively. The sediment texture was sandy clay loam (Fig. 1).
Station 4: Al-Zafaraniya Area: This station is located before the junction of the Tigris and Diyala rivers south of Baghdad. This station is distinguished by several farming fields (Fig. 1).
Table 1.
Ecological characteristics and recorded morphometric measures of examined benthic organisms.
Sampling
Samples of water, sediment, and benthic organisms were collected monthly from March 2022 to February 2023 from four selected stations along the Tigris River in Baghdad city. Samples were collected from 10-15 cm depths using 4-L Nalgene polycarbonate bottles. Samples were kept at 4ºC. One liter of water was filtered using a 0.45 µm Millipore filter [29]. The filter was washed with hydrochloric acid (5%), dried at 60°C for 24 hours, and then weighed and acidified with 5 mL of concentrated nitric acid to prevent metal and other species from adhering to the walls of the sample container. The filtered water was passed through an ion exchange column followed by 50 mL of nitric acid (2N) to wash the ions of trace elements and put it on a hot plate at 70°C to be vaporized until dried and crystals formed. One milliliter of concentrated nitric acid and 5 to 10 mL of deionized water were added to dissolve the crystals; then, the final volume was completed to 25 mL using deionized water. A filter of 0.45 µm was used to extract particulate trace elements, as described by Sturgeon et al. (1982) [30]. Half a gram of filtered particles on the filter was put in a 100 mL beaker, then 6 mL of hydrochloric acid and nitric acid at a ratio of HCl:HNO3 equal to 1:1 were added and put on the hot plate and heated at 80°C to be dried. Then, 4 mL of HClO4 and HNO3 at a ratio of 1:1 was added and dried again. The precipitate was further dissolved in 20 mL of HCl (0.5 N) and completed to 25 mL by adding deionized water and kept in a polyethylene container for further analysis by an atomic absorption spectrophotometer.
For sediment analysis, triplicate samples were taken using a Van Veen grab sampler. Bottles were extensively washed with 1 mL of hydrochloric acid (HCl) and Milli-Q water before use to prevent contamination of the bottles and rinsed three times with the respective sample before filling. Pb, Cd, Fe, Co, Mn, and Ni were analyzed using flame atomic absorption spectrophotometry (AAS). The analysis procedures were made using the standard methods of the American Public Health Association (APHA) for examining water and wastewater [29]. Sediments were dried in Petri dishes in an oven at 70°C to 80°C for 1-2 days. The dried sediment samples were broken up with a ceramic mortar, then sieved through a mesh size of 63 μm, then digested with HCl and HNO3 at a ratio of 5:2 and heated in the oven to 90°C for 2 hours and kept at room temperature overnight in the hood, then centrifuged for 20 min at 3000 r min-1. Afterward, the solution was completed at 25 mL using deionized water for further analysis.
Benthic organism samples were collected by four grabs taken from each station (two meters’ distance), covering a total area of 900 cm2. The samples were collected in polythene bags after being rinsed in river water to eliminate any suspended particles. In the laboratory, benthic organisms were sorted in a Petri dish to freeze until further dissecting microscope analysis at a 7 to 10 × magnification [31]. The soft tissue of benthic organisms was prepared using the APHA (1992) digestion method [32]. They were stocked in distilled water for 24 hours. To eliminate contamination from sediments and other materials in their guts, soft tissues were dried at 80°C for 24 hours. About 0.5 g dry weight was taken and digested by adding a mixture of HNO3 and HClO4 within a ratio of 5:1. The mixture was heated on a hot plate to 90°C for 2 hours and then left overnight at room temperature. Five milliliters of deionized water were added and centrifuged for 20 min at 3000 r min-1. The volume was then completed to 25 mL using deionized water and finally kept in a polyethylene container for analysis by atomic absorption spectrophotometer [31]. The ecological characteristics of the collected benthic invertebrates are given in Table 1.
Data Processing and Statistical Analysis
The data processing and statistical analyses were conducted using the variance test (ANOVA) to determine whether there is a significant difference in the trace elements of the four areas under investigation. The relationships between the different parameters were analyzed using the Past program’s canonical correspondence analysis (CCA). ANOVA and CCA were also carried out using the XL Stat software and the GraphPad Prism 9 program.
Bioconcentration Factor and Biosedimentation Factor
The bioconcentration factor (BCF) in benthic organisms from the aquatic ecosystems was assessed by Evan and Engel (1994): BCF = A/B, where A is the concentration of trace elements in living organisms and B is the concentration of trace elements in water. While the biosedimentation factor (BSF) was measured according to the equation: BSf = A/D, with D as the concentration of trace elements in sediment.
Results
Spatial Variation of Dissolved Trace Element Levels
The spatial distribution of dissolved trace elements in the water samples is presented in Table 2 and Fig. 2. Dissolved trace element values showed that the lowest mean value of dissolved Ni was 0.52±0.17 µg L-1 (station 3), whereas the highest value of dissolved Ni was 0.56±0.18 µg L-1 (station 4). For Fe, the highest mean value was observed in station 4 (136.50±19.2 µg L-1), while the lowest value was obtained in station 3 (127.33±16.08 µg L-1). The lowest concentration of dissolved Cd was 5.720 µg L-1. The dissolved Co concentration in station 1 ranged between 5.3 µg L-1 and 7.45 3 µg L-1 (Fig. 2). The Pb mean value varied between 72.08±10.06 and 83.41±8.51 µg L-1. The lowest value of Pb (70.00±6.68 µg L-1) was recorded in winter, compared to the highest value measured during summer (79.58±10.00 µg L-1). The seasonal variation showed that the mean values of Fe in dissolved water ranged between 112.58±13.99 µg L-1 and 151.50±13.50 µg L-1, which were detected in winter and spring, respectively. The results also indicated that the lowest average of Co was observed in autumn at 5.45±1.42, and Ni was observed in spring at 0.53±0.17 µg L-1. Furthermore, the highest averages of Co and Ni of 7.35±0.87 and 0.61±0.18 µg L-1 were detected during spring, respectively (Table 3). ANOVA results indicated significant variations for Fe (p<0.0001) and Mn (p<0.05) across stations between stations 1, 2, 3, and 4. However, no significant differences were noticed between the studied stations for other trace elements. Also, there were significant differences between Co (ANOVA, p<0.001) compared to Pb (ANOVA, p<0.05 among seasons) (Tables 2 and 3).
Spatial Variation of Trace Element Levels in Particulate Suspended Matter
The trace element levels in particulate suspended matter were classified according to their concentrations as follows: Pb>Co>Fe>Mn>Cd> Ni (Table 2 and Fig. 3). The lowest mean value of Ni was 0.58±0.18 mg kg-1 in station 3, which varied between 0.30 mg kg-1 and 0.77 mg kg-1. However, the highest mean value of Ni of 0.77±0.71 mg kg−1 was detected in station 1. The mean values of Fe ranged between 3.87±1.18 and 6.35±14.41 mg kg-1 in station 2, which varied from 1.3 to 52 mg kg-1. The mean Pb varied between 26.75±9.11 mg kg-1 and 31.83±13.64 mg kg-1 in station 3. The highest concentrations of Cd and Co were recorded in station 2 (1.99±0.94 mg kg-1) and in station 4 (7.44±1.29 mg kg-1), respectively. However, a low concentration of Cd was recorded in station 1 (0.7 mg kg-1), and a high concentration of Co was measured in station 4 (9.6 mg kg-1).
During winter, the trace elements of Pb, Cd, and Co in particulate suspended matter decreased (17.50±3.00, 1.57±0.88, and 6.00±1.08 mg kg-1, respectively) and increased during spring (36.83±10.69 mg kg-1, 3.78±0.71 mg kg-1, and 7.85±0.61 mg kg-1, respectively), as indicated in Table 3 and Fig. 3. The trace element concentrations in particulate suspended matter indicated significant differences among stations, i.e., Fe and Ni (ANOVA, p<0.0001), Pb (ANOVA, p<0.001), and Cd and Co (ANOVA, p<0.05). At the same time, the seasons had significant differences for Mn (ANOVA, p<0.001) (Table 2).
Spatial Variation of Trace Element Levels in Sediment
The trace element levels in sediment were classified according to their concentrations as follows: Fe>Mn>Pb>Co>Cd>Ni (Table 2 and Fig. 4). The lowest mean value of Cd was 0.69±0.22 mg kg-1 (station 1), whereas the highest mean value (1.75±0.52 mg kg- 1) recorded in station 3. The highest mean value of Pb was 18.80±3.23 mg kg-1 (station 4) (Fig. 4), whereas the lowest mean value was equal to 14.70±3.72 mg kg−1 (station 2). Furthermore, the mean value of Fe ranged between 172.33±29.97 and 202.50±35.52 mg kg-1, which were recorded in station 4. In this regard, the current work revealed that Co, Mn, and Ni were distributed among the considered stations in the following order. The lowest mean value of Ni was 0.66±0.29 mg kg-1 (station 2); however, the highest was 75.41±22.72 mg kg-1 of Co (station 3). The highest concentration of all the trace element levels was recorded during spring, except for Fe, while the lowest rate was noted during winter (Tables 2 and 3 and Fig. 3).
Statistical analysis indicated significant differences between stations for the studied trace elements in sediment, i.e., Fe, Pb, Cd, Co (ANOVA, p<0.0001), and Mn (ANOVA, p<0.001). However, Co showed no significant differences between stations (ANOVA, p>0.05) (Tables 2 and 3).
Spatial Variation of Trace Element Levels in Benthic Invertebrates
The present study indicated that the trace element levels in benthic invertebrates exhibited the following descending: Physa gyrina>Oligochaetes>Coricuula fluminea. The mean values of trace elements in Oligochaetes were classified according to their concentrations as follows: Pb>Fe>Cd>Mn>Ni>Co with yearly averages of 464.54±110.89, 233.93±78.94, 39.33±10.79, 26.70±14.32, 24.83±9.80, and 21.29±9.55 mg kg-1 of dry weight, respectively. The highest concentration of trace elements in Oligochaetes was recorded in Pb, which ranged between 432.25±131.08 and 482.41±48.62 mg kg-1 (station 4) (Table 4). The highest concentration of Fe (267.83±103.66 mg kg- 1) and the lowest content of Cd (33.08±12.26 mg kg-1) were recorded together in station 2. The lowest Mn, Ni, and Co concentrations were 20.58 ± 6.63, 15.75±10.03, and 17.83±5.76 mg kg-1, respectively, detected in station 1. Furthermore, station 4 presented the highest concentration of Ni (32.91±17.99 mg kg-1).
Table 2.
Mean values and standard deviation (S.D) of some trace element levels in dissolved water, particulate suspended matter, and sediment at stations sampled in the Tigris River in Baghdad City from March 2022 to February 2023.
[i] Note: Lead (Pb), Cadmium (Cd), Iron (Fe), Cobalt (Co), Manganese (Mn), and Nickel (Ni). In the last column, the results of the one-way ANOVA. F values are found by dividing the between-group variance by the within- group variance. Asterisks denote significant differences between the four stations at (12 months): * p<0.05, ** p<0.001, and ***p<0.0001. BLD: below detection limit.
Table 3.
Mean values and standard deviation (SD) of some trace element levels in dissolved water, particulate suspended matter, and sediment at stations sampled in the Tigris River in Baghdad City from March 2022 to February 2023.
[i] Note: Lead (Pb), Cadmium (Cd), Iron (Fe), Cobalt (Co), Manganese (Mn), and Nickel (Ni). In the last column, the results of the one-way ANOVA. F values are found by dividing the between-group variance by the within-group variance. Asterisks denote significant differences between the four seasons at (4 stations): *p<0.05, **p<0.001, ***p<0.0001. BLD: below detection limit.
Table 4.
Mean values and standard deviation (SD) of some trace element levels in Oligochaetes tissues, Corbicula fluminalea, and Physa gyrina at stations collected from the Tigris River in Baghdad City during March 2022 to February 2023.
[i] Note: Lead (Pb), Cadmium (Cd), Iron (Fe), Cobalt (Co), Manganese (Mn), and Nickel (Ni). In the last column, the results of one-way ANOVA. F values are found by dividing the between-group variance by the within-group variance. Asterisks denote significant differences between the four stations at (12 months): *p < 0.05, **p < 0.001, ***p < 0.0001. BLD: below detection limit.
Table 5.
Comparison between the average concentrations of trace element level mg kg−1 in the sediments of this study area and its comparison with the averages of other studies of the world.
Table 6.
The BCF and BSF values of trace element levels in benthic invertebrates collected from the Tigris River in Baghdad city from March 2022 to February 2023.
The seasonal distribution indicated that the trace element concentrations in Oligochaetes decreased in winter (Table 4 and Fig. 5). The trace element concentrations in Oligochaetes indicated significant differences between seasons, i.e., Pb and Ni (ANOVA, p<0.001). However, no significant differences were recorded or noticed between the studied stations for other trace elements (ANOVA, p>0.05) (Table 4).
The seasonal variations of trace elements in Corbicula fluminalis showed that Pb and Cd varied between 201 and 267 and 2.3 and 17.3 mg kg-1, respectively (Table 4 and Fig. 6). In this regard, the concentration of Fe during spring varied between 35.2 and 50.3 mg kg-1. Furthermore, the highest averages of Co, Mn, and Ni, detected during spring, were 20.5, 19.13, and 1.03 mg kg-1, respectively. The highest mean concentration of Pb recorded in this study was 294.00±23.643 mg kg-1 (station 4). On the other hand, station 3 recorded the lowest mean values of all trace elements, especially for Ni at 0.48±0.16 3 mg kg-1. The statistical analysis depicted significant differences between stations for Cd, Co, and Mn (ANOVA, p<0.0001).
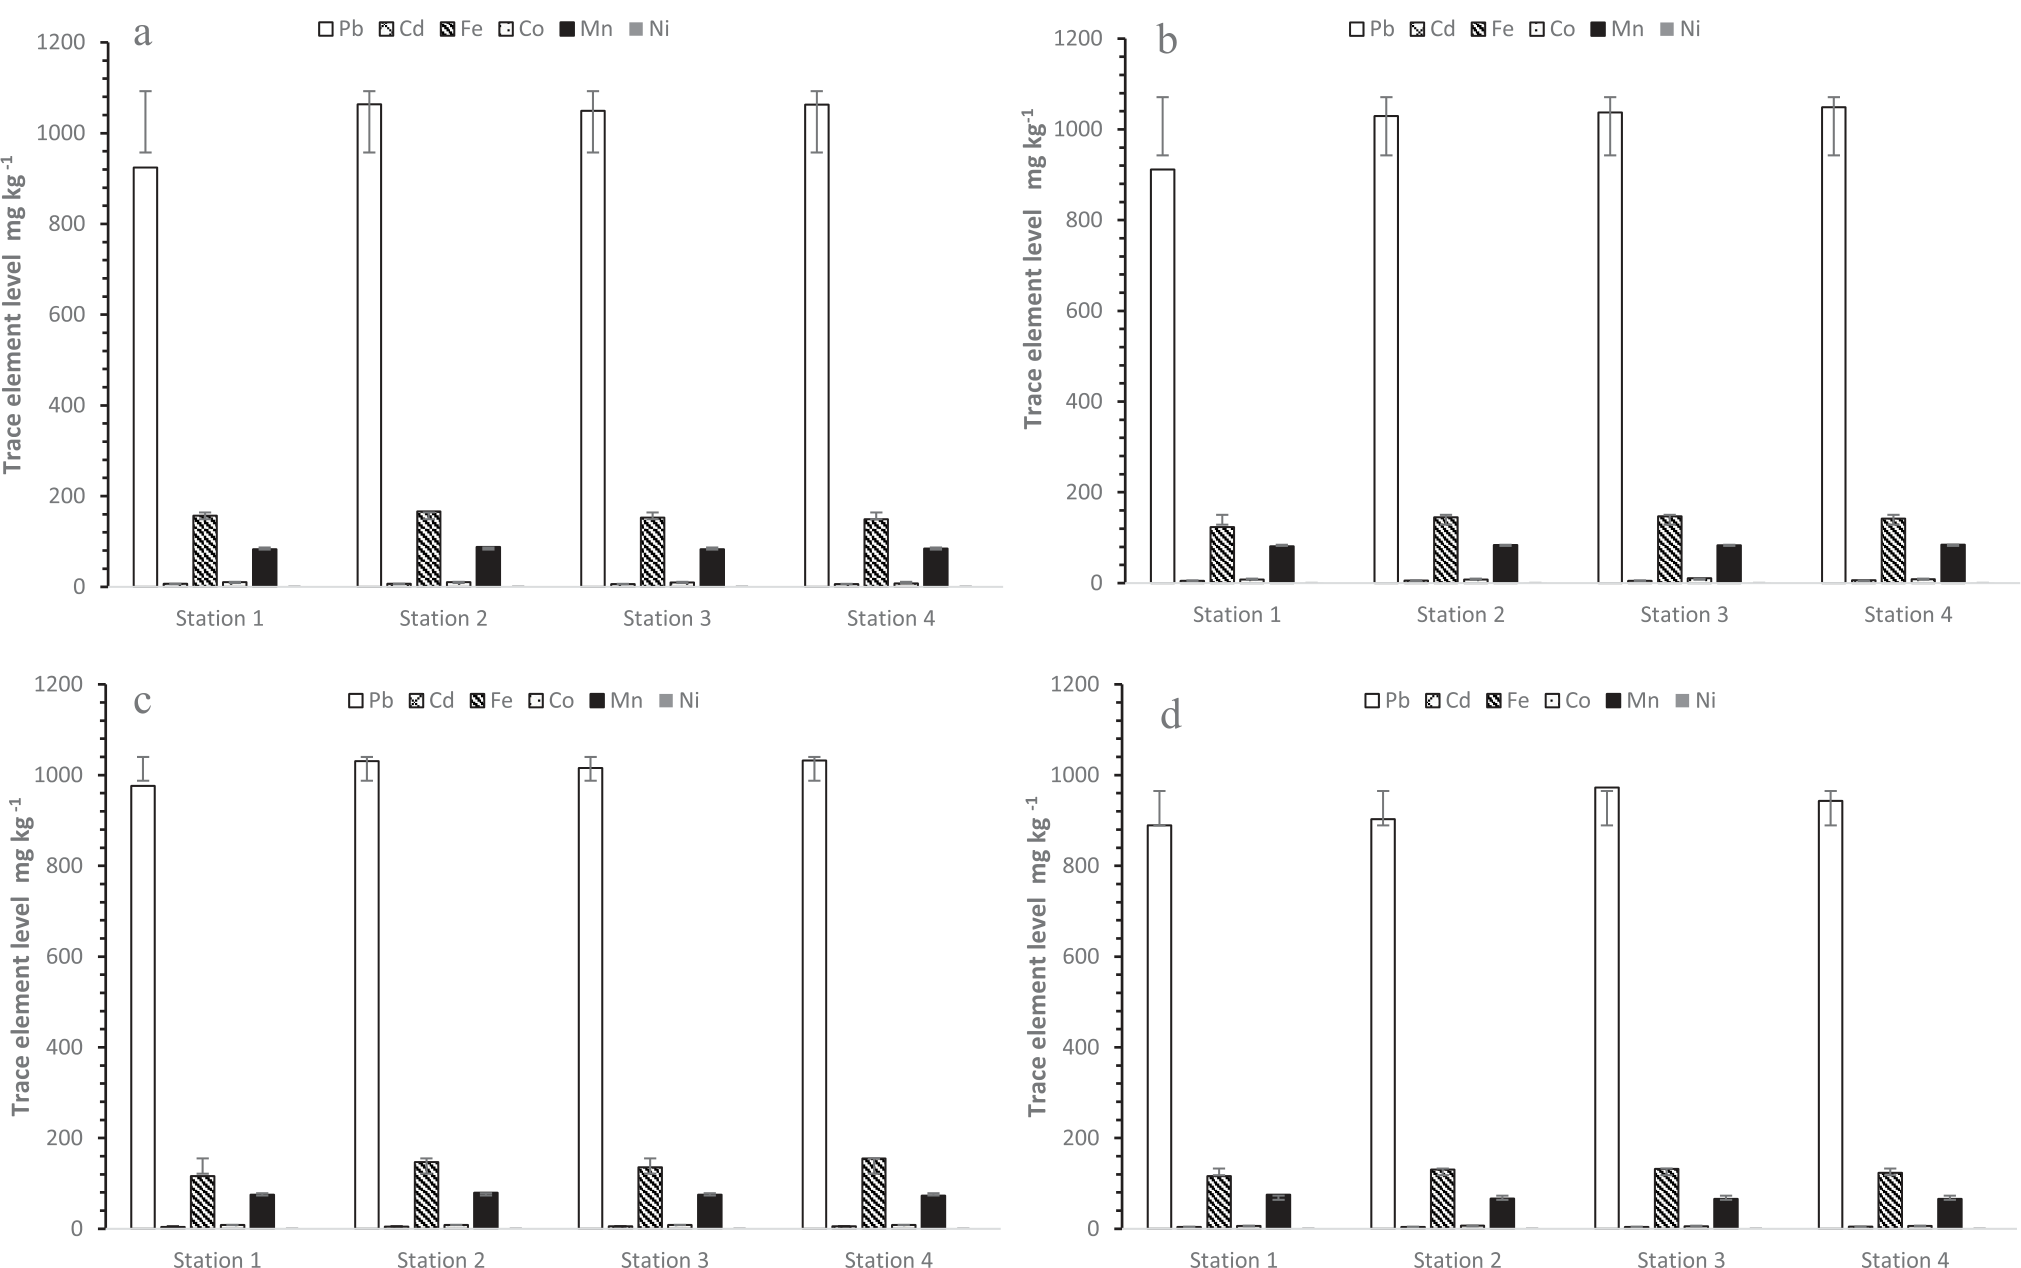
The spatial distribution of trace element levels in Physa gyrina is presented in Table 4 and Fig. 7. Trace element levels were classified according to their concentrations as follows: Pb>Fe>Mn>Co>Cd>Ni. The lowest mean value of Pb was 925.16±39.22 mg kg-1 (station 1), whereas the mean value of Fe varied between 102.0 and 169.03 mg kg-1 (station 4). The Mn concentration ranged between 56 and 95 (station 3) (Table 4 and Fig. 7), whereas the Ni content varied between 0.42±0.12 (station 3) and 0.50±0.12 mg kg-1 (station 4). The Cd and Co concentrations varied between 7.00±3.33 and 13.74±1.80 mg kg-1 and 13.76±5.59 and 20.24±6.25 mg kg-1, respectively, which were detected in station 2. The highest concentrations of Pb, Fe, Mn, Co, Cd, and Ni were detected in the spring. The highest concentration was observed with Pb (1024.91±6.25 mg kg-1), whereas the lowest values were recorded in winter for all the tested samples. The Ni was the lowest among the analyzed trace elements at 0.36±0.12 mg kg- 1. The statistical analysis of Physa gyrina trace elements showed significant differences between stations for Fe (ANOVA, p<0.0001), Pb (ANOVA, p<0.001), Mn, and Ni (ANOVA, p<0.05) (Table 4).
Fig. 2.
Spatial variation of trace element levels in dissolved water Spring (a), Summer (b), Autumn (c) and Winter (d) at stations sampled in Tigris River of Baghdad City during March 2022 to February 2023.
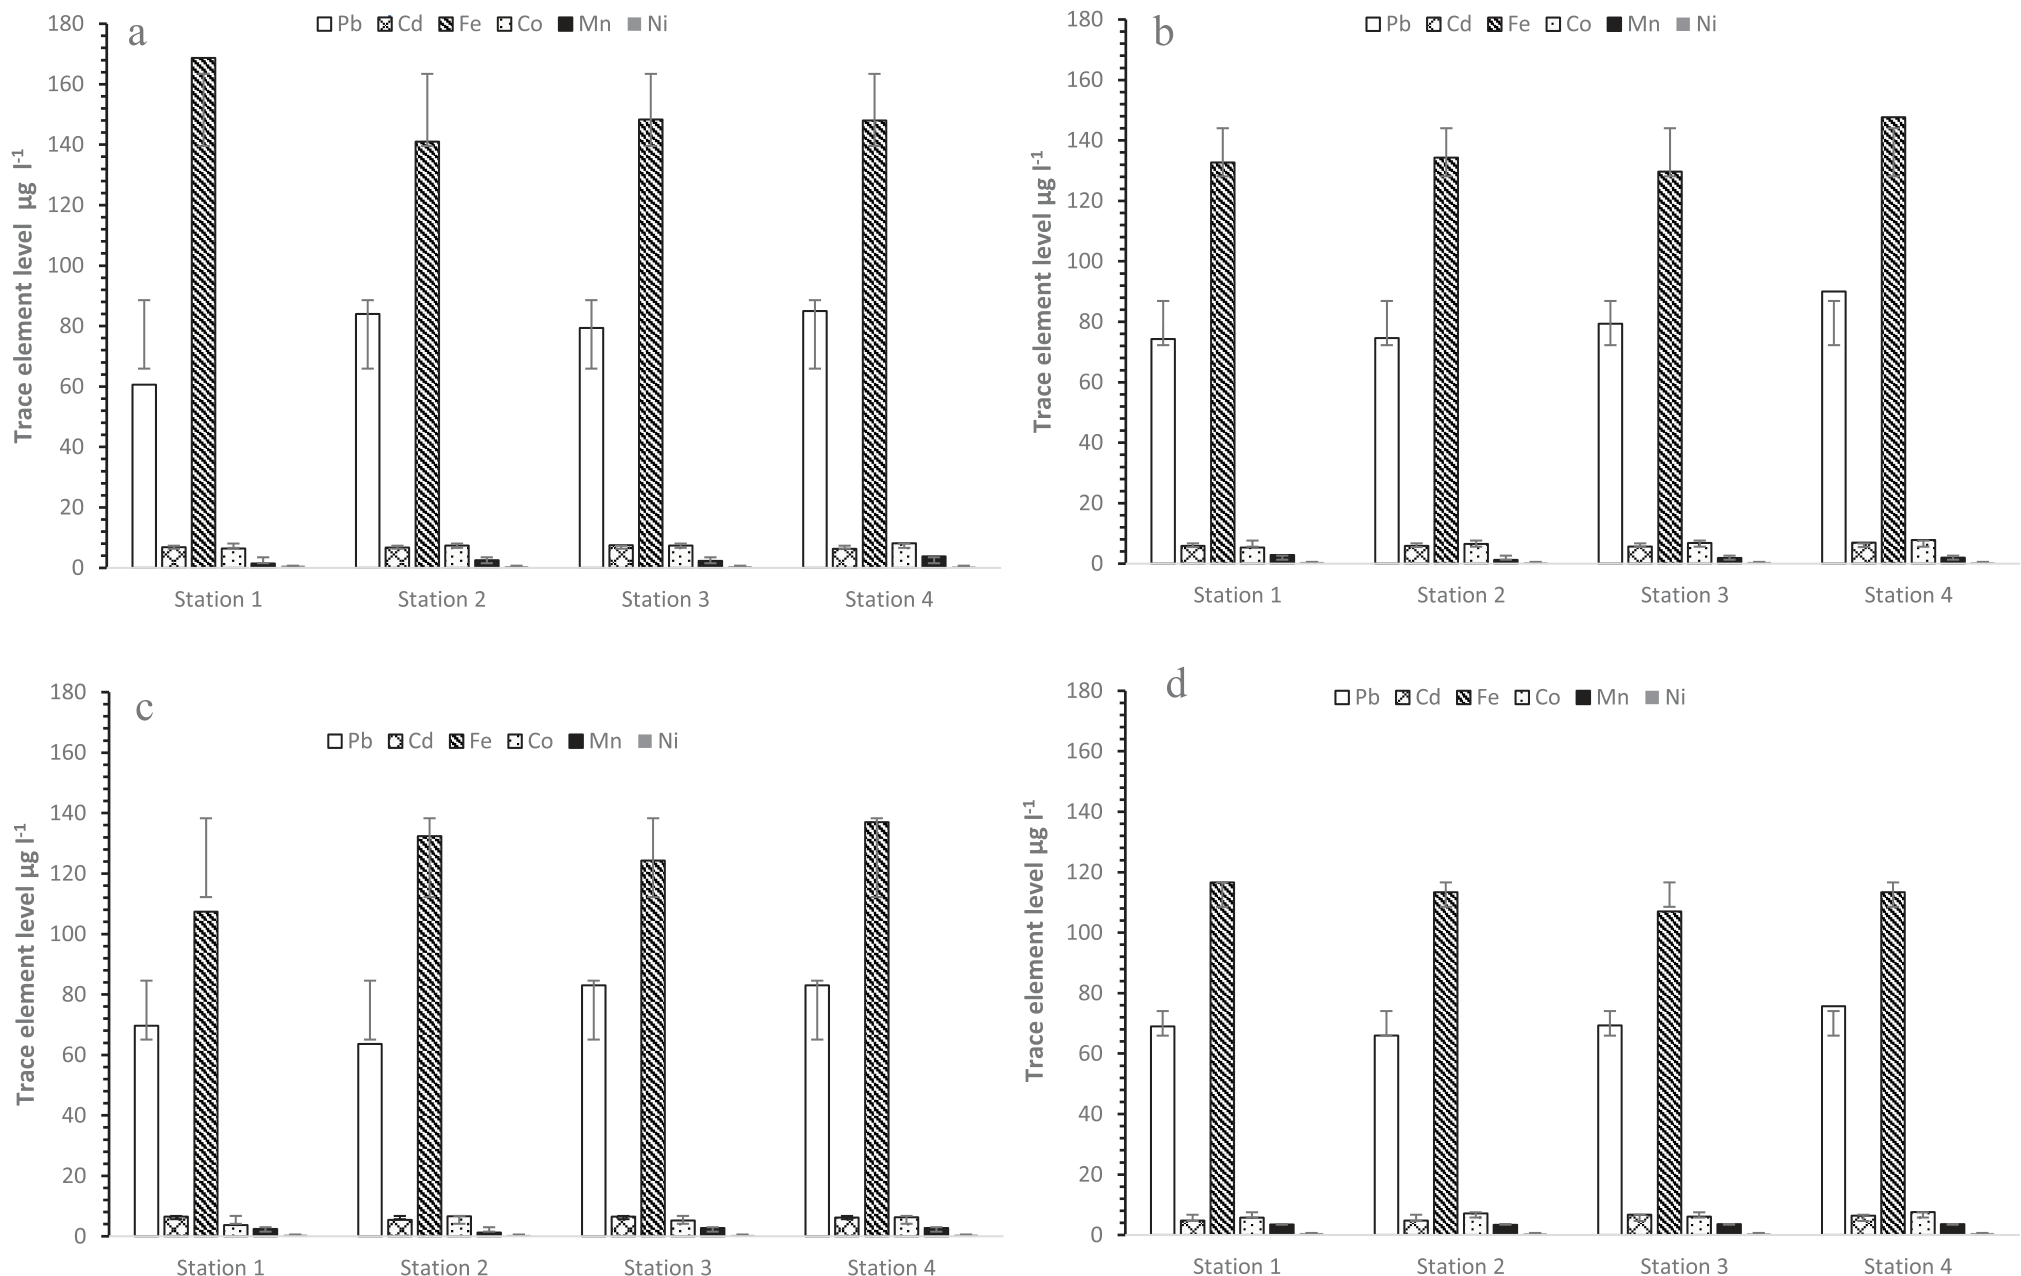
Fig. 3.
Spatial variation of trace element levels in particulate suspended matter Spring (a), Summer (b), Autumn (c) and Winter (d) at stations sampled in the Tigris River of Baghdad City during March 2022 to February 2023.
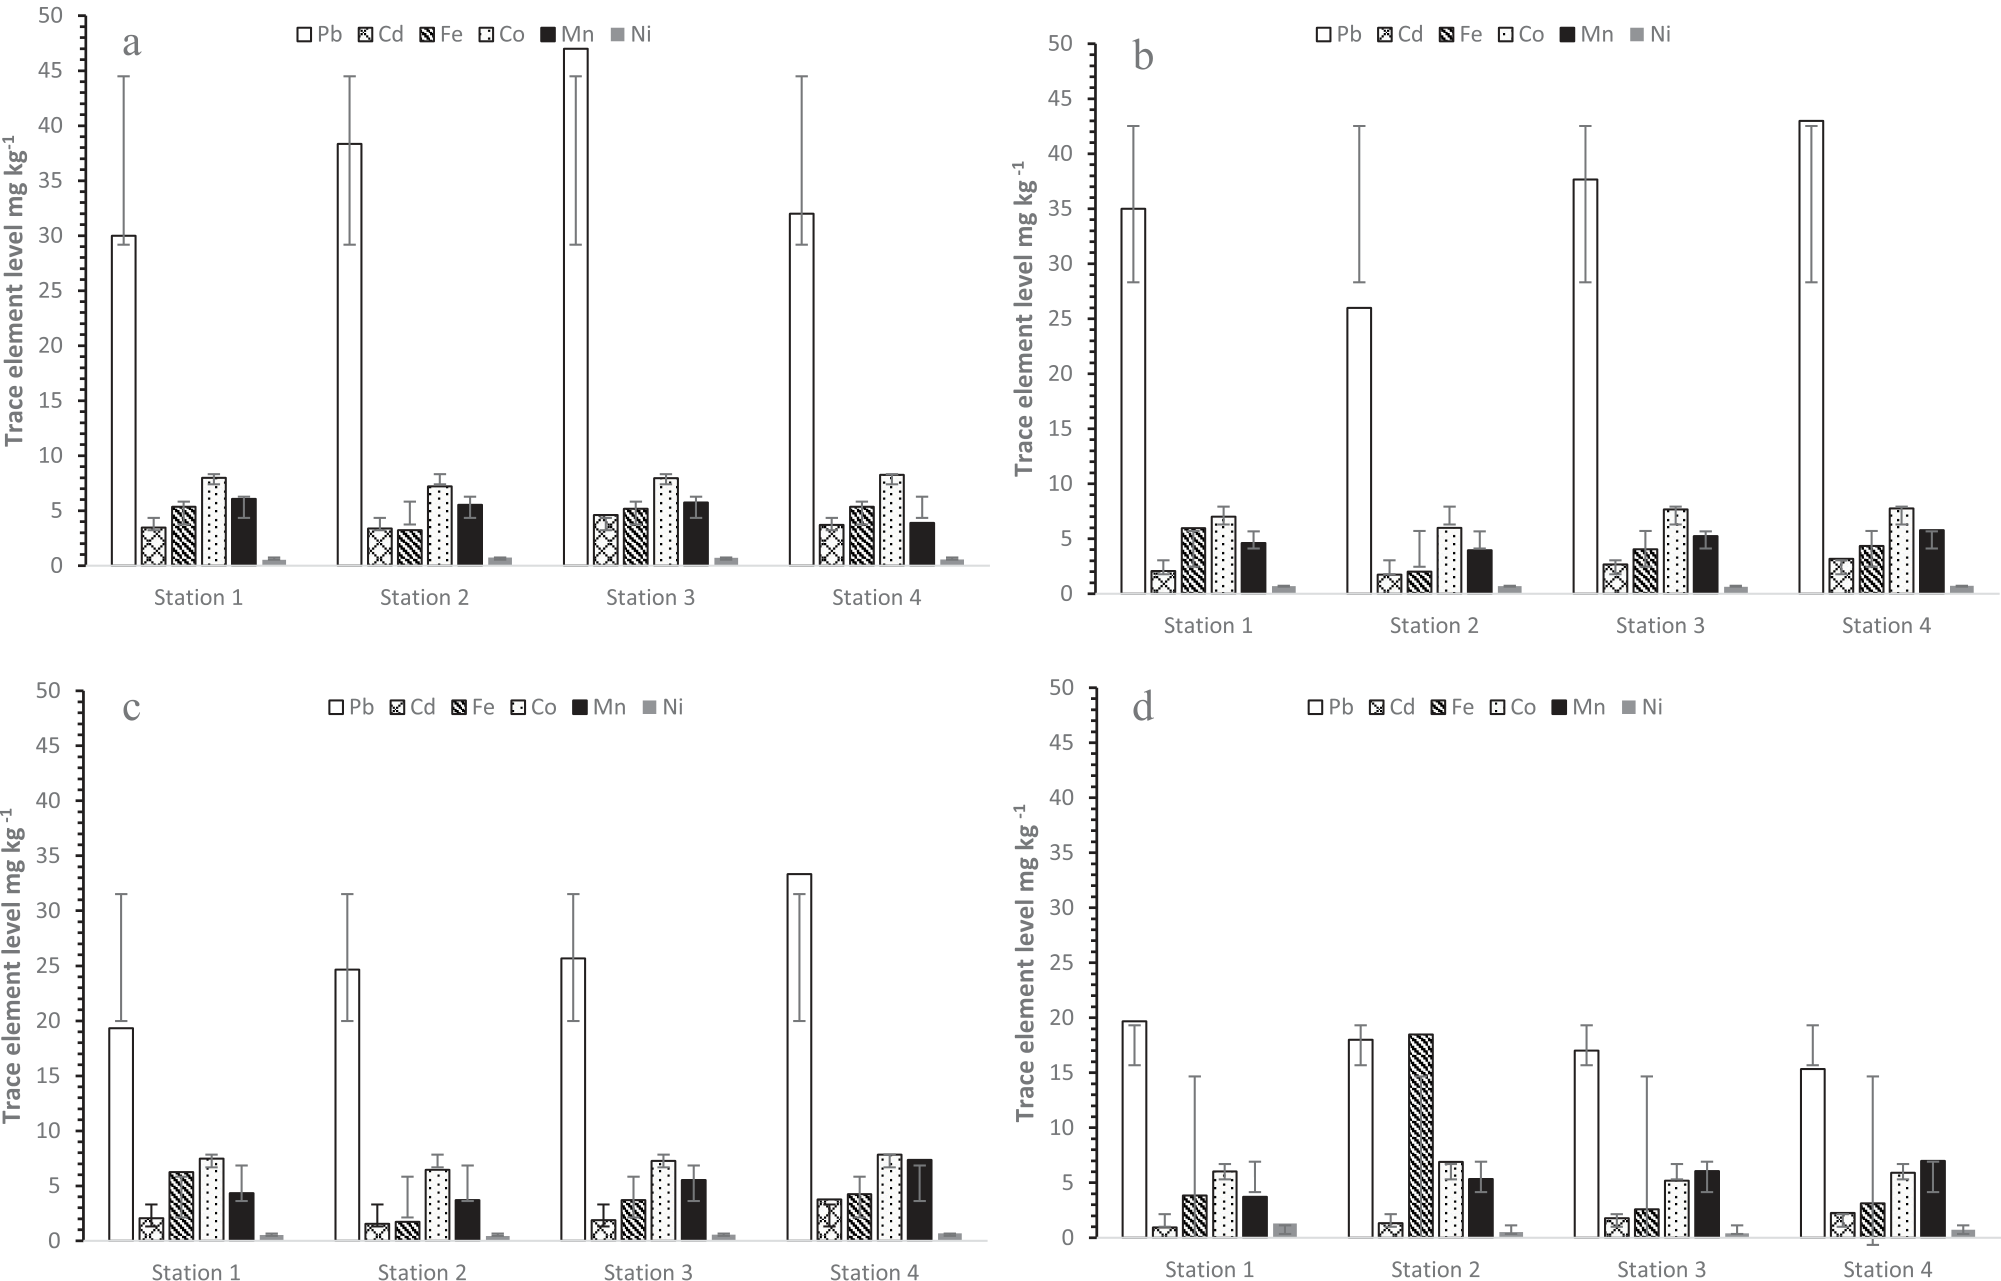
Fig. 4.
Spatial variation of trace element levels in Sediment Spring (a), Summer (b), Autumn (c) and Winter (d) at stations sampled in Tigris River of Baghdad City during March 2022 to February 2023.
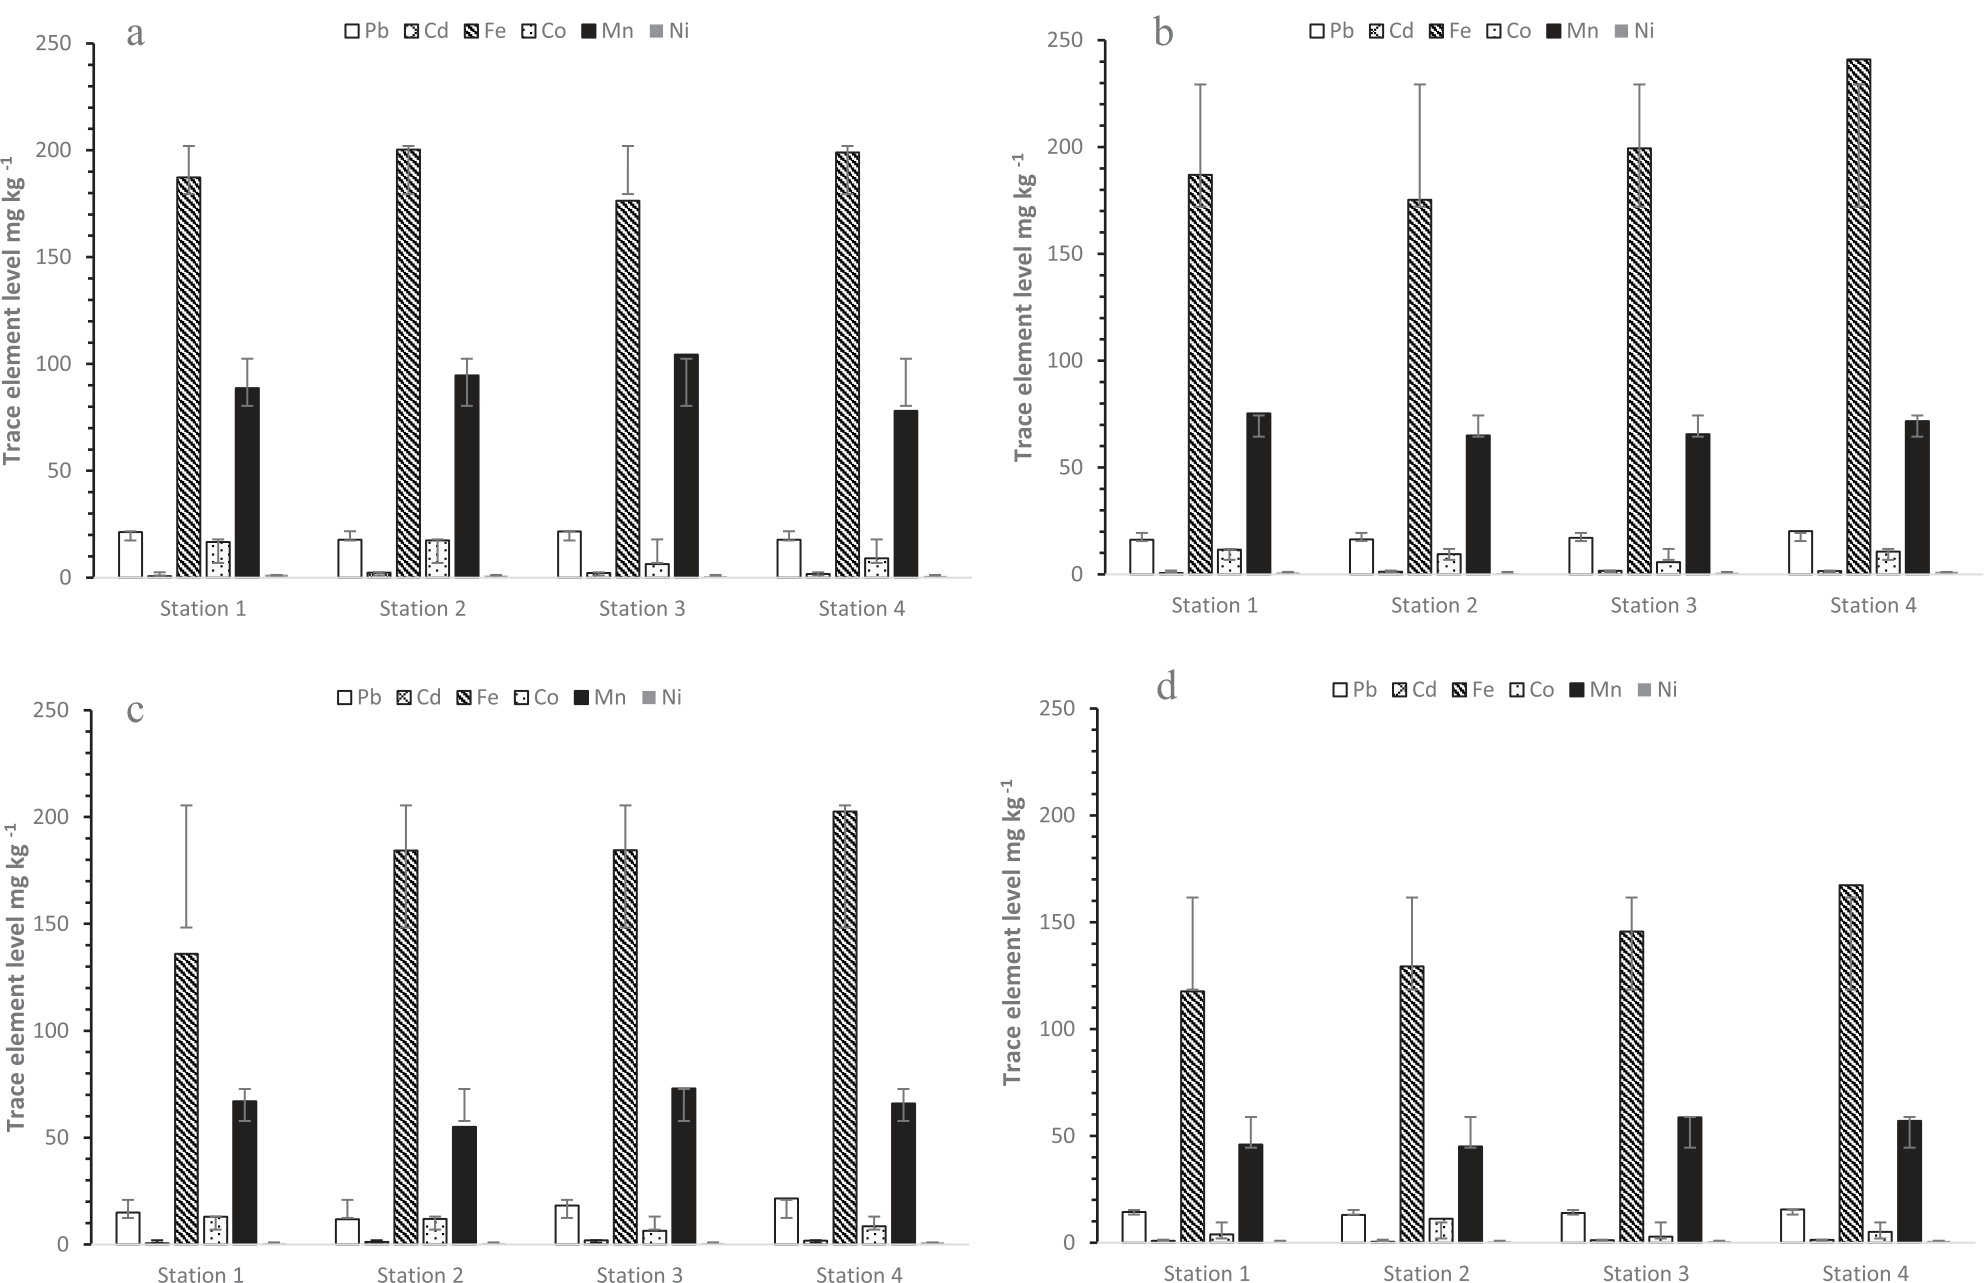
Fig. 5.
Spatial variation of trace element levels in Oligochaetes, Spring (a), Summer (b), Autumn (c), and Winter (d) at stations sampled in the Tigris River of Baghdad City from March 2022 to February 2023.
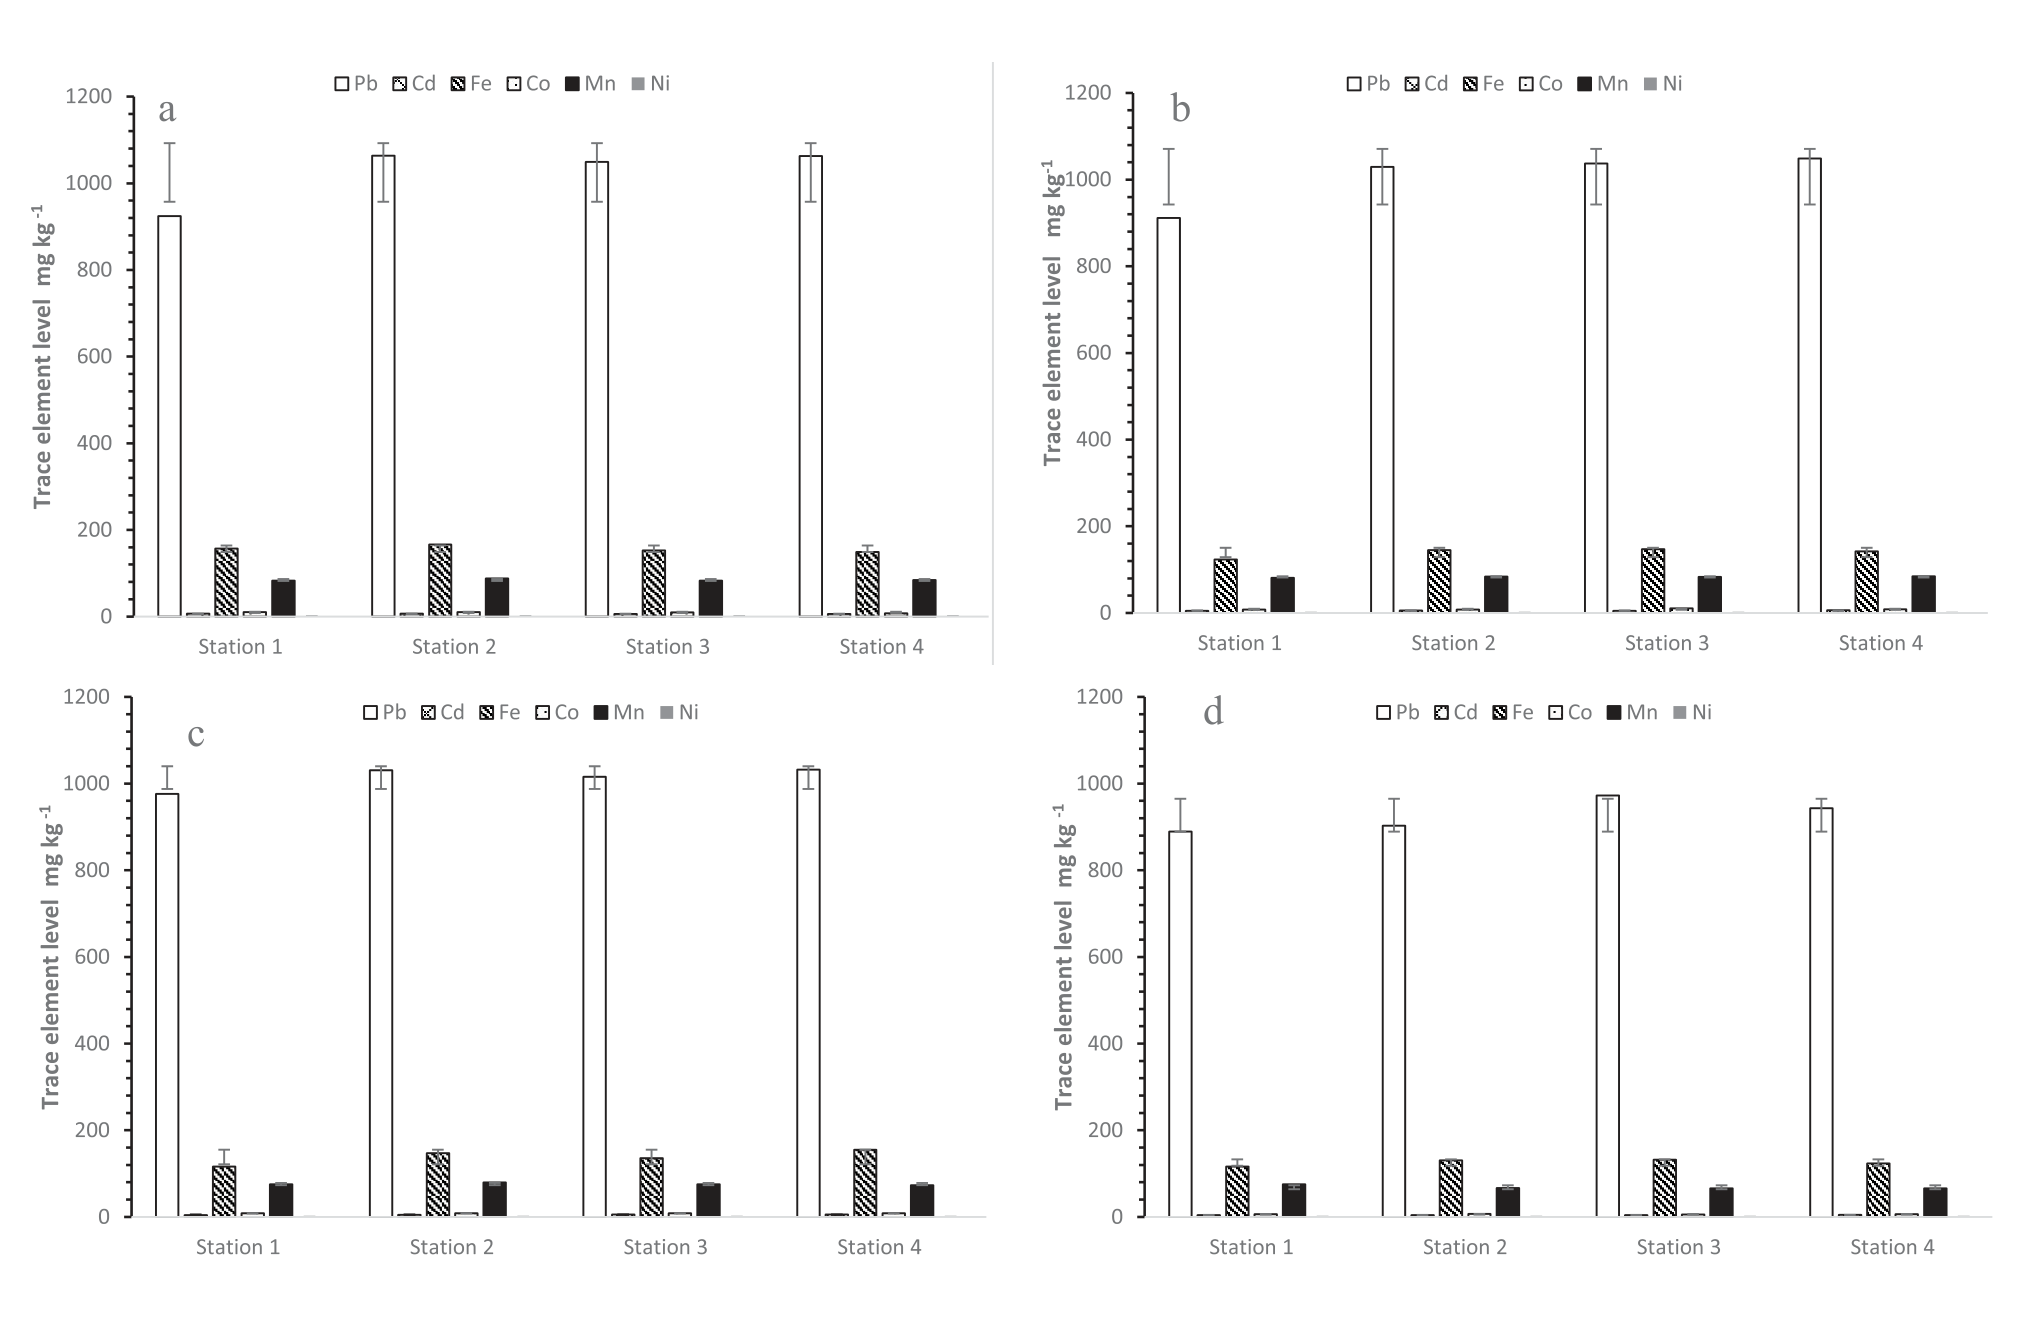
Fig. 6.
Spatial variation of trace element levels in Corbiculla flumiea, Spring (a), Summer (b), Autumn (c) and Winter (d) at stations sampled in Tigris River of Baghdad City during March 2022 to February 2023.
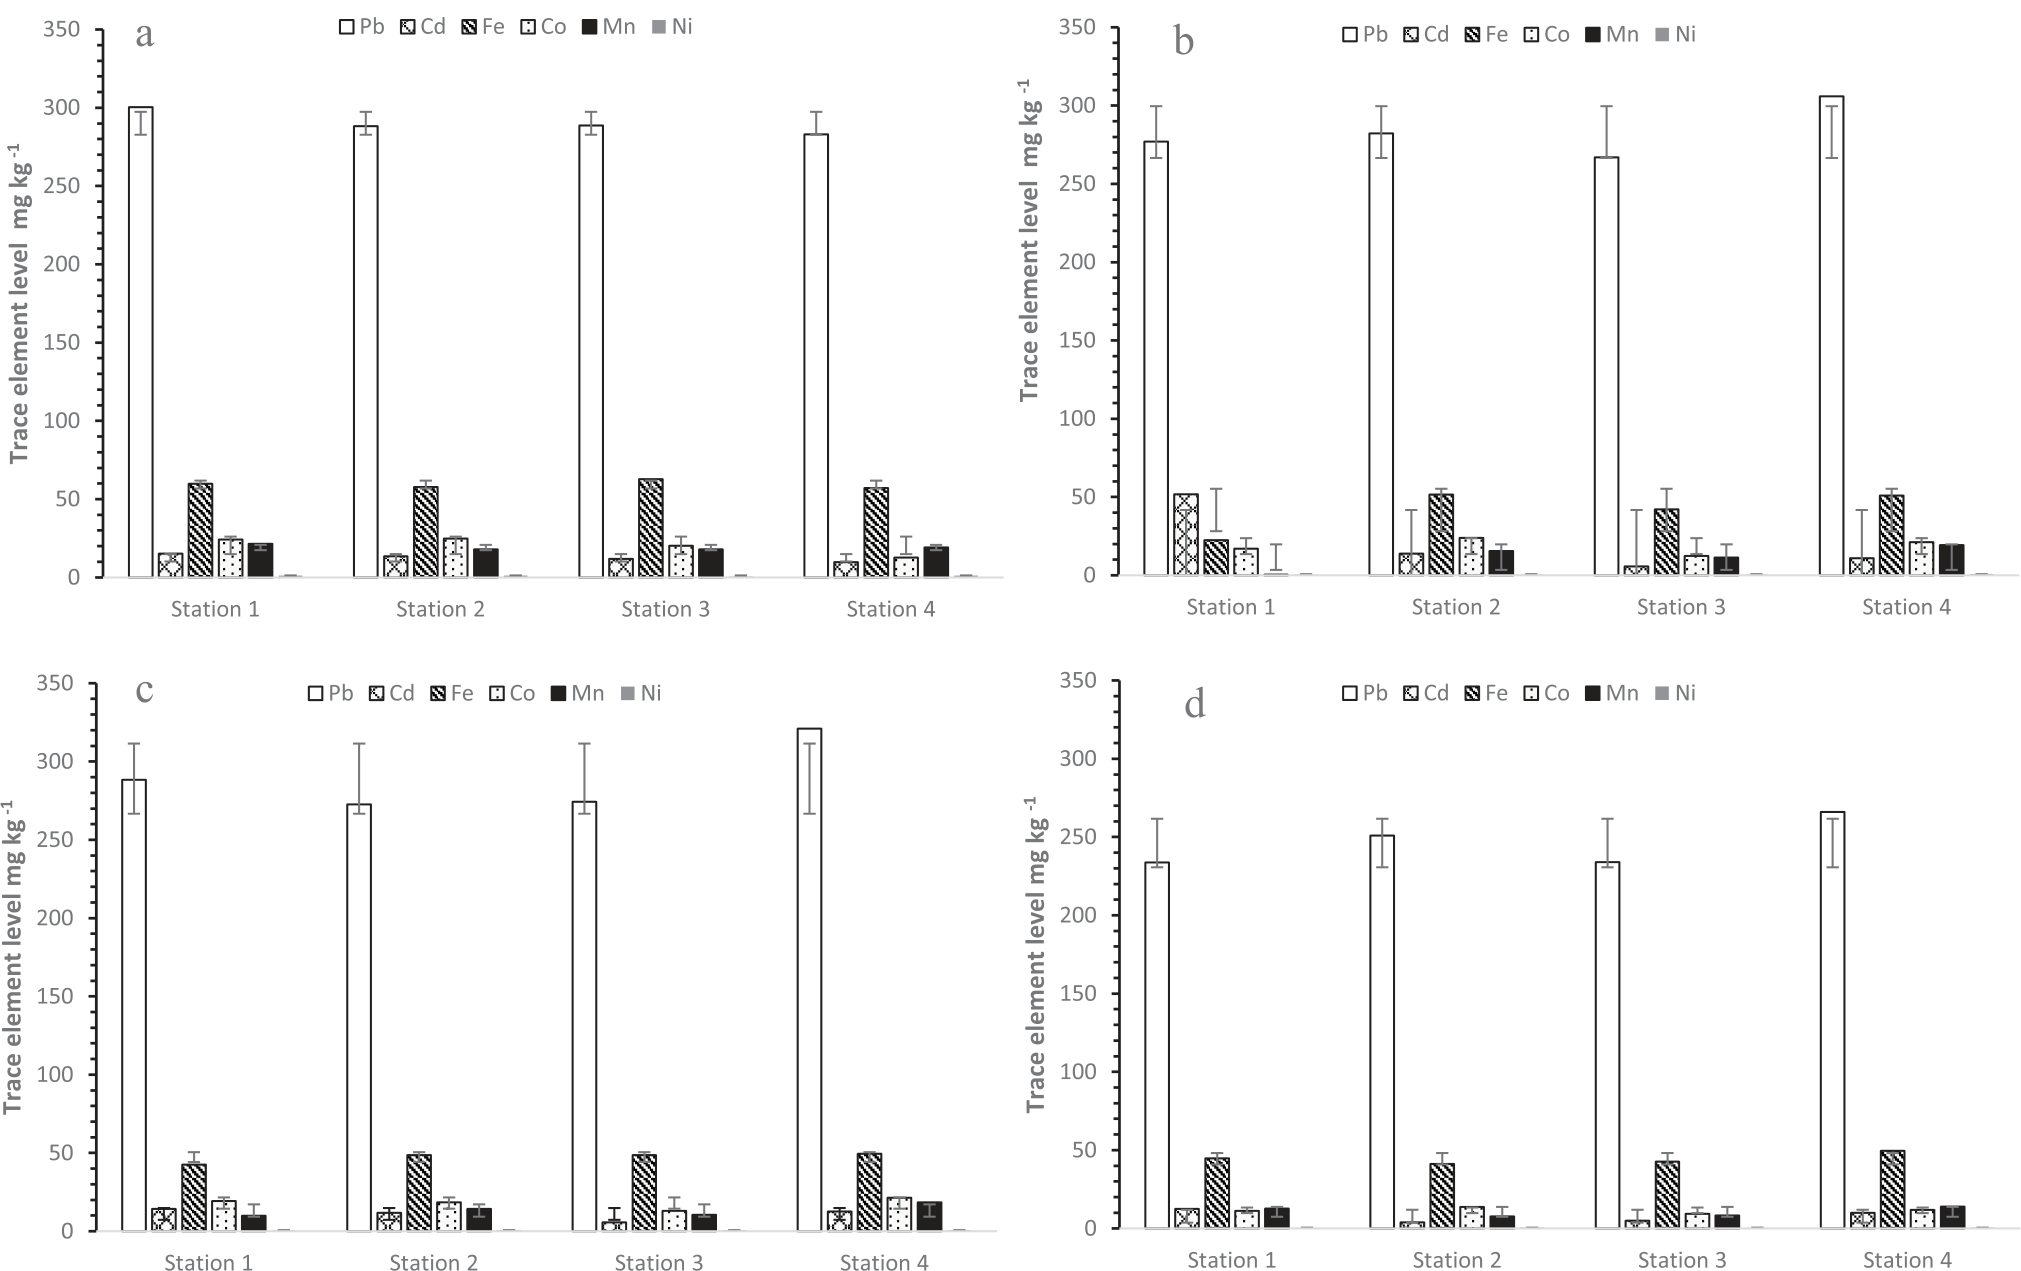
Fig. 7.
Spatial variation of trace element levels in Physa gyrina, Spring (a), Summer (b), Autumn (c), and Winter (d) at stations sampled in the Tigris River of Baghdad City from March 2022 to February 2023.
Discussion
Dissolved Trace Elements
The spatial variation of trace element levels was mapped to identify the major influences on their distribution. Statistical analysis was employed to evaluate their status and variance, while multivariate and Canonical Correspondence Analysis (CCA) was used to investigate the associations among elements and to discuss the most probable sources of these elements in the study area [33].
The seasonal variation of the mean concentrations of Pb, Cd, Fe, and Ni trace elements in dissolved water, particulate suspended matter, and sediment studied in four sampled stations showed that concentrations of Cd in station 3 (Al-Dora Area) and station 4 (Al-Zafaraniya Area) were greater than the allowed WHO Cd limit by 9.83% and 8%, respectively (Table 2). This is a specific indication of water pollution by Cd, which can be attributed to a different source of pollution. Specifically, station 3 (Al-Dora Area) was closed to a number of industrial activities where the effluents can contain high concentrations of Cd directly released into water bodies [34]. Furthermore, station 4 (Al-Zafaraniya Area) was a conjunction site for disposing of municipal waste and sewage sludge into the river, which resulted in water contamination by Cd (Al-Azzawi et al., 2015). Also, there are a number of mining activities in this location that can release Cd into the environment. On the other hand, runoff from mining sites can possibly carry Cd into water bodies [25]. However, it should be noted that the chemical analysis has indicated that the other trace elements of Pb, Fe, and Ni in dissolved water are within the WHO standards [35].
The most alarming tested element was Pb, which showed a maximum level of about 78 and 84% of the WHO limit in stations 3 and 4, respectively (Table 2). Accordingly, this can be considered a risk of possible contamination of Pb in the Tigris River. Furthermore, the elevated Pb concentrations in stations 3 and 4 could be explained almost by a proportional level increase of Cd [14].
The statistical results confirmed that Cd can also be influenced by seasonal variation. The Cd has registered greater values than the WHO limit in three seasons, i.e., spring, summer, and autumn. The solubility and mobility of Cd in water can be affected by temperature [36]. The increasing temperature during spring and summer may facilitate Cd dispersion and transportation from a variety of sources. Nonetheless, a large percentage of rainfall in winter can be responsible for decreased Cd concentration because of a high degree of dilution [37, 38]. Furthermore, water source pollution was influenced by the processes of urbanization, along with increasing vehicle numbers, resulting in heavy metal contamination of roadway dust, exposing large populations in metropolitan areas to contaminants, and increasing the risk to public health is high in areas with high densities close to the city center [39]. Street dust contains a variety of contaminants, including heavy metals, which may be harmful to city inhabitants' health. So far, research on the levels of this danger has been carried out mostly in big cities, defined by substantial vehicle traffic and industrial activity [40].
Suspended Particulate Matter
The suspended particulate matter is the suspended material that includes free ions of elements or organic and inorganic chemicals that are later divided into biotic (zooplankton, phytoplankton, bacteria, fungi, etc.) and abiotic compounds, including clays, silts, feldspars, quarts, etc. [41, 42]. This study showed that the concentrations of Co, Mn, and Ni in the particulate suspended matter were higher than those registered in the dissolved water. This can be explained by the influence of turbidity due to a significant contribution of phytoplankton and zooplankton, which accumulated these trace elements [17]. Additionally, when an element dissolves in water, it forms suspended colloids that can be linked to the clay and organic matter of water [33, 43, 44], and therefore, it can occur in higher concentrations of particulate matter. In fact, Co, Mn, and Ni have a high tendency to adsorb and bond, which might be the reason to be adsorbed into the clay. In this regard, Habib et al. [26] indicated that erosion and soil drift from nearby land can cause an increase in trace element concentrations [26]. However, it should be noted that concentrations of all these trace elements in particulate matter have not exceeded the acceptable limit set by WHO.
This study showed that the concentration of Pb was approximately close to the WHO limit in stations 1 (Al-Rashdea Area) and 2 (Bab Al-Moazam Area). Al-Rashdea is an agricultural area that uses fertilizers and herbicides containing Pb, with possible leakage of this trace element during the agricultural runoff to water bodies [14]. Bab Al-Moazam is an urban area with a dense infrastructure and industrial activities besides vehicular traffic [26]. Pb can contaminate water bodies through runoff from rooftops, highways, and other urban surfaces [45].
Sediments
Solid particles known as sediments, which can be either organic or inorganic, sink to the bottom of liquid-filled bodies of water and build up over time [45]. Numerous substances can be found in these particles, including sand, silt, clay, decomposing plant and animal debris, and minerals. Sediments are usually carried by water, ice, or wind, and as the fluid holding them moves more slowly, the sediments settle out of the transporting medium. Sedimentary rocks were created when collected sediments underwent cementation and compaction over an extended period [46]. The information sediments tell us about past climates, geological histories, and ecological circumstances plays a critical role in geological and environmental processes [23]. This study showed that the highest concentration of Mn in sediments was observed in station 3 (A-Dora area) and is caused by human activities like mining, industrial discharges, and medical wastewater. In fact, Mn exceeded the WHO limit during spring (Table 5). Hence, Rind et al. (2024) showed that sediment emerged as the main source of trace element contamination; the bottom-feeder fish accumulated more metal in their livers than column and surface feeders. The presence of suspended sediments worked as adsorbents, reducing the concentration of pollutants in the water column [14]. Mn becomes more soluble under specific conditions and accumulates in sediments during these times. The elevated biological activity during spring can be explained by the breakdown of the organic materials in sediments [47].
Benthic Invertebrates
Trace element concentrations were studied in benthic invertebrates and compared to those recorded in other media. Fe concentrations were higher in Oligochaetes and Corbicula fluminalis than those revealed in dissolved water, particulate suspended matter, and sediments. Fe is an essential micronutrient for all eukaryotes and most prokaryotes [1]. As for Ni, Oligochaetes concentrations were higher than those measured in Corbicula fluminalis and Physa gyrina in all sampled stations. These results disagree with Raju (2014), who stated that the concentrations of Ni were more important in Mollusca than in Crustaceans and Annelida [48]. The high concentration of trace elements revealed in Oligochaetes can be attributed to their ability to bioaccumulate these in soft tissues [27, 43]. Cd is a toxic trace element due to its long half-life in biological systems [23]. This study showed that the concentration of Cd was low in benthic invertebrates in all studied stations. Moreover, the elevated Cd concentrations clearly reflect the influences of anthropogenic activities. Additionally, the bioaccumulation of trace elements can be influenced by the effective exposure of organisms by either a change in trace element speciation or relative distribution between particles of different sizes and densities [49]. The present investigation proved that gastropods are able to accumulate high levels of trace elements compared to other benthic organisms, such as Oligochaetes and bivalves. Similar results indicated that gastropods are able to filter large volumes of water and accumulate trace elements in their bodies without negative effects [48].
The trace element concentration levels in aquatic organisms can be affected by different environmental factors such as pH, water hardness, and suspended particulate matter [27]. The feeding mechanism also plays an important role in trace element uptake. In fact, bivalves ingest trace elements associated with organic and inorganic matter in the water column, whereas snails accumulate them from periphyton and associated organic matter. As for Oligochaetes, they ingest the trace elements adsorbed on organic and inorganic sediment particles [50]. Furthermore, many studies have shown that trace elements accumulate in aquatic organisms and may cause health risks. For instance, Naz et al. [25] observed a progressive rise in metal concentrations in fish muscles, which humans routinely ingest. This disturbing trend is risky for the broad public [14]. Furthermore, some studies used fish species as a potential health risk for individuals who consume large quantities of fish species from the Tigris River and should be used under a future project of biomonitoring programs as a bioindicator for trace element contamination and a relevant tool for water quality assessment in the Tigris River [51].
Canonical Correspondence Analysis
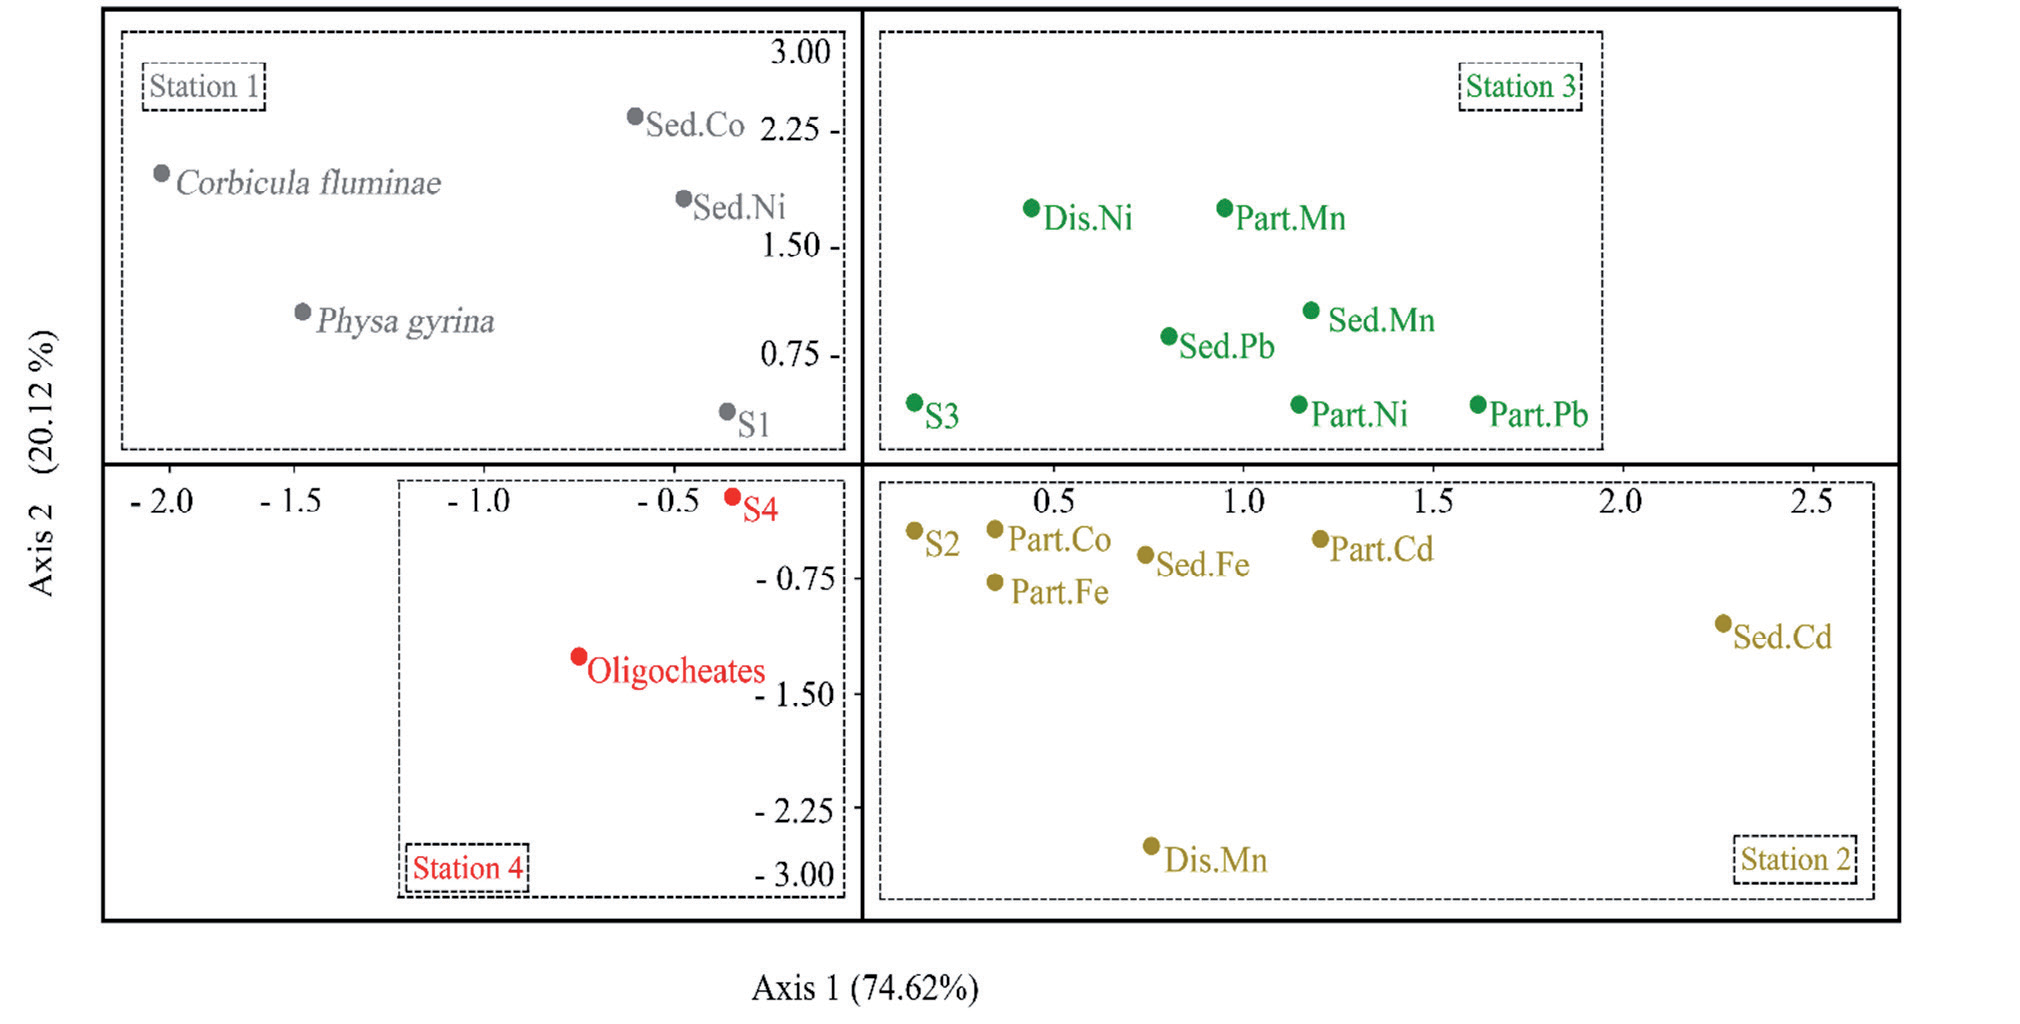
The CCA analysis showed that the F1 and F2 axes selected 74.62 and 24.31% of the total biogeochemical analyzed parameters (Fig. 8). The F1 axis negatively selected stations 2 and 4 with some trace Fe, Cd, and Co in suspended particulate matter. Station 4, which is close to the south of Baghdad before the conjunction of the Tigris and Diyala rivers, recorded the highest values of Cd in sediment and Oligochaetes. The F1 axis also positively selected stations 1 and 3 with Corbicula fluminalis and Physa gyrina. The high concentration in station 1 (Al-Rashdea Area) was recorded in sediment with Co trace element. Specifically, station 1 is located at the northern Baghdad gate, an agricultural area rich with palm groves and orange trees [25].
The CCA analysis revealed that the waste from the medical city of station 2 (Bab Al-Moazam Area) and the waste of the Al Dora power plant of station 3 is responsible for the water pollution with Mn, Pb, Co, Fe, and Cd and sediment with Pb, Cd, and Mn. Meanwhile, it should be noted that these areas have several factories, such as the battery manufacturing plant and electrical industry, in addition to a number of power production plants [26]. Last but not least, these areas suffer from the disposal of massive quantities of industrial wastewater and sewage directly released into water bodies, which contain trace elements such as Fe, Cd, P, Mn, and Ni [52].
Bioconcentration Factor (BCF) and Biosedimentation Factor (BSF)
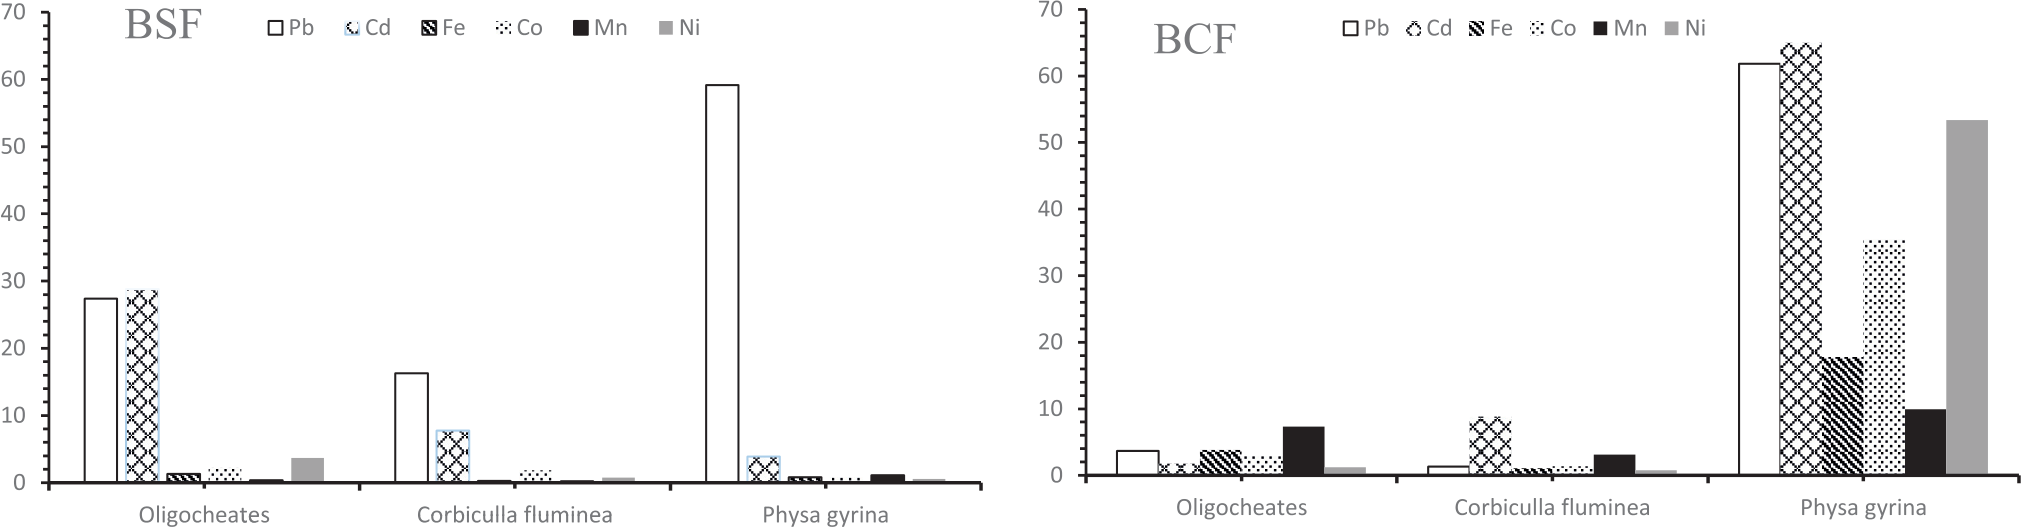
The BCF and BSF are potential bioindicators for successfully assessing environmental pollution status [28]. Six trace elements in different samples of benthic organisms in the Tigris River were quantified with a Bioconcentration Factor (BCF) and Biosedimentation Factor (BSF). The BCF analysis measured in this study shows the following order: Oligochaetes > Physa gyrina > Corbicula fluminalis for all trace elements in all sampled stations (Table 6 and Fig. 9). Pb recorded the highest value of BCF (6186), whereas the lowest value was (962). The BCF for Physa gyrina ranged between 78 for Ni and 1324 for Pb. The BCF recorded the lowest value of 124 for Ni compared to the highest value of 386 for Fe. For the BSF analysis, the data revealed the following order: Oligochaetes > Corbicula fluminalis > Physa gyrina for the most trace elements except Pb in Physa gyrina, which recorded the highest BSF for all benthic invertebrates, while Mn showed the lowest value of BSF (0.28) (Table 6 and Fig. 9). These BCF and BSF values may be explained by human anthropogenic inputs such as industrial and agricultural activities and municipal wastewaters. The high Fe and Pb contents observed in benthic invertebrates can be generated by phytoplankton uptake, which involves Fe pathways [14]. These trace elements are vital to enzymes and hemocyanin. Benthic invertebrates accumulated trace elements from the surrounding environment at much higher concentrations than the suspended particulate matter and dissolved water, which were used as the main bioindicator assessment tools for environmental pollution status in the Tigris River water [50].
Conclusions
This current study aimed to assess the concentrations of trace elements (Pb, Cd, Fe, Co, Mn, and Ni) in dissolved water, particulate suspended matter, sediment, and benthic fauna collected from four stations along the Tigris River in Baghdad, Iraq. This study attempted to identify pollution indicators among benthic species (Physa gyrina, Corbicula fluminea, and Oligochaetes) and evaluated the influence of unregulated industrial and sewage discharges on trace element contamination, predominantly concentrating on the WHO limit for overall high contamination levels of Pb and Cd. The results indicated a wide fluctuation in trace element concentrations in dissolved water and the studied benthic invertebrates. The detected concentrations of Cd in station 3 (near the power plant) and station 4 (Al-Zafaraniya area) were greater than the allowed WHO limit for Cd by 9.83 and 8%, respectively. The uncontrolled disposal of industrial effluents and sewage, which are immediately released into water bodies, is the main reason behind the high level of Cd in the dissolved water in stations 3 and 4. The concentrations of Pb and Fe were higher than the other trace elements in benthic species; meanwhile, Ni was the least concentrated trace element overall. Pb, which exceeded the WHO limit, reached about 78 and 84% in stations 3 and 4, respectively. This has been considered an alarming water contamination situation in the Tigris River. Meanwhile, dissolved water’s other trace elements (Pb, Fe, and Ni) were within the WHO standards. The higher concentrations of Pb, Cd, Fe, and Ni in the benthic invertebrates compared to dissolved water and sediment were caused by the bioaccumulation efficiency in the sampled stations. The biosedimentation of Pb and Fe in the benthic organisms was significantly different compared to the other trace elements, which suggested the ability of these organisms to specifically accumulate these trace elements.
The CCA showed that Mn, Pb, Co, Fe, and Cd contaminated the particle-suspended matter. However, sediment was more polluted by Pb, Cd, and Mn. The waste from medical city hospitals and the Al-Dora power plant directly releases these trace elements into water bodies. Additionally, all biosedimentation factors for trace elements in benthic invertebrates ranged between 0.2 and 59.14 and were classified according to their concentrations as follows: Pb>Cd>Co>Ni>Fe>Mn. The benthic organisms such as Physa gyrina, Corbicula fluminea, and Oligochaetes were the most benthic invertebrates, which accumulated all the studied trace elements at high levels. However, Physa gyrina had the highest bioaccumulation levels for Pb and Mn.

