

Introduction
Anthropogenic activities and climate changes affect the hydrological regime of rivers [1-4]. They also affect erosion in the river basin and sensitively increase the load of river sediment in small and medium-sized basins. An important measure of soil erosion, transport, and deposition of river sediment is sediment loading by human activities [5, 6]. Natural water pollutants are volcanic eruptions, earthquakes, forest fires, and penetration of deep underground water into surface water. Anthropogenic factors of water pollution with heavy metals are municipal and industrial wastewater, washing from agricultural land, use of pesticides, fertilizers, manure, and deforestation [7-13]. Many countries are to implement various programs and regulations to monitor, control, or restrict their release into the environment [14].
These factors contribute to the appearance of increased concentrations of heavy metals and 16 essential nutrients in crop development. There are several methods for determining mobility and readily available metals in sediment. Sediment pollution with heavy metals is important to monitor due to their stability, non-biodegradability, chronic-acute toxicity, persistence, and bioaccumulation along the food chain, endangering people, natural ecosystems, and other organisms [15-25].
Heavy metals in river sediments have a natural and anthropogenic origin [26-35]. Heavy metals are non-degradable inorganic substances that accumulate and spread in nature, especially in soil, water, and river sediment, where they end up in the food chain, posing a danger to the environment. and living beings that live in it [36, 37]. They are present in the environment and through the erosive action of water, especially after large floods and the washing of particles (minerals) [22]. They accumulate in the sediments of rivers, lakes, and sea areas all over the world. In the aquatic environment, they are distributed in such a way that they dissolve in water in the form of colloids, suspended forms, and sediment phases [38-42].
In the water column, the concentration of heavy metals is significantly lower than in the sediment due to the deposition of metal ions and its influence on the absorption, hydrolysis, and coprecipitation of metal ions [43, 44].
The transport of heavy metals from water to sediment depends on the chemical speciation of heavy metals and the conditions of the aquatic environment [27, 45, 46].
The main reservoirs of metals in waters are sediments. Sediments are an essential component of river and lake ecosystems. Sediments perform major ecological functions, most of which are essential for the good functioning of biogeochemical cycles [25, 47, 48]. Sediment particles can carry agricultural and industrial toxic compounds and, if released into the habitat, can be harmful to aquatic biota from primary producers to consumers [15]. In times of high water, the transport of river sediment along the upstream-downstream gradient of the river is the main way of introducing metals into ecosystems [28]. Sediments are very suitable for long-term monitoring of heavy metals in ecosystems due to their lower variability than in water.
The interaction of heavy metals with water and sediment represents a major risk for the aquatic environment [26, 29, 36]. When absorbed in the sediments, heavy metals have a very low degree of toxicity, but with the change in environmental conditions, their exposure to living organisms increases and water quality deteriorates. Physicochemical characteristics of water, such as pH and salinity, mineralogy, specific surface area, and cation exchange capacity, strongly influence these interactions [6]. The aim of this research was to determine the content of heavy metals (Cd, Аs, Cu, Fe, Hg, Pb, Ni, and Zn) in the water and sediment of the Ljucha River. The River Ljucha was chosen for the reason that it is the main tributary of the Plav Lake and it produces the largest amount of sediment that reduces the surface and volume of Plav Lake. Furthermore, Lake Plav is extremely important for the survival of plant and animal species.
Materials and Methods
Study Area
The river Ljucha is formed by the joining of the Vruja and the Grncar, downstream from Gusinje. It is the largest tributary of Lake Plav. The Grncar River originates in Albania from Skrobotusa and the Vucje stream near Velipolje. It flows under the name Vrmosa to the Albanian-Montenegrin border. The source of Skrobotusa is located on the Vila mountain, near Rikavcko Lake. Vruja springs from several karst springs on the eastern slopes of Vezir's Beard, the largest and most famous of which is Savina oko (Oko Skakavica). The top of the basin is below the sharp, steep, and bare peaks of Prokletije, where karst forms of erosion are represented.
The length of the river Ljucha is 11.1 km until it flows into Lake Plav. It cuts a bed over moraine and fluviglacial sediment and constantly fills Lake Plav with sediment of various sizes. It has a drop in the river bed of 10 m, or 0.76 m/km. Its bed is cut into flioglacial drift. It ends with a delta in Lake Plav and meanders like a lowland river. The flow of the Ljucha is practically the same as that of the river Lim in Plav and amounts to 21 m3/s. The area of the Ljucha River basin is 138.5 km2. The tributaries of the Ljucha deposited sediments on the rim and bottom of the basin where the villages of Krusnjevo, Visnjevo, Hakanje, and Martinovici are located. The Ljucha receives several tributaries from the left and right sides, the largest being the Martinovic stream [49]. On the right side, the tributaries end in the form of mountains on the edge of the basin and are used to irrigate agricultural areas. The longest course of the river Ljucha originates in the territory of Montenegro on the mountain Zijovo, where after joining the three streams Kupala, Proucki, and Vrelo, it crosses the territory of Albania and forms the Ljumi and the Vermosit with the stream Skrobotusa. The Plav-Gusinje region has a modified, so-called more humid submountain climate, which at altitudes of over 1000- 1300 m above sea level changes to a mountain climate. It is characterized by a relatively short and fairly cool summer and a fairly long, moderately cold, and snowy winter. The springs are shorter and colder, and the autumns are longer and warmer. The average annual air temperature is 7.6 °C. Areas that are up to 1500 m above sea level have four months of temperatures below zero, and higher areas five. The warmest month is July with an average temperature of 18.2°C, and the coldest is January with a temperature of -1°C. The maximum rainfall in January is 156 mm and the minimum in July is 64 mm. The number of days in a year with an air temperature equal to and higher than 25ºC ranges from 49.6 days [50]. The municipality of Plav does not have a wastewater treatment plant, so all wastewater flows into the Ljucha River from sewage pipes and septic tanks, which are in large numbers near the research site. Among the most significant negative anthropogenic factors stand: inadequate management and unplanned (uncontrolled) cutting of forests, failure to maintain watercourses, constructed culverts of insufficient permeability (due to backfilling with silt), use of water as garbage dumps, discharge of untreated wastewater, and degraded pastures. Intensive erosion processes have been observed in the Lucha River basin. Fluvial erosion is pronounced in the form of the destruction of banks, meandering, and the creation of deltas. When there is high water, the river Ljucha overflows its bed and floods the surrounding agricultural areas. Significant quantities of pesticides and mineral fertilizers are washed off agricultural land, which contributes to the change in the water quality of the Ljucha River. Not a single industry has been developed in the Ljucha River basin [51]. Fig. 1 shows the process of fluvial erosion along the bed of the river Ljucha.
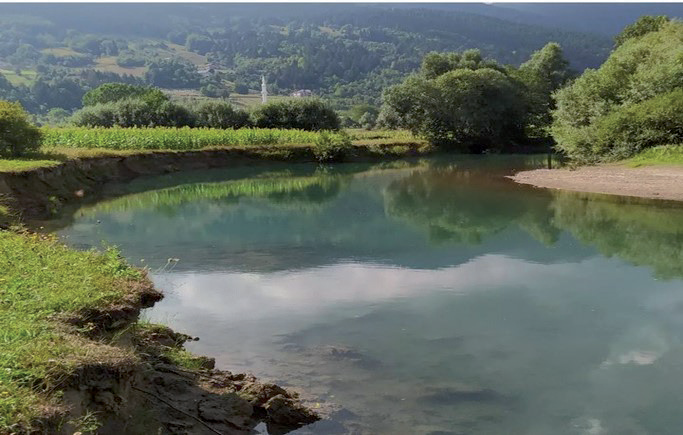
Table 1.
Method of land use in the Ljucha river basin (%).
Table 1 gives a numerical representation of land use methods in the Ljucha River basin. The most common are bare (26.73%), degraded forests (26.04%), and forests (19.02%).
The method of land use, as one of the factors determining soil resistance to erosion processes, in the basin of the river Ljucha is diverse - from high mountain rocky bare areas through forest zones that are thinned in places like pastures and meadows, up to fertile arable land. It establishes the greatest protection against erosion in forest vegetation, but also meadows and pastures, if they are in good condition, provide good protection.
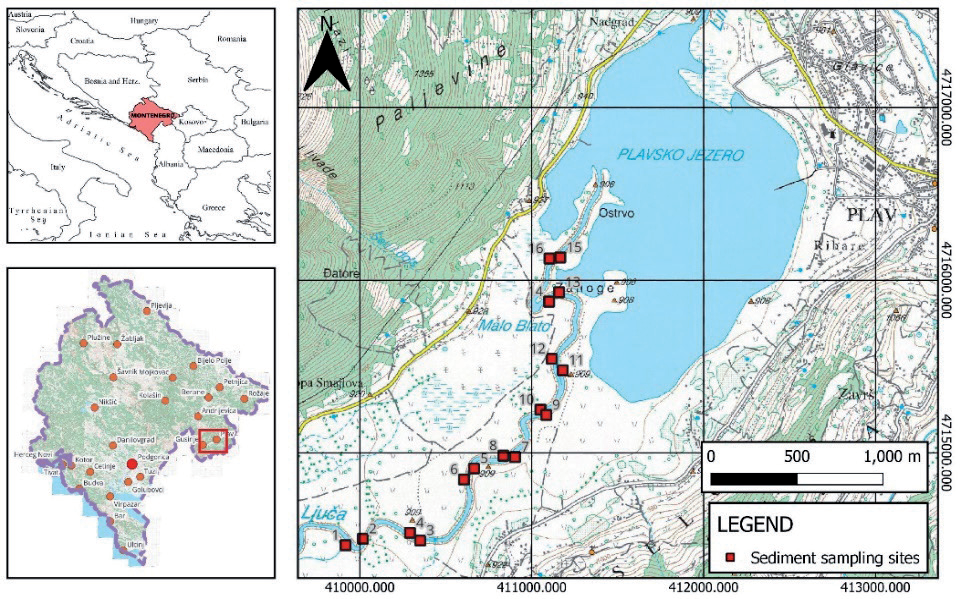
Table 2.
Geographical coordinates of heavy metal sampling in the water and sediment.
Locations and Sampling Period
Sampling of water and sediments of the river Ljucha was carried out in January and February 2024. The selection of sampling locations is in accordance with the specific characteristics of the terrain, accessibility, geological composition, and anthropogenic activities. We collected water and sediment samples upstream from the mouth of the Ljucha River into Lake Plav at nine locations. Fig. 2 shows the sampling locations. The samples were collected from the right and left banks of the river Ljucha. The first sample was taken 100 meters from the mouth of the river Ljucha into the lake. Others every 200 m upstream. We collected sediments (n = 20) using an Ekman excavator at a depth of 30 cm. After that, we mixed the sediment, stored it in plastic bags, and transported it to the laboratory. Water samples were collected at a depth of 0.50 m from the surface of the water. Samples were collected in polyethylene bottles of one liter, after which they were stored in a hand-held refrigerator until delivery to the laboratory. Concentrations of heavy metals in water are expressed in micrograms per liter, µg/L, and for sediments in mg/ kg of wet mass.
The localities of the samples taken are near settlements (Maritinici, Sarkinovici) and households engaged in agriculture. They are overgrown with stunted vegetation, a large number of illegal landfills, liquid fertilizers, and sewage outlets. The terrain is heavily exposed to erosion, with a large number of ruined banks in the entire research area, from 30 m to 300 m long. There are no noticeable anti-erosion measures that involve the performance of biological and biotechnical works. In the riverbed, there are no torrential barriers made of stone or hydroaccumulations that would prevent sediment from moving from the Ljucha riverbed towards the Plav Lake, which flows into it. Livestock herds are present near the sites, which gravitate towards the coast and prevent its regeneration. Animal husbandry was developed in the sampling locations. Plantings with autochthonous vegetation have not been carried out for many years, which caused high erodibility of the banks [51]. Table 2 gives the geographical coordinates of the locations of the collected samples.
Table 3.
Quality standards and recommendations for sediment according to the Dutch methodology, Canadian legislation, ICPDR and the Regulation of the limit values of pollutant substances in surface and underground waters and sediment and deadlines for their achievement (Republic of Serbia).
Monitoring Parameters
The water quality parameters of the Ljucha River were measured at nine locations. The following parameters were measured: copper (Cu), lead (Pb), zinc (Zn), cadmium (Cd), mercury (Hg), nickel (Ni), iron (Fe), and arsenic (As). The obtained values were used to calculate the ratio of metal concentration in water and sediment. To determine the ecological and chemical status of water in accordance with environmental quality standards for priority substances, priority hazardous substances, and specific pollutants, the regulation on the categorization of hazardous substances in water was used (Official Gazette of Montenegro 5/2011 32/11, 48/15, 52/16, and 84/18) [52]. The concentrations of heavy metals in surface waters according to this regulation are cadmium 0.04 µg/L, mercury 0.025 µg/L, copper 1.0 µg/L, chromium 1.2 µg/L, zinc 4.2 µg/L. For the purpose of comparing research data, we used the regulation on hazardous and harmful substances in waters, 2007 Bosnia and Herzegovina [53], and the rulebook on the method and deadlines for determining the status of surface waters of Montenegro [52]. The concentrations of metals following this regulation are: cadmium 0, 5 µg/L, mercury 0.02 µg/L, copper 2-10 µg/L, zinc 50-80 µg/L, lead 2 µg/L, arsenic 50 µg/L, iron 100 µg/L, nickel 15- 30 µg/L. The water of the river Ljuča is in class A1CK1. According to the Montenegrin regulations, the concentrations of mercury are: 0.07 µg/L, nickel 34 µg/L, and cadmium ≤ 0.45 µg/L 21 μg/L.
The application of sediment quality assessment guidelines is very useful in terms of detecting sediment contamination by comparing sediment concentrations with quality guidelines [38]. Montenegro does not have the appropriate regulations for assessing the quality of sediments, so we compared the results obtained in the sediment of the Ljucha River with the Serbian regulation on the limit values of pollutants in surface water, underground water, sediment, and deadlines for their submission to Canadian and Dutch legislation for sediment quality (Table 3). [54-56]. On the basis of Canadian legislation, two values are defined: the lower value of ISQGs (Interim Sediment Quality Guidelines) represents temporary recommendations obtained theoretically and above which there is a possible impact on aquatic organisms, while the higher value is PEL (Probable effect level), above which the impact on aquatic organisms is likely.
Laboratory Analyses and Work Techniques
Laboratory analyses of water and sediments were performed at the Center for Ecotoxicological Research of Montenegro in Podgorica. The content of heavy metals in water was determined using the ICP-OES technique (inductively coupled plasma, optical emission spectrometry). The mercury content in the water was determined using a direct mercury analyzer, while the samples were prepared by microwave digestion according to the Montenegrin standard MEST EN 13805: 2009. Calibration curves in the ICP-OES technique for determining the metal content in water were constructed using solutions prepared by diluting basic solutions to 1000 mg of each element per liter produced by BT Baker. Table 4 gives values for operating wavelengths and practical limits of quantification.
Table 4.
Wavelengths and practical limits of quantification.
| Metals | Operating wavelengths | Practical limits of qualification (mg/L) |
|---|---|---|
| Cu | 324.8 | 0.001 |
| Pb | 283.3 | 0.005 |
| Zn | 213.9 | 0.002 |
| Hg | 225.6 | 0.0005 |
| As | 224.5 | 0.0005 |
| Cd | 228.8 | 0.001 |
| Ni | 248.3 | 0.001 |
| Fe | 248.3 | 0.002 |
For the purposes of determining the metal content in the sediment, the EPA 3051 method was used (https:// www.epa.gov/labs/laboratory-methods, accessed on 10 March 2021, Washington DC, USA). A homogenized sample of 0.5 grams was weighed, sieved on a sieve with a diameter of 0.05 mm, then placed in an immersion vessel to which nitric acid (9 ml) and concentrated hydrochloric acid (3 mL) were added. The container was then closed and placed in a microwave oven under pressure. After digestion, the cooled sample was transferred to volumetric bottles of 25 ml and filled up to the mark with deionized water. The analysis of metal content in the prepared samples was determined using ICP-OES, Thermo iCAP7400 (Thermo Fisher Scientific, Waltham, MA, USA). Calibration was determined using solutions prepared by diluting stock standard solutions of 1000 mg of each element per L manufactured by Sigma Aldrich (Sigma Aldrich, St. Louis, MO, USA).
The mercury content of the sediment samples was determined by using a modern mercury analyzer, AMA-254, Leco (Leco Corporation, St. Joseph, MI, USA). Solutions are prepared by diluting stock standard solutions 1000 mg per l of each element using the manufacturer Sigma Aldrich (Sigma Aldrich, St. Louis, MO, USA). Reference material with extended measurement uncertainty and limits of quantification was established at the Ecotoxicological Center.
Statistical Analysis
Then correlation of metal content in sediment samples at nine locations was done by using Pearson's and Sperman's coefficients. Statistical confidence was set at ɑ= 0.05. Statistical data processing was done by using IBM SPSS v.26 software.
Contamination Factor
The contamination factor is known as the individual pollution index. It shows the anthropogenic impact on environmental pollution. It represents the ratio of the concentration of metals in the researched area to the average value of the concentration of heavy metals in the unpolluted soil of Europe. The contamination factor (CF) was calculated based on the formula:
Contamination levels can be classified based on their intensity on a scale ranging from 1-6: 0 = none, 1 = none to medium, 2 = moderate, 3 = moderate to heavy pollution, 4 = heavy pollution, 5 = heavy to very strong, ≥ 6 = very strong pollution [56]. According to the CF value, six classes of pollution were created, where the highest class corresponds to the metal concentration value that is one hundred times higher than that in the polluted soil.
Enrichment Factor (EF)
The saturation factor is used to distinguish between heavy metals of natural origin and those originating from anthropogenic activities [57]. For the calculation, it is necessary to choose the background structure and the reference material, which can strongly influence the result of the calculation. The reference material is often conservative, as are the most frequently analyzed elements, such as Fe, Me, Mn, Sc, and Al.
According to Ergin et al., EF (heavy metal saturation factor) is defined as follows:
Contamination levels can be classified based on their intensity on a scale ranging from 1 to 6 (0 = absence of saturation, 1 = absence to medium saturation, 2 = moderate, 3 = moderate to heavy, 4 = heavy pollution, 5 = heavy to very severe pollution, 6 = very severe). If EF has a value between 0.5 and 1.5, the examined metal has a natural origin; if EF is greater than 1.5, then its origin is anthropogenic [57, 58].
Index of Potential Environmental Risk
By using the index of potential environmental risk (PERI or RI), the potential environmental risk caused by heavy metals in the soil can be assessed. With the help of this method, four parameters such as concentration, type of pollutant, level of toxicity, and sensitivity of the water body in the soil can be evaluated. RI is calculated as the sum of all risk factors for heavy metals in soil. The potential risk index is calculated and defined according to the following equation:
Table 5.
Reference values (Cn i) and toxicity coefficients (Tr i) of heavy metals in sediments.
| Heavy metals | As | Cd | Cr | Cu | Hg | Ni | Pb | Zn |
|---|---|---|---|---|---|---|---|---|
| Cni (μg/g) | 9.50 | 0.30 | 123.20 | 28.30 | 0.10 | 57.00 | 19.80 | 84.00 |
| Tri | 10 | 30 | 2 | 5 | 40 | 5 | 5 | 1 |
Eri is a one-member potential ecological risk factor, Tri is a toxic response factor to a given substance, which explains the given substance, which takes into account the given substance, the toxic requirement, and the sensitivity requirement, Cfi is the contamination factor, Coi is the metal concentration in the sediment, and Cni is the reference value for metals (Table 5).
Eri is described in five categories: Eri<40 (low), 40 Eri<80 (moderate), 80≤Eri<160 (considerable), 160≤ Eri 320 (high), and Eri≥320 (very high). RI is an index of the potential environmental risk of heavy metals and represents the sensitivity of different biological communities to toxic substances and follows the following conditions: RI˂150 (low), 150≤RI<300 (moderate), 300≤RI<600 (considerable), and RI≥600 (very high) [57]. The index of potential ecological risk of individual metals Eri was calculated based on the following expression:
Ecological and Chemical Status of the Water of the River Ljucha
In order to define the chemical status of water, the priority hazardous substances (PAH) for cadmium, mercury, and lead were determined and compared with the maximum allowed MPC (Maximum Permissible Concentration) concentrations, while for the definition of the ecological status, specific pollutants were determined, namely copper (Cu), zinc (Zn), and arsenic (As), which were compared with MPC (Maximum Permissible Concentration) and NC (natural concentration), which are defined as specific pollutants in accordance with the Environmental Quality Standards [52].
Results and Discussion
The content of heavy metals in the water of the river Ljucha is shown in Table 6. Of the nine metals examined, Ni and As are the most represented, while the concentrations of Cd, Cu, Hg, Zn, Pb, and Fe were below the reference values. It was found that chemical elements are present in the following order: Ni>As>Zn>Cu>Fe>Pb>Cd>Hg. The obtained concentrations of As ranged from (0.2-0.68 µg/L), mercury (<0.05 µg/L), Cd (<0.1 µg/L), Cu (<1 µg/L), Zn (<5 µg/L), Pb (<0.2 µg/L), Fe (<025 µg/L), and were lower compared to the values (As<10 µg/L, Cd<2 µg/l, Cu<2 µg/L, Hg< 1µg/L, Fe from 37.7 µg/L in Grncar river to 115.4 µg/L -Lim) measured during October 2017 in previous studies in the rivers Grncar, Vruja, Lim at 7 locations, Alipasins sources, Oka Skakvice. Also, the measured values of heavy metals (As, Cd, Hg, Pb, Zn, Fe. Cu) in the water of Ljucha were lower compared to the values obtained by research in the rivers Lim at two locations (As<20, Hg<1, Cd<2, Cu = 2.42-2.52, Zn = 7.13- 38.01, Pb = 2.57-3.12, Fe = 0.05), Grncar (As<20, Hg<1, Cd<2, Cu = 2.10, Zn = 20.85, Pb = <2, Fe = 0.03,) and Vruja (As<20, Hg<1, Cd<2, Cu = <2, Zn = 2.39, Pb = <2, Fe = 0.04) in April 2018 [51]. The measured values of As (0.2–14.4), Cd (0.04–2.10), Hg (0.1–2.1), Pb (0.045– 10.20), Cu (1-93), Zn (1–122.70), and Ni (1–163.90) in the waters of the Save, Tisza, Kolubara, Tamis, and West Morava rivers were higher than the values recorded in this study [59].
Table 6.
Concentration of heavy metals in water samples of the river Ljucha, Montenegro.
Nickel concentrations ranged from 0.24 to 0.98 μg/L. By comparing the values obtained with the regulation on hazardous and harmful substances in water (2007, Bosnia and Herzegovina, 15-30 μg/l], nickel is below the permitted value, but also the value prescribed by the Montenegrin rulebook on the method and deadlines for determining the status of surface waters (34 μg/l). It is widely distributed in water, air, and soil, although its functional role as a trace element for animals and humans is still unknown [42]. Čkamak [60] determined a small amount of Ni in the waters of the Kolubara, while author Bikić [61] did not detect Ni (0.30-0.87 μg/L) in all the analyzed water samples during the investigation of the quality of surface in the River Bosna upstream and downstream from the industrial plants. The obtained results are in agreement with the results obtained in the river Ljucha. Research by Chipev shows that there is no excess of this metal (Ni=0.0057±0.01812) in Great Timok in concentrations exceeding the MPC [62]. In their research, author Dević [59] states that the content of Ni in the rivers of Serbia has increased (1-163.90), which is the key factor in the deterioration of the water quality of the rivers of Serbia [59]. Nickel concentrations found in the river Ljucha were lower compared to the values found in the rivers Grlja (<2 μg/L), Vruja (<2 μg/L), and Lim at the source (11.3 μg/L), and in the Lim River at other 5 locations in the municipality Plav at 5 investigated locations (<2 μg/L) around 2017. Also, the obtained nickel concentrations in the river Ljucha were lower compared to the concentrations found in Vruja (5.06 μg/L), Grncar (5.35 μg/L), Lim at two locations (L1-5.49 μg/L, L2-4.63 μg/L), Alipasins sources (5.16 μg/L), and Oku Skakavice (4.63 μg/L) in April 2018, which may be related to taking samples during the spring when there are intensive agricultural activities in this part and a greater influx of tourists [51].
Arsenic is known as a hazardous heavy metal, a persistent pollutant in the environment that creates serious environmental, health, and agricultural problems and risks to humans. Chronic arsenic pollution is recognized as a worldwide problem [42]. The highest concentration of As was found in sample LJ 9 at a distance of almost 1 km from the Ljucha River to Plav Lake and was 0.95 µg/L. As concentration levels followed the following trend: location LJ1 (< 2 mg/L), LJ 2 (0.25 µg/L), LJ 3 (0.23 µg/L), LJ 4 (0.24 µg/L), LJ 5 (0.24 µg/L), LJ 6 (0.23 µg/L), LJ 7 (0.95 µg/L), LJ 8 (0.68 µg/L), LJ 9 (0.23 µg/L) and were below the maximum allowed values of the Montenegrin Rulebook and Regulation on Hazardous and Harmful Substances in Water 2007, Bosnia and Herzegovina). The found values of Hg, Zn, Cu, Cd, Fe, and Pb were below the maximum allowed concentrations according to national and foreign legislation [52, 53]. In relation to our results, author Pivic found an increased concentration of As in the water of the Kolubara River above the MAC (Maximum allowed concentration), citing the consequences of drought, low water levels, and anthropogenic activity as the cause [63]. Research by Dević indicates an increased content of As (0.2–14.4 µg/L) in the waters of Serbia [59]. A low content of As (<0.01 μg/L) was detected in the water of the river Lim in 2015 for four seasons (spring, summer, autumn, winter), which is in agreement with our results. [64].
The decreasing trend of metals in the sediment is as follows: Fe>Ni>Zn>Cu>Pb> As>Hg>Cd Table 7. For all nine locations, iron, nickel, and arsenic had the highest accumulation values. The values of Cd (<0.2), Pb (6.4- 9.6), Zn (41-56), and Cu (16-26) measured in the river Ljucha were lower compared to the values (Cd = 1.28– 10.5 mg kg; Pb = 57.8–318 mg kg; Zn = 66.7–1,095 mg kg) measured in the rivers Tisza, Pek, and West Morava [64]. In relation to the Ljucha river, the measurement of heavy metals in Grlja sediments from 2017 showed a higher concentration of lead (Pb = 5.81 mg/kg), cadmium (Cd = 1.53 mg/kg), zinc (Zn = 120.54 mg/kg), copper (57.71 mg/kg), and mercury (Hg = 1.20mg/kg). Compared to previous studies in the rivers Bistrica, Ljesnica, and Ljubovidja, Lim conducted by the Institute of Seismology and Hydrology of Montenegro, the values for As (4.6-25 mg/kg), Pb (8.8-20 mg/kg), Hg (0.061- 0.190 mg/kg), Cu (19-27 mg/kg), and Zn (47-72 mg/kg) were higher than the values obtained in this study, but they are within the limits provided by the regulations [65]. Concentrations for cadmium, mercury, and lead did not exceed the reference values of the assessment of the Dutch methodology and are lower than the lower values of the Canadian recommendation, the target values of the ICPDR (The International Commission for the Protection of the Danube River), as well as the SRLVsS (Serbian regulation of limit values of pollutant substances into surface water, groundwater, and sediments and the deadlines for their attainment). Similar research was carried out by analyzing the rivers Bistrica, Ljesnica, and Ljubovidja in 2022 [65]. The concentration values of copper (16-26 mg/kg) and zinc (41-56) were not prescribed by the Canadian and Dutch methodologies, but they were lower than the values prescribed by the Serbian regulation of limit values of pollutant substances into surface water, groundwater, and sediments and the deadlines for their attainment (SRLVsS).
Table 7.
Concentration of heavy metals in sediment samples of the Ljucha River, Montenegro.
The concentrations of nickel (87-119) in the sediment at all nine investigated locations of the Ljucha River (Table 7) exceeded the target and maximum allowed values, according to the Serbian regulation of limit values of pollutant substances into surface water, groundwater, and sediments and the deadlines for their attainment (SRLVsS). Increased content of nickel (44- 53 mg/kg) was also found in the Tisza River, whose values exceeded the maximum permitted concentrations according to SRLVsS and international Canadian legislation (44-53 mg/kg), but were lower than the measured values in the river Ljucha. The range of nickel (117.99 mg/kg) concentrations in the examined sediments of the Ljucha River (sample 8) during 2024 coincides with the nickel values found in the Grlja River, but is higher than the values found in the Danube River (33.2-70.8) and Tisza River (39.2-47.7). [51, 64] Also, the content of Ni in this study was lower compared to research conducted in the rivers Danube (D1 33.2-D9 70.8) and Tisza (T1 39.2-T9 46.3) during 2008 [66].
The values for arsenic did not exceed the reference and inverted values of the Dutch methodology, but they were higher than the values (PEL) of the Canadian methodology in the samples taken at a distance from the mouth of the river Ljucha to Lake Plav from 300 m to 2 km, i.e., in samples LJ 2, LJ 3, LJ 4, LJ 5, LJ 6, LJ 7, and LJ 9. In relation to the ICPDR (The International Commission for the Protection of the Danube River), the concentrations found in all nine samples are lower, but also in relation to the Serbian regulation of limit values of pollutant substances in surface water, groundwater, and sediments and the deadlines for their attainment (SRLVsS). According to research, the concentration of arsenic in the Tisza River (14.80-19.00 mg/kg) shows values that are below the limit values of the influence concentration (TECs), but below the probable effect concentration (PECs) [57]. In the rivers Ljubovidja and Lim (location Dobrakovo, place Bijelo Polje) in 2022, an increased content of arsenic of (14 mg/kg) was detected, which can have a significant impact on aquatic organisms, which is higher compared to our research area for all samples. Also in the river Grlja, which gravitates with its catchment towards Ljucha, the content of As was higher and amounted to 10.86 mg/kg. [51, 65]. The iron content exceeded the higher values (PEL) of the Canadian methodology and the maximum allowed concentration according to the Serbian regulation of limit values of pollutant substances in surface water, groundwater, and sediments and the deadlines for their attainment (SRLVsS). Comparing the obtained values for Fe (22641-30086 mg/kg) in this study with the literature data of the surrounding countries, we see that the results mostly agree with the results in Serbia, rivers Tisza, Danube, Toplica, Pek, Porecka river, Western Morava, and Ibar (Fe = 33.105–62.800 mg/kg) and results in Montenegro, Grlja river (Fe = 38540.63 mg/kg). The values are slightly higher in the river Grlja (basin of the river Ljucha), assuming that the samples were taken during the autumn season of 2017. Compared to our observations, Fe concentrations (43,224.00- 47-420.50 mg/kg) in the river Tisza during 2010 were higher [51, 57, 66].
Similar research was carried out by analyzing the rivers Bistrica, Ljesnica, and Ljubovidja in 2022 [65]. The concentration values of copper (16-26 mg/kg) and zinc (41-56) were not prescribed by the Canadian and Dutch methodologies, but they were lower than the values prescribed by the Serbian regulation of limit values of pollutant substances into surface water, groundwater, and sediments and the deadlines for their attainment (SRLVsS).
Statistical Analysis
Statistical analysis showed that there is a positive correlation between the following metals in the sediment of the Ljuča River with statistical significance: between copper and nickel, rho = 0.920; p<0.001, zinc and nickel, rho = 0.920; p<0.05, p = 0.22, zinc, and cadmium rho = .684*, p<0.05, p = 0.042, cadmium, and lead rho = 0.669, p<0.05, p = 0.049, nickel, and copper rho = .920, but it is not statistically significant p<0.001, nickel, and lead, rho = 0.854, p<0.05, p = 0.003, zinc, and arsenic, rho = 0.286; p>0.05; p = 0.456, copper, and lead, rho = .818, p<0.05, p = 0.07, and it is extremely weak and not statistically significant (Table 8).
Table 8.
Pearson correlation coefficient.
Contamination Factor
The values of the contamination factor for the nine examined metals in the sediments and water at nine different locations of the Ljucha River are presented in Tables 9 and 10.
The range of CF for all examined metals is less than one except for Hg. The mercury value is greater than one moderately contamination 1<CF<3, which shows that there is an anthropogenic influence on the water of the river Ljuča. A generally decreasing series of CF for all tested metals in the water of the river Ljucha moved: Hg>Zn>Pb>Ni>Cu>Cd>As>Fe.
CF ranges in the sediment are: Zn (0.098-0.0130), As (0.002-0.090), Hg (0.039-0.063), Cd (0.016-0.033), Cu (0.364-0.500), Pb (0.021-0.031), Ni (1,977-2,659), and Fe (151.953-201.919). The value of the contamination factor in the sediment is very high contamination for Fe and Ni, which indicates a significant anthropogenic impact on the sediment of the Ljucha River by these two metals. For other elements, the CF values indicated no metal enrichment. The descending sequence of CF for all investigated metals in the sediment of the river Ljucha is as follows: Fe>Ni>Cu>Zn>Hg>Pb>Cd>As. Recorded values for Cu, Cd, Zn, Ni, and As (moderate to very high contamination, CF>6) in the Pek River were higher compared to the values recorded in this study [66].
The contamination factor for Fe is higher in the sediments of the Ljucha River compared to the CF Fe (0.26-0.56) of the sediments of the Ibar, Sava, West, and Sout Morava rivers. The CF for copper (Cu) is higher in the sediment of the rivers: West Morava, Sout Morava, Sava, Ibar, Toplica, and Nisava (1.92-75.67) compared to our calculated values. Other CF values for Zn (1.71- 16.43), As (0.26-8.08), Cd (1.57-8.23), and Pb (0.86-5.51) in the rivers Sava, Toplica, Nisava, West, and Southern Morava were higher than the values calculated for the sediment river Ljucha.
The authors [66] state that high values of CF in sediments may be a consequence of inadequate treatment of municipal, industrial, and construction waste, wastewater discharge, and mobilization of heavy metals in sediments due to physical and chemical changes in the relationship between sediments and water, geological characteristics, and hydrometeorological conditions [66].
Enrichment Factor (EF)
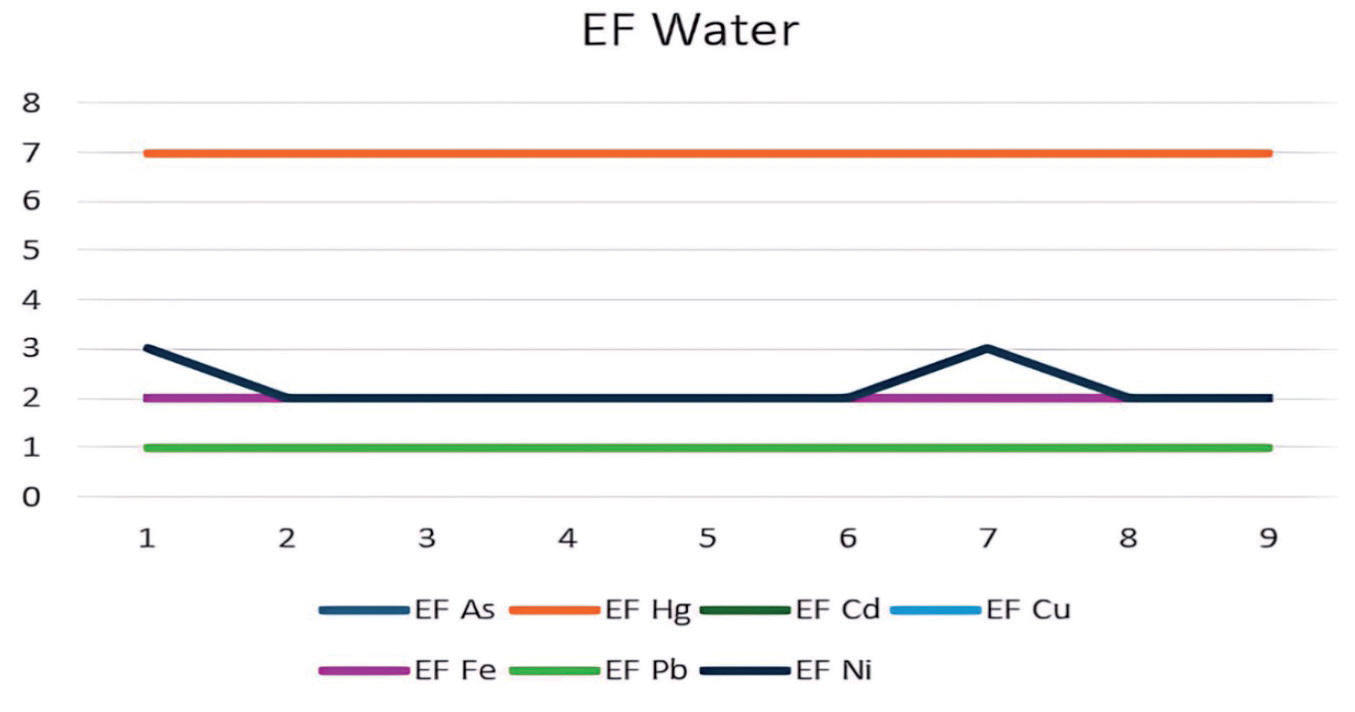
In order to determine the level of heavy metals in the river Ljucha and its surroundings, we calculated the saturation factor. Zn was used as a reference material for distinguishing natural from anthropogenic components. The metals Cd, Cu, Ni, and As have a saturation factor of less than one (<1) in the river Ljucha, less than three (<3) of Pb and Ni in seven locations, and very strong saturation (25≤E<10) was recorded for mercury (Table 11, Fig. 3). From the point of view of pollution, EF for Hg in the river Ljucha was the largest among the investigated elements, indicating significant contamination of the water of the river Ljucha at all nine investigated locations. The mercury values obtained are related to anthropogenic influence.
Table 9.
Values of contamination factors in the water of the river Ljucha, Montenegro.
Table 10.
Values of contamination factors in the sediment of the river Ljucha, Montenegro.
Table 11.
Heavy metal enrichment factor in Ljucha river water, Montenegro.
It was determined that the enrichment factor of the Ljucha River sediment with heavy metals does not exceed the moderate saturation level (EF 3–5) for copper, and values less than one (<1) were recorded for Cd, Pb, and As. The results of the research are given in Table 12 and Fig. 4. The maximum value for nickel (19.545-22.644) and iron (1488.206-1771.433) shows that the sediment is enriched with this metal. The measured values of Ef factors Cu, Cd, Ni, and As for our research area were lower compared to the values recorded in the river Pek (Cu = 35.03, Cd = 8.18, Zn = 14.3). While in the Pek River, the EF factor was the highest for Cu, indicating significant contamination at this location, in our research area the highest Ef was recorded for Fe (1771.433) at location number two (LJ2) [57]. Results obtained by calculating the ratio between EF/Al and EF/ Fe show absence to medium saturation (EF<1) for Cd, Cr, Mn, Ni, and Pb; moderate saturation of sediments (EF<3) for some metals at the locations T5, and T7; Danube-D5; Great Morava-V1, and Toplica-To, which is in agreement with our results for metals As, Hg, Cd, Pb (EF<1) and Cu (EF<3) where sediments are moderate to moderately heavily saturated. While in our research extremely heavy saturation of the sediment with heavy metals was recorded for Fe, very heavy for Ni, in the rivers Danube, Tisza, Nisava, and Sava was recorded for Cd (extremely severe enrichment), Pb (severe enrichment), and Zn (moderately severe enrichment) [66].
Potential Ecological Risk
The potential ecological risk index was used to assess the state of sediment saturation with heavy metals and the degree of potential ecological risk. Using the equations (4,5,6) and parameters given in Table 13, we calculated the potential environmental risk index Eri and RI for each location.
Eri single-member potential ecological risk factor (Table 14, Fig. 5) for all metals in the river sediments of the Ljucha River shows a low potential ecological risk ( Eri<40), except for Fe, which had a high potential ecological risk at all locations (160≤Eri320). Comparing the values obtained in this research with the literature data of the country in the environment Eri<40 (low), we see that the results are similar to the results in Serbia for Cr, Ni, Pb, Zn, and As of the river Danube, except for arsenic at two locations in the Ibar river and Fe in the river Ljucha (160≤Eri 320). [66]. River sediments in the Tisza River at all sites show low potential ecological risk for all analyzed metals (Cu = 10.88-14.04, As = 15.58- 20, Ni = 3.99-4.40, Pb = 10.61-14.14, and Zn = 3.32-4.15), except Hg (68-144) that had moderate and considerable risk and Cd (150-280) that had high potential ecological risk for all sites. All these values were higher compared to the results obtained for the river Ljucha, except for Fe [57].
Table 12.
Heavy metal enrichment factor in Ljucha river sediment, Montenegro.
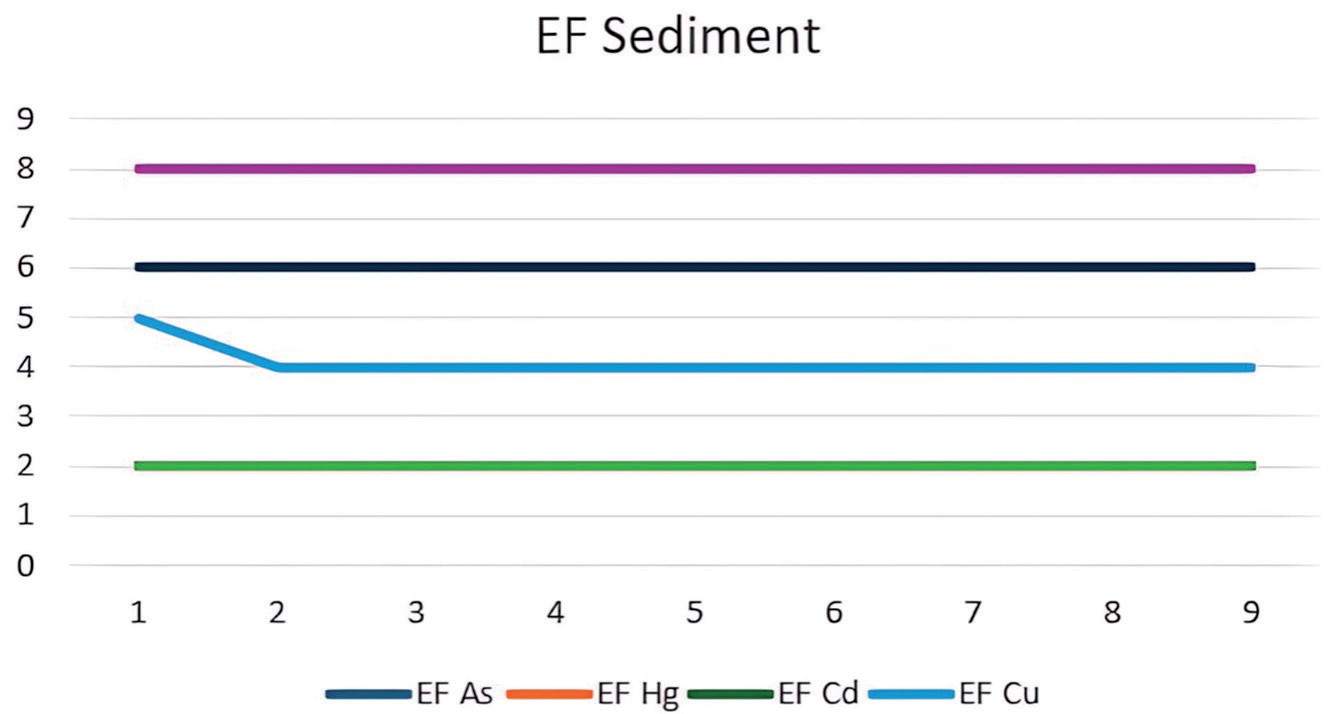
Table 13.
Reference values (Cn i ) and toxicity coefficients (Cr i) of heavy metals in sediments.
| Zn | As | Hg | Cd | Cu | Fe | Pb | Ni | |
|---|---|---|---|---|---|---|---|---|
| Tri | 1 | 10 | 40 | 30 | 5 | 1 | 5 | 5 |
| Cni (μg/g) | 84.00 | 9.50 | 0.10 | 0.30 | 28.30 | 100.00 | 19.80 | 57.00 |
Table 14.
Heavy metal potential ecological risk indexes in the sediment of the river Ljucha, Montenegro.
The total heavy metal potential ecological risk index (RI) for all metals indicates that the metal samples in the sediments had a moderate (150≤ RI< 300) and significant potential ecological risk (300≤ RI< 600). This high total heavy metal potential ecological risk index (RI) can have a significant impact on aquatic organisms. Similar RI values were also recorded in the Tisza River (RI = 275.97-458.26) [57]. Our results coincide with the research results of two sediment samples from the Ibar River and one from the Pek River, which had high values (300–600), which indicates a high ecological risk of these elements [66].
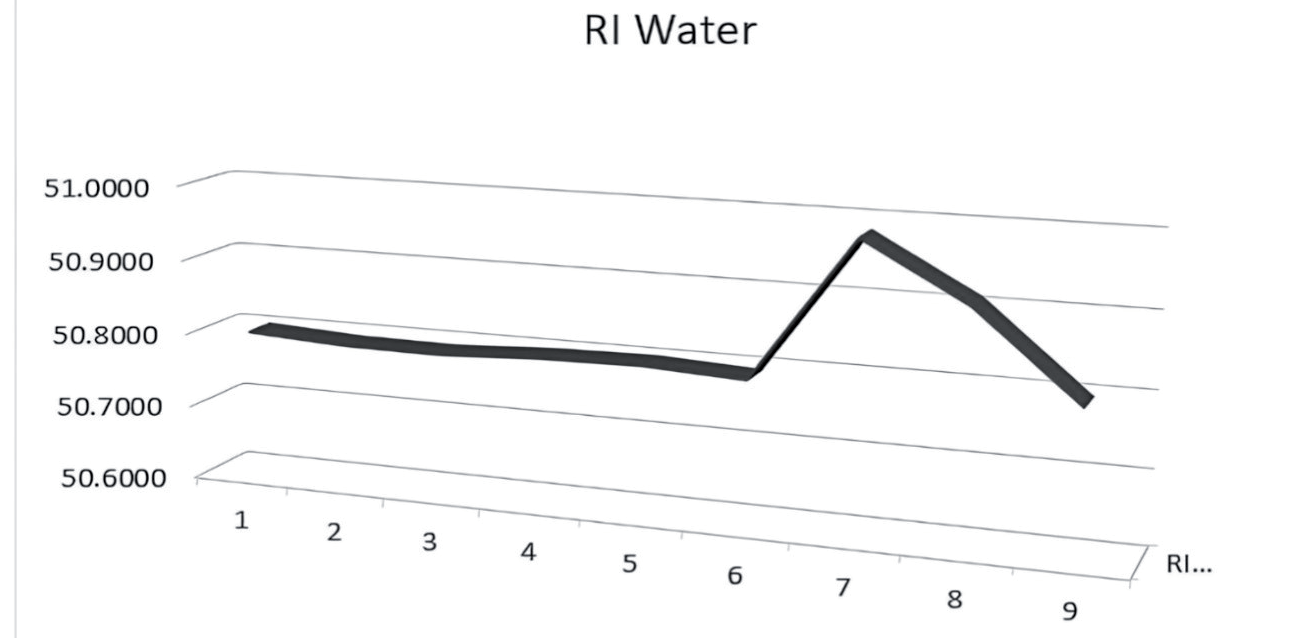
Table 15 provides data for the potential environmental risk in the water of the Ljucha River. The highest values were recorded for mercury (Eri = 50). The potential RI values were generally lower than 150 (RI<150), which suggests that water from the river catchments exhibited low ecological (RI = 50) risk for the investigated elements (Table 15, Fig. 6). Similar values of low potential ecological risk (RI<150) in water were obtained in the rivers Timok (RI = 1.57-14.51), Bela (RI = 79.28), and Bor (RI = 128.50). Higher values of RI (moderate RI) were recorded in the Krivelj River before conjunction with the Bor River, Majdanpek, Small Pek River (before the influence of waste waters), and wastewater from mine Bor (significantly high RI). [62].
Fig. 5.
Heavy metal potential ecological risk indexes in the sediment of the river Ljucha, Montenegro.
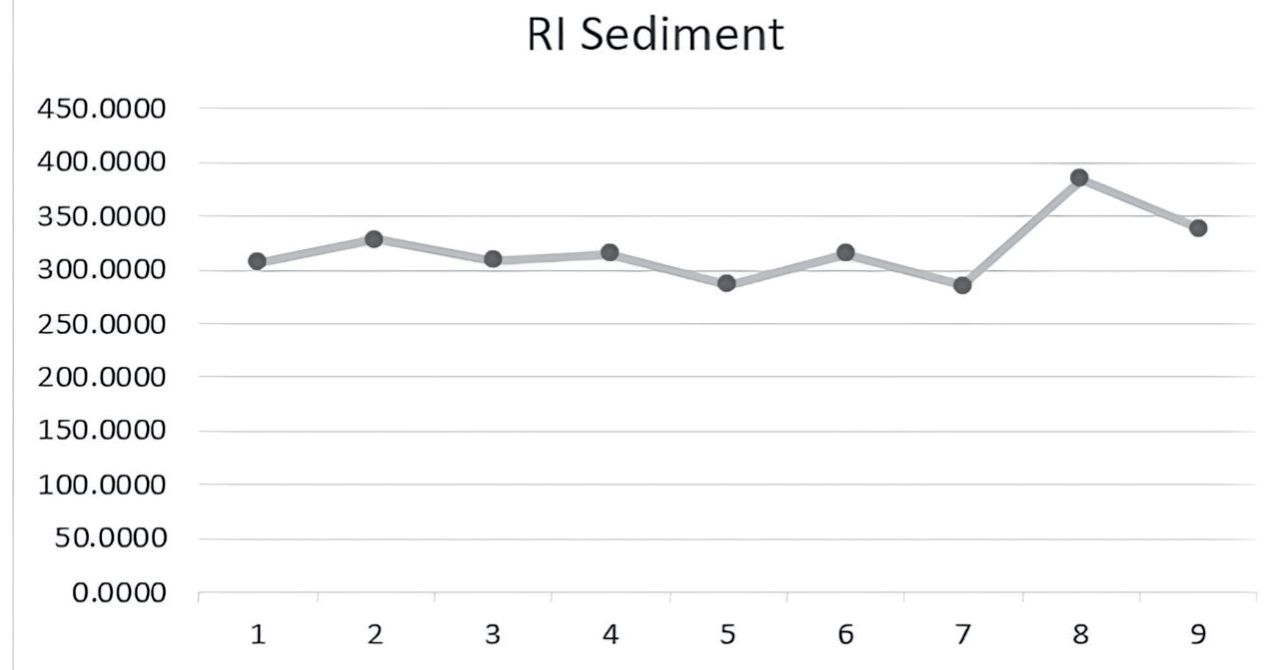
Table 15.
Heavy metal potential ecological risk indexes in the water river Ljucha, Montenegro.
Ecological and Chemical Status
The assessment of the chemical status of PHS (priority hazardous substances) is based on the concentration of the following metals in water: Cd, Hg, and Pb in relation to the maximum allowed concentrations for surface water.
All three metals have lower values compared to the MPC for surface water. According to the environmental quality standard based on the WFD [67], if one element has a higher value, then the chemical status cannot be described as good. Based on the obtained values of copper <1 in relation to MPC (Maximum permissible concentrations) + NC (natural concentration) (MPC+ NC = 73 μg/L+ 1 μg/L), zinc (Zn) <5 μg/L (MPC+ NC = 78 μg/L + 4.2 μg/L), and arsenic (As) 0.25- 0.95 μg/L (MPC+ NC = 0.7 μg/L+21 μg/L), which are defined as specific pollutants within the Environmental Quality Standards, found values are less than natural concentrations, which indicates the fact that the water of the river Ljucha has a good ecological status [52, 68, 69]. The data obtained during the research in the periods of high and low water (October 2017 and April 2018) in the rivers Grncar, Vruja, Lim, Oko Skakavica, and Plav Lake (into which the river Ljucha flows) show a good ecological and chemical status, which is in accordance with our results [51]. The data also agree with the data of the state monitoring conducted by the Institute of Seismology and Hydrology of Montenegro [70].
Conclusion
Based on the research conducted in the Ljucha River, the following conclusions can be drawn:
a) Concentrations of heavy metals in the water of the river Ljucha on the left and right banks did not exceed the maximum allowed values provided by the regulations.
b) The concentrations of Cu, Zn, Pb, Cd, and Hg in the sediments of the river Ljucha were within the values defined in the regulations. An exception occurs for Ni and Fe at all nine locations whose values exceeded the target and maximum allowed values of the Serbian Rulebook and As at eight locations (LJ 2, LJ 3, LJ 4, LJ 5, LJ 6, LJ 7) whose measured values exceeded the limits values according to the Kanada Rulebook. Increased iron concentrations can be of lithogenic origin.
c) Based on the value of the contamination factor, the sediments were classified as low-contaminated CF<1 with the examined metals, except for a couple of samples where the sediments were classified as moderately 1≤CF<1 to highly contaminated 3≤CF<1 with Ni and Fe. The highest values of CF in water were recorded for Hg.
d) The Ljucha River sediments showed no saturation for Cd and Pb, while they showed moderate to strong saturation for copper, severe for nickel, and extremely severe for iron. The water of the river Ljucha showed the highest mercury saturation (25≤EF<10-severe), which is related to the natural and anthropogenic influence on the entire basin.
e) Potential ecological risk for the Ljucha River sediments shows a low potential ecological risk for all metals at all locations, except for Fe, which had a high potential ecological risk at all locations.
f) The total index (RI) of potential ecological risk for all metals leads to the conclusion that the metal samples in the sediments had a moderate (150≤RI<300) and significant potential ecological risk (300≤RI< 600).
g) The chemical status based on the analysis of PS (priority substances) and PHS (priority hazardous substances) is good, but also the ecological status based on specific substances.
h) Agricultural activities that can cause pollution in the river Ljucha include poor animal husbandry practices, overgrazed grasslands, and overuse and excessive use, including untimely application of pesticides, plowing over irrigated fields, and application of fertilizers. Geological and hydrological processes and climate changes represent natural factors that affect the quality of water and sediments of the Ljucha River, and they can take place gradually or quickly.
i) Changes in land use pattern, including changes in land cover, river siltation due to erosion, nutrient loading in waters, run-off from degraded forest areas, sewage discharge, and other domestic activities, also adversely affect water flow and quality.
j) Sediments depict the history of the Ljucha River and past events; therefore, they can represent secondary sources of heavy metals, and research on heavy metals in sediments provides significant insight into the contamination of the aquatic environment with heavy metals.
k) The results obtained in this research can be used as a reference for research in the future because they show the heavy metal pollution of the river Ljucha. Further analysis is needed to assess the pollution status of the mentioned localities in other seasons (spring, summer, autumn), considering that there is a significant release of heavy metals from agriculture, wastewater, and septic tanks.
l) In order to mitigate the influence of natural factors on the water quality of the Ljucha River, it is proposed to afforest alluvial terraces with autochthonous vegetation and build stone barriers (gabions) and geotextile substrates in the wet part of the river bed.
m) Statistical correlation shows a certain relationship between metals in sediments, which was greatest between copper and nickel, rho = 0.920; p< 0.001, zinc and nickel, rho = 0.920.

