

Introduction
China's economy has steadily moved into a high-quality development stage, but the early crude agricultural production methods have caused serious damage to the ecological environment. Meanwhile, with the global focus on carbon emissions and the frequent occurrence of extreme weather, the living environment and biodiversity of human beings have been severely challenged. According to the IPCC's Fourth Assessment Report, carbon emissions from agriculture are the second largest contributor to global greenhouse gas emissions, accounting for about one-third of total carbon emissions [1].
At the 15th Conference of the Parties to the Convention on Biological Diversity (CBD) in 2021, General Secretary Xi Jinping proposed to incorporate "carbon peaking and carbon neutrality" into the overall layout of ecological civilization construction. Under the new period, finding out the transformation path of low-carbon development of agriculture and realizing the virtuous cycle of the agro-ecological environment and the healthy and sustainable development of the agricultural economy has become an urgent problem of China's current agricultural development.
The Southwest region, including Chongqing, Sichuan, Guizhou, Yunnan, and Tibet Autonomous Region, is an important part of China's geography and culture. With the active promotion of the "Belt and Road" initiative and the Western Development Strategy, the region's economic development and the optimization and upgrading of its industrial structure have received a significant boost. This has provided new growth points and opportunities for the region's economy. However, constrained by its unique natural geography and historically deficient industrial system, the Southwest region still faces a number of challenges on its path toward high-quality economic development. These challenges include, but are not limited to, the fact that the current development model is still on the crude side, the insufficiently solid quality foundation of economic development, the incongruity between energy advantages and economic growth, and the significance of economic disparities within the region. The existence of these problems poses substantial challenges to the future sustainable development of the region [2]. With a very special geographic location, large natural forest reserves, and rich biodiversity, the Southwest region is an ecological barrier in China and plays an important role in the construction of China's ecological civilization [3]. However, subject to the influence of regional ecology and industrial structure, it still faces a series of problems in terms of ecological environments, such as strong dependence on resource development, the excessive proportion of heavy industry, high energy consumption in output value, ecological fragility, and serious environmental pollution, etc. [4]. The ecological environment is still facing a series of problems such as strong dependence on resource development, high energy consumption of output, ecological fragility, and serious environmental pollution.
This paper takes Southwest China as the research object, constructs the evaluation index system of agricultural carbon emission, ecological environment, and agricultural economy, builds the coupling coordination model to measure the coupling coordination level of agricultural carbon emission, ecological environment, and rural economy in Southwest China from 2012 to 2021, analyzes its spatial and temporal evolution, and applies the obstacle model to analyze factors hindering the coordinated development of the system. This model is intended to provide a theoretical basis for the transformation of low-carbon agricultural development in Southwest China, which is of practical significance for coping with global climate change and realizing the green transformation of the agricultural economy.
Literature Review
As low-carbon development has become a global consensus, more and more scholars are studying the relationship between agricultural carbon emissions, ecological environment, and agricultural economy, which mainly includes three aspects:
First, research on agricultural carbon emissions. Academic research on agricultural carbon emissions mainly focuses on the measurement of agricultural carbon emissions, the spatial and temporal evolution of carbon emissions, the factors affecting carbon emissions, and the prediction of carbon emissions. From the point of view of carbon emission measurement, the current main measurement methods include the IPCC inventory method, the life cycle assessment method, the carbon emission forecasting method [5], the Life Cycle Assessment (LCA) method [6], and the Input-Output Analysis (IOA) method [7]. The main measurement methods include the IPCC inventory method, life cycle assessment method, and input-output analysis method. For the spatial and temporal evolution of carbon emissions, scholars widely use the kernel density method and the Malmquist index method [8]. Scholars widely use the Kernel Density Method and the Malmquist Index Method. From the perspective of influencing factors of carbon emission, the decomposition methods of influencing factors of carbon emission include the LMDI index decomposition model [9], the Kaya Constant Equation [10] STIRPAT model, and the Kaya Constant Equation model [11] STIRPAT model. Regarding the prediction of the future trend and peak value of carbon emissions, scholars mostly use gray models and other methods, such as Gray modeling [12].
The second is the study of the relationship between the economy and the environment. The environmental Kuznets curve is a classic theoretical assumption for studying the relationship between economic development and the ecological environment. The concept of an environmental Kuznets curve was first proposed by Grossman and Krueger [13]. The concept of an environmental Kuznets curve was first proposed by Grossman and Krueger. For rural areas, Zilberman and Meij believe that the agricultural economy directly causes rural ecological environment problems, and they point out that the relationship between the rural economy and the ecological environment is not linear [14]. They pointed out that the relationship between the rural economy and the ecological environment is not linear [15].
The third is the study of coupling coordination theory. The concept of coupling originates from physics, which refers to the degree of influence of interaction between two or more systems. The degree of coupling coordination between systems calculated through the coupling degree can clearly reflect the degree of coordination between systems interacting and influencing each other and can judge whether the systems are developing harmoniously with each other. Because coupling theory not only has the ability to comprehensively evaluate the system, but also has the intuition and is easy to explain, K.E. Weick introduced the coupling theory in the study of social economics, and once universally applied, many scholars began to explore the relationship between the economy and the environment with the help of the coupling model. For example, Jin S.T., Mei Z.H., Duan K.F., and other scholars [16] study the coupling and coordination relationship between the agricultural environment and the economy in China in the context of the new economy and analyze the influencing factors of the Chinese agricultural economy with the help of the spatial Durbin model. Hou C., Chen H., and Long R. study the coupling relationship between the economy, health, and the environment in China based on the perspective of green production [17]. Hou C., Chen H., and Long R. study the coupling relationship among the economy, health, and environment in China based on green production.
To summarize, the academic research on the relationship between agricultural carbon emissions, economy, and environment and the coupling coordination theory are quite abundant, but there are still fewer studies on the relationship between agricultural carbon emissions, ecological environment, and agricultural economy, especially since no scholars have been involved in the study of the coupling coordination degree of agricultural carbon emissions, ecological environment, and agricultural economy in Southwest China. In view of this, this paper takes the southwestern region as the research area from 2012 to 2021 and explores the comprehensive development level of agricultural carbon emission, ecological environment, and agricultural economy, the spatial and temporal evolution of the coupling degree of coordination, as well as the factors affecting the development of the system, with a view to providing theoretical reference for the coordinated development of China's agricultural carbon emission, ecological environment, and agricultural economy in the new period, and thus promoting the development of China's green, low-carbon, and recycling agriculture. The development of green, low-carbon, and recycling agriculture in China.
Methods and Data Sources
Variable Selection
This study targets five provinces in Southwest China, employing a meticulously designed indicator system that meets the criteria of rationality, scientificity, and representativeness. The indicators selected effectively gauge the subsystems of agricultural carbon emissions, ecological environment, and agricultural economy. These indicators measure the agricultural economic development level, ecological environment quality, and the dynamics of agricultural carbon emissions alongside the pressures of transitioning to a low-carbon industry. The specific indicators selected for the comprehensive evaluation of the coupling and coordination among these systems are detailed in Table 1, taking into account the availability of data.
The agricultural carbon emission system includes two indicators: the total amount of agricultural carbon emission and the intensity. The total amount of agricultural carbon emission is measured from four aspects, which are the use of agricultural materials, land, paddy fields, and animal husbandry, and the intensity of carbon emission is measured as the carbon emission per unit of economic output value. Regarding the construction of the ecological environment system, this paper utilizes the PSR model to design, respectively, from the three aspects of ecological resources - ecological pressure - ecological governance, with reference to Liu, Legacy [18], Cao J.L. [19], and Liu H.L. [20]. The ecological resources are divided into indicators such as forest coverage rate, greening coverage rate of built-up area, green space per capita, etc. The ecological pressures include sulfur dioxide emissions, nitrogen oxide emissions, and urban population density, and the ecological governance includes the rate of harmless treatment of domestic garbage, the capacity of sewage treatment, and the capacity of industrial waste gas treatment. The agricultural economic system includes the total output of agriculture, forestry, animal husbandry, and fishery, the proportion of primary industry in GDP, the disposable income per capita in rural areas, and the added value of agriculture, forestry, animal husbandry, and fishery. The comprehensive evaluation system of the coupling and harmonization level of the three systems of "agricultural carbon emission, ecological environment, and agricultural economy" consists of three sub-systems with a total of 15 indicators.
Model Selection
Measuring Carbon Emissions from Agriculture
This paper combines the methodology in the recommended guidelines of IPCC (2006) and the relevant studies of previous researchers to measure China's agricultural carbon emissions from four aspects [21, 22] and combines with the agricultural production in the study area to measure China's agricultural carbon emissions from four aspects: First, inputs of agricultural materials, specifically related to fertilizers, pesticides, agricultural films, agricultural machinery, diesel, and other carbon sources [23]. Second, land carbon emissions are mainly generated by plowing, so the indicator is selected as the total sown area of crops [24]. Third, in paddy fields, rice cultivation will cause methane emissions from paddy fields due to the differences in water and heat conditions in different regions of China. The rice transplanting time and growth cycle of rice vary from region to region, and different categories of rice, such as early rice, middle rice, late rice, etc., which correspond to the level of methane emissions from paddy fields, are also different. This paper refers to the study of Min Jisheng and Hu Hao [25]. In this paper, we refer to the study of Min Jisheng and Hu Hao and use the carbon emission coefficient that takes into account both cyclical and regional differences to measure the carbon emissions caused by rice cultivation. Fourth, in animal husbandry, livestock, and poultry rearing processes, because of its intestinal fermentation, fecal excretion will also produce a large amount of CH4 and N2O. Based on the availability of data and in conjunction with the actual situation in China, the main livestock and poultry species, such as cows (including beef cattle and dairy cows), horses, donkeys, mules, pigs, and sheep (including goats and sheep), and their carbon emission coefficients from Tian Yun's study on the measurement of carbon emissions from agriculture and the carbon emission coefficients of the agricultural industry [26]. Accordingly, the agricultural carbon emission measurement formula is constructed as follows:
Table 1.
Evaluation Index system.
In Eq. (1), c is the total amount of agricultural carbon emissions of a farmer; ci is the carbon emissions of carbon source i; ei is the total amount of carbon inputs of carbon source i; ε1 is the carbon emission coefficient of carbon source i. Carbon emission factors for major carbon sources refer to the IPCC. For the convenience of accounting, the estimated greenhouse gases are converted to CO2 uniformly, and according to the IPCC Fifth Assessment Report, 1tC, CH4, and N2O can be converted to 44/12, 28, and 265tCO2, respectively.
Determination of Evaluation Indicator Weights
Indicator weight refers to the important relationship of each indicator under the same objective constraints. For the measurement of indicator weights, refer to Zhang G.P. and other scholars [27]. In the comprehensive evaluation of multiple indicators, weights play a pivotal role, and this study adopts the entropy weight coefficient method [28]. This study adopts the entropy weight coefficient method to assign weights to the evaluation indicators, and the main steps are as follows:
Data standardization: Since there are differences in the scale, order of magnitude, and positive and negative orientation of the indicators, it is necessary to do standardization of the initial data. For the positive and negative indicators, the standardized treatment is as follows:
For positive effect indicators:
For negative effect indicators:
Calculate the weight of the value of the jth indicator in the i-th year:
Calculation of information entropy of indicators:
and when Yij = 0, let
Calculation of information entropy redundancy:
Determination of indicator weights:
In the formula: X'ij and Xij are the standardized and original values of the jth individual indicator in year i, respectively. maxXj and minXj are the maximum and minimum values of the jth single indicator in all years, respectively. m is the number of evaluation years, and n is the number of indicators.
Comprehensive Evaluation Index Model
Determine the weights of the indicators according to the above method, and calculate the weights of each single indicator separately. According to the constructed evaluation index system and method, the weighting function is used to get the development index and its change trend of each subsystem of the coupled agricultural carbon emission-ecological environment-agricultural economy as well as the total system in Southwest China. Its calculation formula is:
In Eq: X'ij is the standardized value of the single index corresponding to each subsystem, and
Coupled Coordination Degree Model
In order to study the relationship between the agricultural carbon emission-ecological environment-agricultural economic systems in Southwest China, the coupled coordination degree model is utilized to quantitatively analyze the degree of interaction between the agricultural carbon emission-ecological environment-agricultural economic systems [29]. To quantitatively analyze the degree of interaction between the agricultural carbon emission-ecological environment-agricultural economic system in Southwest China, reflecting the level of coordination and the level of development among the three systems, the formula is as follows:
Where: C is the degree of coupling; T is the comprehensive coordination index; D is the degree of coupling coordination; f (x), g (y), and h (z) represent the agricultural carbon emission, ecological environment, and agricultural economic score, respectively; the larger the value, the more coordinated the system is between systems; on the contrary, the more uncoordinated, α, ꞵ, and γ are the pending weights of each subsystem, reflecting the influence coefficient of the agricultural carbon emission-ecological environment-agricultural economy system, assuming that the three systems are equally important, so that α and ꞵ, γ are equal, so the pending coefficients are assigned as 1/3.
On the basis of other scholars' research [30] and based on other scholars' studies, the classification criteria of the coupling degree and the coupling coordination degree level in this paper are shown in Table 2 [31].
Diagnosis of Disabling Factors
The agricultural carbon emissions-ecological environment-agricultural economy is a complex multi-system, and each factor has different degrees of influence on the system. In order to determine the main factors affecting the agricultural carbon emission-ecological environment-agricultural economy system, with reference to the scholar Kuang L.H. [32]. In order to identify the main factors affecting the agricultural carbon emission-ecological environment-agricultural economy system, the three indicators of factor contribution (F), indicator deviation (D), and obstacle degree (h, H) are used to diagnose and analyze the obstacle factors of the system, in which F is the degree of influence of each single factor on the agricultural carbon emission-ecological environment-agricultural economy system, i.e., the weight of each single indicator on the total goal; D indicates the gap between each single indicator and the development goal of the agricultural carbon emission-ecological environment-agricultural economy system; D indicates the gap between each single indicator and the development goal of the agricultural carbon emission-ecological environment-agricultural economy system. D denotes the gap between each single indicator and the development goal of the agricultural carbon emission-ecological environment-agricultural economic system, i.e., the difference between the standardized value of each single indicator and 100%; h and H denote the magnitude of the degree of influence of each single indicator and each sub-system on the agricultural carbon emission-ecological environment-agricultural economic system, which is the goal and result of the diagnosis of the obstacle factors of the agricultural carbon emission-ecological environment-agricultural economic system, respectively. The formula for each indicator is as follows:
Table 2.
Classification of coupling degree and coupling harmonization degree.
Data Sources
The research data for this study consists of panel data aimed at examining the spatio-temporal evolution of the coupled coordination between agricultural carbon emissions, the ecological environment, and the agricultural economy in Southwest China. This analysis covers the period from 2012 to 2021 and includes data from five provinces within the region. The variables encompass measurements related to agricultural carbon emission sources, ecological environment indicators, and metrics that reflect the development of the agricultural economy.
The primary sources for these data are the China Statistical Yearbook, local Statistical Yearbooks, the National Economic and Social Development Statistical Bulletin, and official websites of the provincial governments, provincial statistical bureaus, and the Department of Ecology and Environment. To address instances of missing data, the study employs mean and linear interpolation techniques to ensure the completeness and continuity of the dataset.
Table 3.
Measurement results of agricultural carbon emissions in Southwest provinces.
Results
Agricultural Carbon Emissions Measurement Results
Table 3 presents the total agricultural carbon emissions and their intensity across Southwest China from 2012 to 2021. In 2021, total emissions amounted to 14,847,060 tons, marking a 10% decrease from 16,496,400 tons in 2012. The emission intensity also saw a significant reduction, dropping from 2384.694 in 2012 to 831.464 in 2021, indicating an almost twofold decrease.
Throughout this period, agricultural carbon emissions and their intensity exhibited a general downward trend, though with variations across different phases. From 2012 to 2016, during China's 12th Five-Year Plan, emissions initially rose as the plan emphasized agricultural modernization and began to integrate ecological management and green agriculture initiatives. Post-2016, emissions fell notably by 15% up to 2021, influenced largely by the "Zero Growth in Fertilizer Use by 2020" and "Zero Growth in Pesticide Use by 2020" policies implemented in 2015.
Spatially, Sichuan and Yunnan reported the highest total emissions over the decade, attributed to substantial inputs of agricultural films, fertilizers, pesticides, and diesel. Sichuan, being a major agricultural hub, naturally had higher emissions due to its extensive farming inputs. Conversely, Tibet recorded the lowest emissions, constrained by its challenging geographical and agricultural conditions, which limited the use of extensive agricultural machinery.
Despite the considerable intensity of emissions attributed to traditional farming practices in Southwest China, a decline was observed over the study period. This shift suggests a growing adoption of green and low-carbon practices, signaling an improvement in the ecological development of agriculture in the region. The ongoing national strategies and enhancements in energy and resource efficiency are expected to drive further reductions in both the emissions total and its intensity in the coming years.
Evolution of the Level of Integrated Development in Time and Space
The comprehensive evaluation index model revealed the dynamics of agricultural carbon emissions, ecological environment, and agricultural economic subsystems in Southwest China from 2012 to 2021. Fig. 1 shows a general decline followed by a rise in the comprehensive development index of agricultural carbon emissions, with minimal fluctuations in Chongqing and more significant ones in Sichuan and Guizhou, experiencing a five-fold and six-fold increase, respectively. In 2016, these indices began to rise, signaling an overall improving trend despite some fluctuations.
Ecological environment indices have consistently shown an upward trend, bolstered by the strategic initiatives from the 18th National Congress, which led to significant reforms in ecological civilization. This includes setting "ecological red lines," restoring ecosystems, and increasing pollution control efforts, which have collectively transformed the ecological environment in Southwest China, particularly after 2013. The region's commitment to deepening ecological protection, enhancing governance capabilities, and prioritizing green development has been evident.
Economically, the Southwest region has faced challenges in primary industry development due to its mountainous terrain, thus increasingly focusing on the tertiary sector. Recent trends indicate that the tertiary industry's contribution to regional GDP is growing, accounting for half of it in recent years. The transition to a tertiary-dominated industry structure was completed by 2013 in the Tibet Autonomous Region, Yunnan, Guizhou, and Chongqing, with Sichuan following in 2016. This shift has resulted in a "three, two, one" industrial pattern, where the tertiary sector leads, followed by the secondary and primary sectors [33]. Consequently, while the agricultural economy's comprehensive development index remains low, the focus has shifted towards enhancing the tertiary sector's role in economic growth.
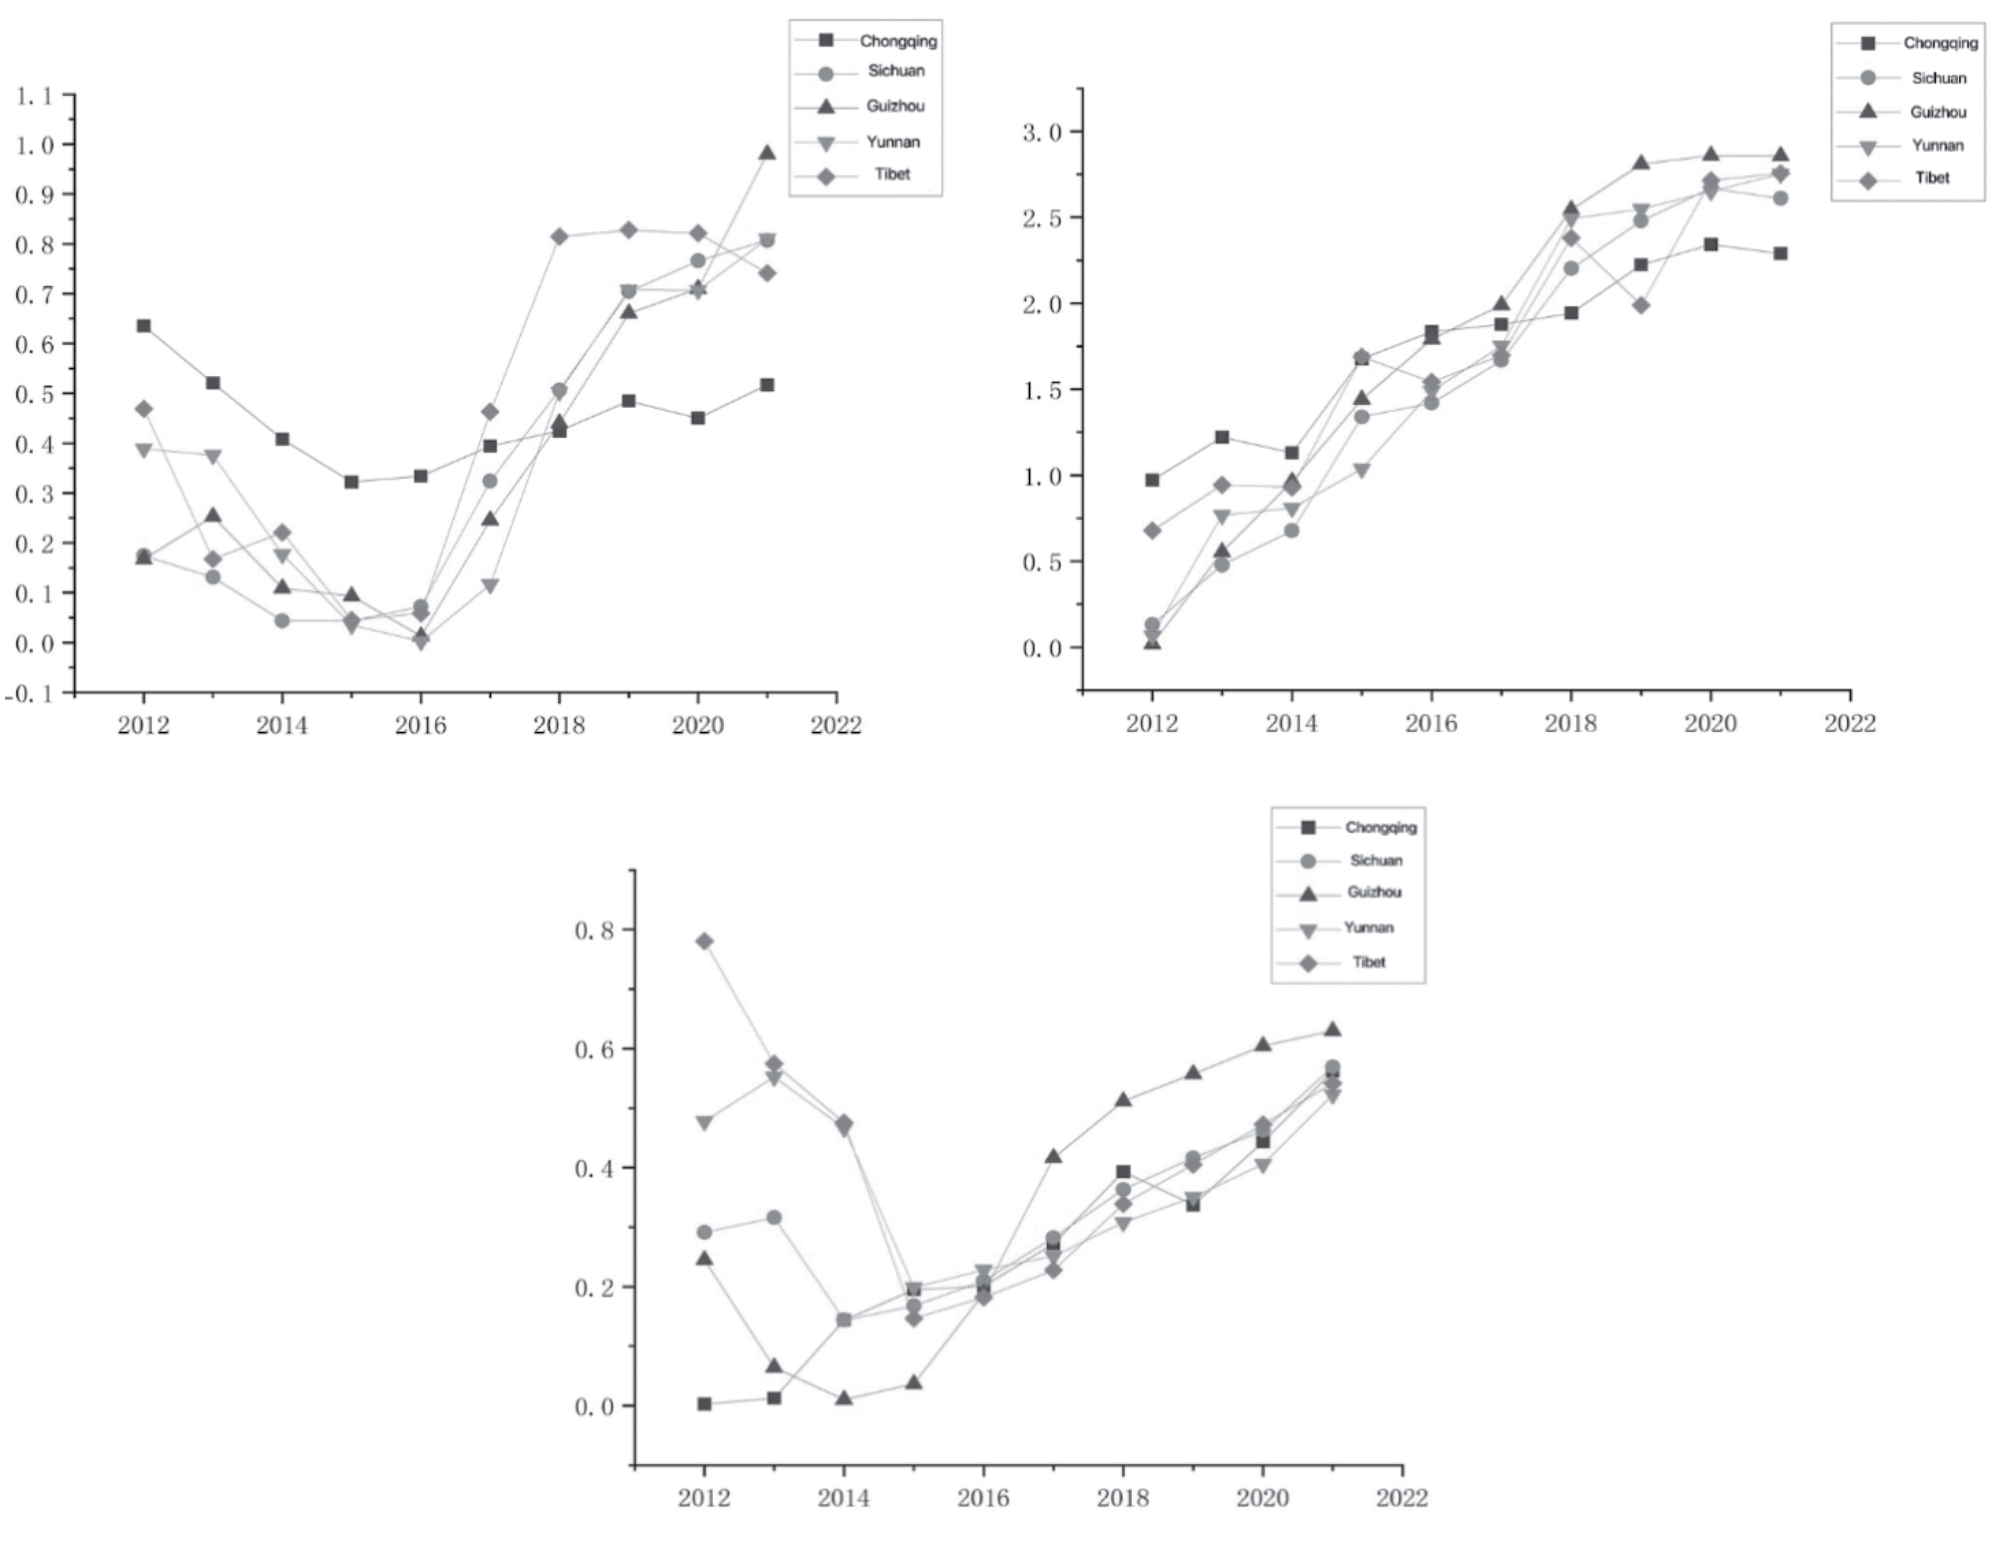
Analysis of the Coupling Degree of Agricultural Carbon Emissions-Ecological Environment-Agricultural Economy and the Time-Series Evolution of the Coupling Degree of Coordination in the Southwest Region
The coupling degree C and coupling coordination degree D can be calculated according to equations (9) and (11), and the changes in agricultural carbon emission-ecological environment-agricultural economy coupling degree and coupling coordination degree in Southwest China from 2012 to 2021 are shown in Table 4. The coupling degree and coupling coordination degree in the southwest region generally show an evolutionary trend in the same direction. There are fluctuations during the period, and after 2016, it began to grow steadily and achieve orderly development overall, and the coupling coordination degree increased from 0.5465 to 0.9797, and the period can be divided into three stages:
The first stage, 2012-2013, is a period of initial improvement. During this period, both the coupling degree and the coupling coordination degree increased, and the coupling coordination degree changed from barely coordinated development to intermediate coordinated development.
The second stage, 2014-2016, is the dysfunctional recession period. Starting from 2013, the degree of agricultural carbon emissions-ecological environment-agricultural economy coupling and coupling coordination in the southwest region is in a declining stage and lasts until 2016. At this time, the system is on the verge of dysfunctional recession due to the advancement of agricultural modernization and the increase in agricultural material inputs leading to the rapid growth of agricultural carbon emissions, making the system in this stage at a low level of coupling in this period of time between the three systems. The influence relationship between the three systems in this period is relatively weak.
Table 4.
System coupling degree and coupling coordination degree measurement results.
The third stage, 2017-2021, is a period of stabilization and coordination. After 2016, Chongqing Municipality, Sichuan Province, Guizhou Province, and Yunnan Province have all achieved industrial restructuring and made significant progress in the construction of ecological civilization, and the Central Environmental Protection Inspectorate has carried out strict environmental protection work after 2016. The government has increased the proportion of investment in ecological environmental protection and pollution control in Southwest China, and the link between the agricultural carbon emission-ecological environment-agricultural economic system has been tightened in this period. The link between the agricultural carbon emissions-ecological environment-agricultural economic system was tightened during this period and grew steadily, beginning to exert system synergies and reaching a level of high-quality coordinated development in 2019.
Diagnosis and Analysis of the Main Obstacles of the System
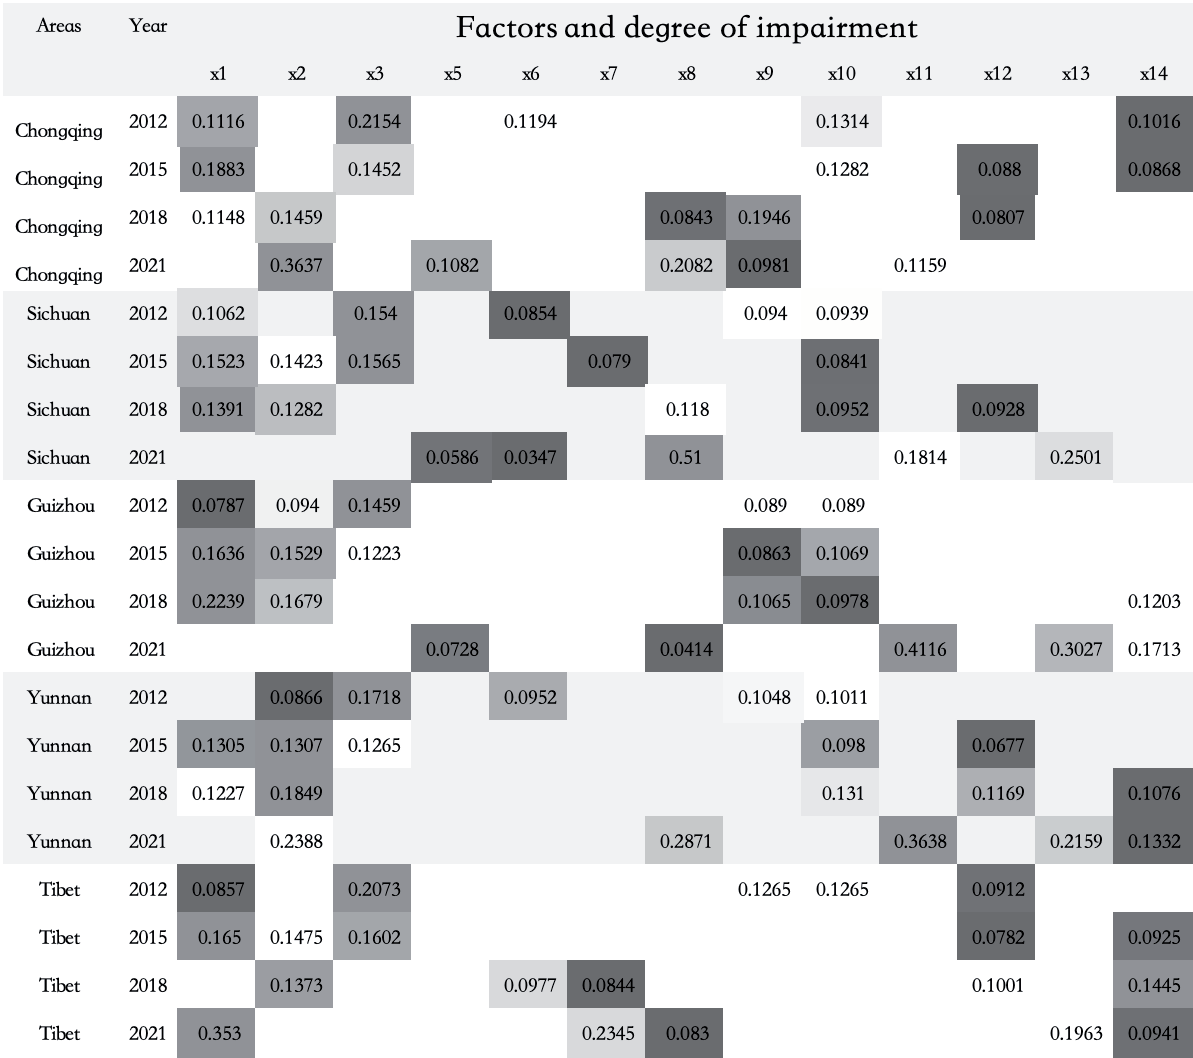
Taking the indicators in the agricultural carbon emission-ecological environment-agricultural economic system in Table 1 as the object of analysis, the obstacle degree model was applied for diagnosis [Equation (12)- (13)] to analyze the factors that hinder the coordinated development of the composite system of the agricultural carbon emission-ecological environment-agricultural economic system in Southwest China. Due to space limitations, Fig. 2 lists the top five obstacle factors in each province for 2012-2015-2018-2021.
Since the green coverage area of the built-up area was not a major barrier factor during the study period, it was excluded. The remaining 13 barrier factors are agricultural carbon emissions, agricultural carbon intensity, forest coverage, green space per capita, sulfur dioxide emissions, carbon oxide emissions, urban population density, domestic garbage harmless treatment rate, sewage treatment capacity, industrial exhaust gas treatment capacity, the gross output value of agriculture, forestry, animal husbandry, and fishery, the proportion of the primary industry in GDP, disposable income per capita in rural areas, and value-added of agriculture, forestry, animal husbandry, and fishery.
Fig. 2 identifies urban population density, harmless waste treatment rates, sewage treatment capacity, gross output value of agriculture, forestry, animal husbandry, fishery, and rural per capita disposable income as main barriers to the integrated development of agricultural carbon emissions, ecological environment, and agricultural economy in Southwest China. High urban population density may decrease available agricultural land, potentially reducing carbon emissions; however, it could also increase emissions through intensified agricultural practices while exerting pressure on natural resources and impacting the ecological environment. Effective waste treatment reduces emissions from incineration and landfills, benefiting ecological conservation and enhancing rural life quality, which supports rural economic growth. Enhanced sewage treatment capacity reduces water pollution, aiding both agricultural carbon management and ecological health, and improves living conditions in rural areas, thereby supporting the rural economy. Increases in the output value of agriculture, forestry, animal husbandry, and fishery generally lead to higher carbon emissions and potential negative impacts on ecosystems, such as land degradation and biodiversity loss. However, sustainable practices can mitigate these impacts and contribute positively to the ecosystem while boosting rural economic growth through job creation and income opportunities. Higher rural incomes may lead to increased consumption of energy-intensive goods, raising carbon emissions, but also enhancing environmental stewardship among rural residents. This growth reflects advances in the rural economy and improves living standards. Among these factors, rural per capita disposable income presents the most significant obstacle, while the gross output value of agriculture and related sectors also plays a crucial role. Nonetheless, with advancements in agricultural modernization and the rapid development of the rural economy, their obstructive impact is diminishing. Overall, the influences of these factors on the integrated system are interrelated and complex, with both direct and indirect effects that can be either positive or negative, depending on the application of technology, policy formulation and implementation, and local socio-economic characteristics.
Conclusion
Based on the data from five provinces in Southwest China from 2012 to 2021, this paper constructs the evaluation index system of "agricultural carbon emission, ecological environment, and rural economy" and applies the entropy value method, the coupling and coordination model, and the obstacle degree model to measure the agricultural carbon emission in Southwest China from 2012 to 2021 on the basis of the measurement of agricultural carbon emission, ecological environment, and agricultural economy and analyze their spatial and temporal evolution characteristics and obstacles affecting their development, and obtain the following conclusions:
(1) The degree of agricultural carbon emission-ecological environment-rural economy coupling and the degree of coupling coordination in Southwest China generally show the same direction of change, with a steady increase from 2016. The stage development is manifested in three periods; the first is the initial improvement period; the coupling degree and coupling coordination degree both increased in 2012-2013; and the coupling coordination degree changed from barely coordinated development to intermediate coordinated development. The second period is the dysfunctional decline period; the 2014-2016 coupling degree and coupling coordination degree declined, and the system is close to dysfunctional decline. The third period is the period of stable coordination, with Chongqing, Sichuan, Guizhou, and Yunnan realizing industrial restructuring from 2017-2021.
Significant progress has been made in building an ecological civilization and strengthening ecological environmental protection and pollution control. The inter-system linkage is strong and growing steadily, reaching a degree of high-quality coordinated development. Overall, the significant increase in the degree of coupling coordination, from 0.5465 to 0.9797, indicates that the Southwest region has achieved orderly and coordinated development over the period.
(2) The main obstacles affecting the agricultural carbon emission-ecological environment-rural economic system in Southwest China include urban population density, harmless treatment of domestic garbage, sewage treatment capacity, gross output value of agriculture, forestry, animal husbandry, and fishery, and per capita disposable income in rural areas. It can be seen that the development of the agricultural carbon emission-ecological environment-agricultural economic system in Southwest China is still highly dependent on the environment, and the adjustment of industrial structure has not yet been fully played. How to further reduce ecological pressure, improve resource utilization efficiency, and strengthen ecological governance is an urgent problem to be solved in the development of Southwest China. To improve the coordination of the composite system of agricultural carbon emission-ecological environment-agricultural economy in Southwest China, measures should be taken to promote rural economic growth, reduce ecological pressure, enhance ecological governance, and strengthen ecological restoration. The impacts of these factors on the composite system are interrelated and complex, including both direct and indirect impacts, and these impacts can be either positive or negative, depending on a variety of factors, such as the application of technology, the formulation and implementation of policies, and local socio-economic characteristics.
Based on our findings, this paper suggests that addressing the interplay between agricultural carbon emissions, the ecological environment, and the agricultural economy in Southwest China requires a clear understanding and active resolution of the core challenges affecting their coordination. To promote the synergistic progress of these elements, it is essential to develop differentiated policies that reflect the unique conditions and developmental stages of each province and municipality within the region. Recommendations include encouraging the adoption of low-carbon agricultural technologies, such as precision agriculture and organic farming, to reduce dependency on chemical inputs. Simultaneously, efforts should be intensified to protect and restore vital ecological environments like forests, wetlands, and grasslands to enhance carbon sequestration and biodiversity. Promoting the integration of agriculture with secondary and tertiary industries, such as rural tourism and specialty agricultural product processing, can help diversify farming practices and reduce monoculture reliance. Strengthening environmental regulations with stricter standards and higher penalties for non-compliance is crucial for preserving environmental integrity. Furthermore, employing modern technologies like big data, the Internet of Things, and remote sensing can improve the efficiency of agricultural practices, reduce resource wastage, and enable proactive environmental management. Achieving coordinated development in this tripartite system demands concerted efforts from government, enterprises, social organizations, and the public, supported by scientific and technological innovation while considering the specific geographic, climatic, and socio-economic conditions of the Southwest to tailor policies that are both effective and sustainable.
Discussion
This study demonstrates significant advancements in the coordination of agricultural carbon emissions, ecological environments, and agricultural economies in Southwest China. Nonetheless, the limitations due to data comprehensiveness and accuracy are noteworthy. Challenges in accessing complete data for some indices might have restricted our analysis. Future research should enhance data collection and organization to improve the study's accuracy and comprehensiveness.
Moreover, the evaluation indicator system might not have fully accounted for the impacts of external economic factors and significant policy changes, which could influence the observed trends. Future studies should consider these dynamics more thoroughly and might extend the scope to include broader geographical areas or longer time frames to understand the long-term effects and sustainability of current trends.
By addressing these limitations and suggesting future research directions, this study aims to provide a balanced view and support ongoing efforts toward sustainable agricultural development in the region. The authors declare no conflict of interest.

