

Introduction
Based on the 2023 Annual Report on Poverty and Social Lag published by the National Institute of Statistics and Geography (INEGI, in Spanish), the municipality of Zimapán in the state of Hidalgo, Mexico, finds itself in a situation of vulnerability and marginalization [1]. Approximately 40.5% of the elderly, indigenous, and Afro-Mexican population are currently experiencing moderate to extreme poverty, rendering the municipality a priority attention area due to its degree of marginalization and the presence of high and very high social lag localities. Furthermore, the population grapples with deficiencies in basic social infrastructure and access to nutritious food.
The solution to this challenge is readily available and hinges on the responsible utilization of the natural rocks found in the region. These rocks contain the ideal nutrient levels to serve as natural fertilizers while also retaining soil moisture effectively. This approach not only addresses the need for fertilizers but also has the potential to generate employment and promote food production through sustainable agricultural practices. Furthermore, this strategy encourages the non-contamination of soils with chemical fertilizers, thereby contributing to the preservation of the natural environment.
Despite the aforementioned challenges, it is interesting to note that Mexico has significant deposits of feldspar rocks containing zeolites [2-4]. However, the presence of natural zeolite in Zimapán Hidalgo has not been reported. Regrettably, no research has been conducted to characterize these feldspar rocks or to explore their practical applications. Consequently, it is vital to investigate minerals with economic potential, enhance their added value, and encourage the development of rural socio-economic systems.
Given the evolution of climate change and the consequent rise in temperatures, the use of zeolitic minerals in agriculture has experienced significant growth. This increase is attributed to their unique properties, which contribute to enhancing various aspects such as the efficiency of fertilizers for soil quality [5, 6], soil amendment [7-9], controlled release of herbicides [10, 11], water absorption capacity [12, 13], and tolerance to water stress [14, 15]. All these features contribute to improving soil structure, resulting in increased agricultural productivity and aiding in the conservation of natural resources, thereby generating environmental benefits [16, 17].
Among the more than 40 different types of natural zeolites, clinoptilolite stands out for its adequate cation exchange capacity, allowing it to enhance the efficiency of certain fertilizers [18]. Furthermore, these zeolites can be an indispensable tool for reducing pollutant emissions and purifying heavy metals from plants [19, 20], as a consequence of excessive anthropogenic pressure over the years, as presented by Cataldo et al. [21]. The ion exchange capacity of zeolites with heavy metals such as selenium and antimony has been investigated, as reported first by Muscarella et al. in 2021 and subsequently by Ouyang et al. in 2023. [22, 23]. The decontamination of soil contaminated with cobalt and copper has also been demonstrated using a mixture of zeolite and bentonite with significant results, [24]. Additionally, the ion exchange capacity of clinoptilolite with heavy metals such as Pb2+, Cu2+, Cr3+, and Fe3+ has been investigated [25, 26].
In the realm of nitrogenous fertilizers, urea is a widely utilized option, yet its application comes with notable drawbacks such as high losses and low efficiency. A promising solution to mitigate these issues involves the successful application of natural clinoptilolite, effectively reducing nitrogen losses caused by ammonia volatilization from urea. Research studies underscore a substantial 53% reduction in ammonia volatilization when urea is combined with clinoptilolite [16]. This favorable outcome is attributed to the ability of zeolite to exchange ions with ammonium ions, facilitating the gradual release of nitrogen into the soil. This crucial property has been highlighted in various studies, including those by Eroglu et al. [27] and Nakhli et al. [28].
Moreover, the significance of developing slow and controlled-release fertilizers for potassium and ammonium is emphasized in the work of Eslami et al. [29]. This strategic approach has proven to be an effective alternative, contributing to a reduction in losses and an enhancement in fertilizer efficiency [30].
The versatile applications of zeolite in agriculture have witnessed a considerable expansion, encompassing its use in the cultivation of diverse crops such as lettuce, rice, wheat, corn, and tomatoes. This widespread adoption has been instrumental in promoting higher crop yields, [31-35].
Combining the properties of cation exchange and making a nutrition mixture based on phosphoric rock, natural zeolite, and natural zeolite exchanged with ammonium ions is an alternative to chemical fertilizers. Such is the situation when NH4+ zeolite with P is applied, resulting in a greater P absorption in plants [36-38].
In this study, the characterization of this natural rock nutrient mixture is presented, and its application in the pre-harvest stage of the Solanum lycopersicum cultivation system is compared with the traditional fertigation system based on chemical fertilizers.
Experimental
Location and Preparation of the Rocks for Soil Incorporation
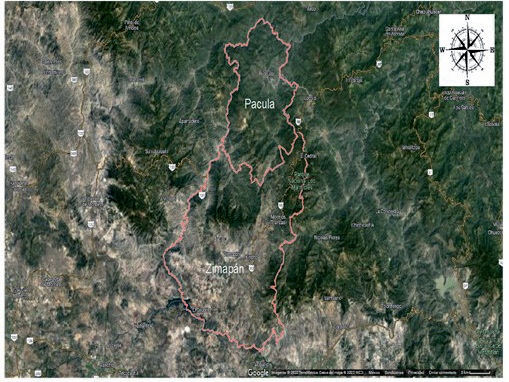
The sample of natural zeolite was granted by the company “Facades Zimapán,” comes from the Bothá community of the Zimapán municipality; the location using the Universal Transverse Mercator (UTM) coordinate system is in zone 14 Q 451836.99 meters East 2283932.25 meters North with an average altitude of 1,780 meters above sea level. The sample was received in rocks of size between 30 and 50 cm with a weight of approximately 200 kg. The company “Minera la Negra” provided the phosphate rock sample in the municipality of Pacula, located at UTM coordinates 14 Q 463808.15 meters E, 2318554.81 meters N to an average altitude of 1,800 meters. This sample was received in size of less than 3 cm and had an approximate mass of 150 kilograms. Fig. 1 indicates that both deposits are located in adjoining municipalities in the state of Hidalgo, Mexico.
To prepare them for soil incorporation, the rock samples were crushed and sieved to achieve an average diameter of 0.9 mm (mesh -16 and +20), because the material is easier to handle than lower particle size, following the methodology outlined by Soca & Daza [39]. Subsequently, they were thoroughly washed three times with distilled water and dried at 110ºC for 24 hours. The appropriate particle size also enhances the surface area, making nutrients more readily available and aiding their incorporation into the soil.
Minerals Characterization
To determine if the rocks studied are useful for the searched purposes, their crystallographic phases were determined (XRD) using a Siemens D5000 X-ray diffractometer using a graphite monochromator and Cu anode. Subsequently, the morphological and chemical characteristics were determined using a JEOL model JSM-IT300 scanning electron microscope (SEM-EDS). The samples were gold-covered in a high vacuum before analysis. On the other hand, minerals were analyzed using FTIR (Perkin Elmer Frontier in 4000-400 cm-1 range) equipment. Finally, the study conducted by XRF in a RIGAKU ZSX Primus II has allowed determining the chemical composition of minerals. The method of preparation was by fusion with 50% Li2B4O7 – 50% LiBO2. Ignition loss was determined by heating 1 g of the sample on a dry basis at 950ºC for 1 hour.
Determination of the Cation Exchange Capacity (CEC)
The technique described by Leyva-Ramos et al. [40] was performed to determine the zeolite CEC. This technique consists of saturating 0.5 g of material with 2M Na+ ions obtained from sodium chloride (Sigma-Aldrich® 99.5% purity) and then saturating with ammonium ions. To interpret the ammonium adsorption equilibrium data, the Langmuir isotherm was chosen until the ammonium absorption in the zeolite stabilized at a maximum value. Therefore, ammonium ions were exchanged at the cationic sites initially occupied by sodium ions.
Zeolite Ion Exchange Process with Ammonium Ions
Several batches were carried out to perform the zeolite cation exchange with ammonium ions. Sixteen nylon mesh bags were introduced, suspended containing 2 kg of zeolite each, in a 15-RPM agitation tank containing 750 liters of ammonium nitrate solution (Sigma-Aldrich® with a purity of 99 %) in a concentration of 0.5 M. The reaction time was 24 hours. Each batch repeated the process until enough zeolite was obtained to prepare the soil for cultivation.
Experiment Location and Soil Preparation
The experimental trial was carried out for a period of 12 weeks, from April 6 to June 22, 2019, utilizing a soil cultivation system within a greenhouse featuring zenithal ventilation. The study was conducted in collaboration with a company boasting 14 years of experience in the cultivation of Solanum lycopersicum. The company is situated in the community of Benito Juarez, within the Municipality of Mineral del Chico, Hidalgo, Mexico. The altitude of the experimental site is 2,432 meters above sea level, and its UTM coordinates are 14 Q 518120.16 m E, 2229317.65 m N.
The mineral mixture (description is shown in section Determination of the proportions of the mineral components added to the soil) was incorporated into the soil and identified as treatment (T). The control treatment identified as (C) was developed under the conventional fertigation system (a system where nutrition is applied together with irrigation, based on the Steiner universal solution) as demonstrated by Steiner [41], which has already been used in several previous cycles of tomato cultivation within the same greenhouse. For both treatments, the soil of each groove was plowed and homogenized with a power tiller. Subsequently, the seedling transplantation was carried out simultaneously in the control group (C) and the treatment (T). Two weeks after the transplantation of plants began the phenological measurements of both treatments.
Fertilizers Used
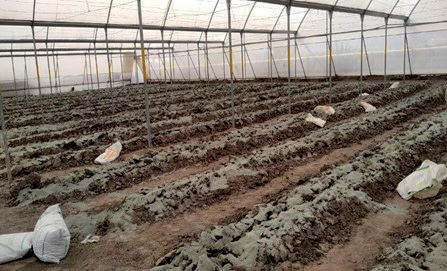
The fertilizers used for control (C) were: calcium nitrate, magnesium nitrate, potassium nitrate, monopotassium phosphate, potassium sulfate, and magnesium sulfate mainly. These nutrients were applied by irrigation to the control system (C) in the appropriate amounts [41]. For the studied system (T), the soil was added with natural zeolite loaded with NH4+, natural zeolite, and phosphoric rock. A detailed description is shown in section Determination of the proportions of the mineral components added to the soil. Fig. 2 shows the soil preparation prior to experimentation.
Table 1.
Amount of nutrients needed for tomato cultivation.
| Nutrient | Kg of nutrients necessary for a ton of tomato production | Kg of nutrients per stem |
|---|---|---|
| N | 2.7 | 0.027 |
| P | 0.5 | 0.005 |
| K | 3.6 | 0.036 |
| Ca | 2.0 | 0.020 |
| Mg | 0.6 | 0.006 |
Table 1 details the quantity of nutrients necessary for production, providing an estimate in kilograms of the required nutrients per ton during a tomato cultivation cycle [42]. In the second column of the table, the amount of nutrients needed for the production of one ton of tomato fruit is specified. According to previous experience at the cultivation site, the average production is approximately 10 kg of fruit per stem. This value has been established as a “desired production” or “expected production.” The calculation for column 3 is carried out as follows, using nitrogen as an example:
The calculation of the other column 3 values were performed in the same manner.
Plant Phenology Measurements
To conduct the phenology studies, a total of 74 plants were utilized, with two grafted stems on each plant. The plants were transplanted and the measurements commenced in the first week. Ten plants were chosen for each treatment (the control treatment (C) and the treatment (T)), and they were distributed along each experimental row. Apical growth and leaf length were measured using a conventional measuring tape.
Apical growth was determined by placing a mark on the guide in week one and comparing the apex with that mark in the following week. On the other hand, leaf length was measured from birth to tip, taking into account the first leaf after the last floral cluster. Stem diameter measurements were taken using a Garant® ABS CALIPER digital caliper.
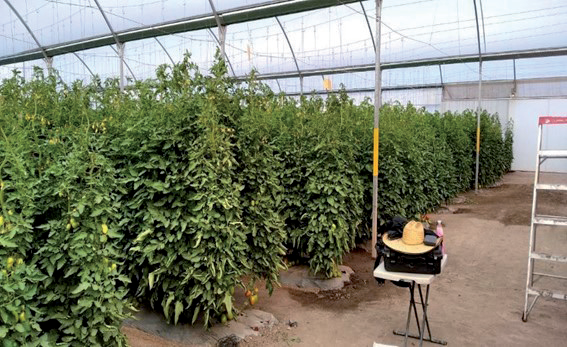
Leaf color measurement was taken directly on the leaves. It is possible to qualitatively estimate plant health based on the current concentration of chlorophyll and nitrogen, which can be indirectly measured by colorimetry. The value is expressed on the RGB color scale G/(R+G+B), as reported earlier [43, 44]. The Lab color space on the leaves was measured according to CIE-1976 (International Commission on Illumination) using a spectrometer (Hunterlab® MiniScan XE Plus model) on the leaves. Fig. 3 shows some specimens of the plants used during the experimentation.
A one-way ANOVA was performed for statistical analysis (P<0.05, α = 0.95), and the Scheffé test was applied to determine the existence of significant differences. Finally, a test was performed comparing G/ (R+G+B) for the zeolite treatment using “Statistical 10” software.
Results and Discussion
In this section, the results of the characterization of phosphate rock, zeolite, and exchanged zeolite, along with the phenological analysis of the plant, are presented. The zeolite used in this study had a cation exchange capacity (CEC) of 1.78 mEq/gr, which is close to the values obtained in previous studies for clinoptilolite-type zeolites [45, 46]. However, the CEC value for this type of zeolite usually ranges between 2.2-2.6 mEq/gr. The measured density of the zeolite was 1.1 g/cm3, which is typical for this type of rock [21].
While the cation exchange capacity of the natural zeolite utilized in this study falls slightly below the typical range for this zeolite type, an ample quantity was incorporated to ensure the essential nutrient supply. Additionally, the fracturing of the zeolite enhances the prevalence of accessible exchange sites for nutrients, thus promoting more efficient nutrient uptake by plant roots. Furthermore, as the roots expand and make contact with the zeolite crystals, these exchange sites become increasingly accessible.
X-Ray Diffraction Analysis
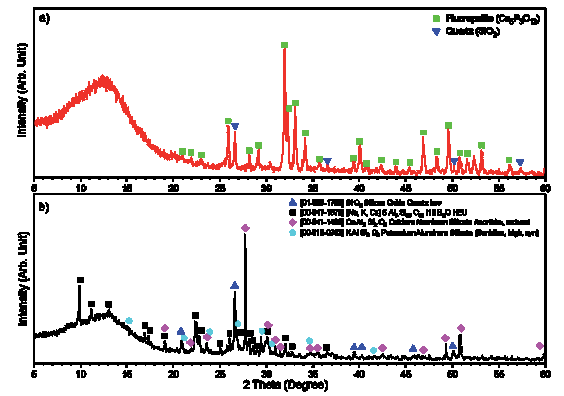
The results of the X-ray diffraction analysis are depicted in Fig. 4. The analysis unveiled the presence of significant mineral-based nutrients in the rocks under examination. In the case of phosphoric rock (Fig. 4a), the fluorapatite phase (Ca5P3FO13) predominates, along with the presence of quartz (SiO2), which is a common mineral in this type of rock, as reported in prior studies [14, 47, 48].
On the other hand, in the natural zeolite sample (Fig. 4b), the predominant type of zeolite identified is clinoptilolite-heulandite (HEU). This sample exhibits the (010) plane at around 10° in 2-theta, which is characteristic of this zeolite type. In addition to zeolite, quartz has been detected in this sample. It is worth noting that other mineral phases, particularly feldspathic minerals such as sanidine, are also commonly present [49-51].
Scanning Electron Microscopy
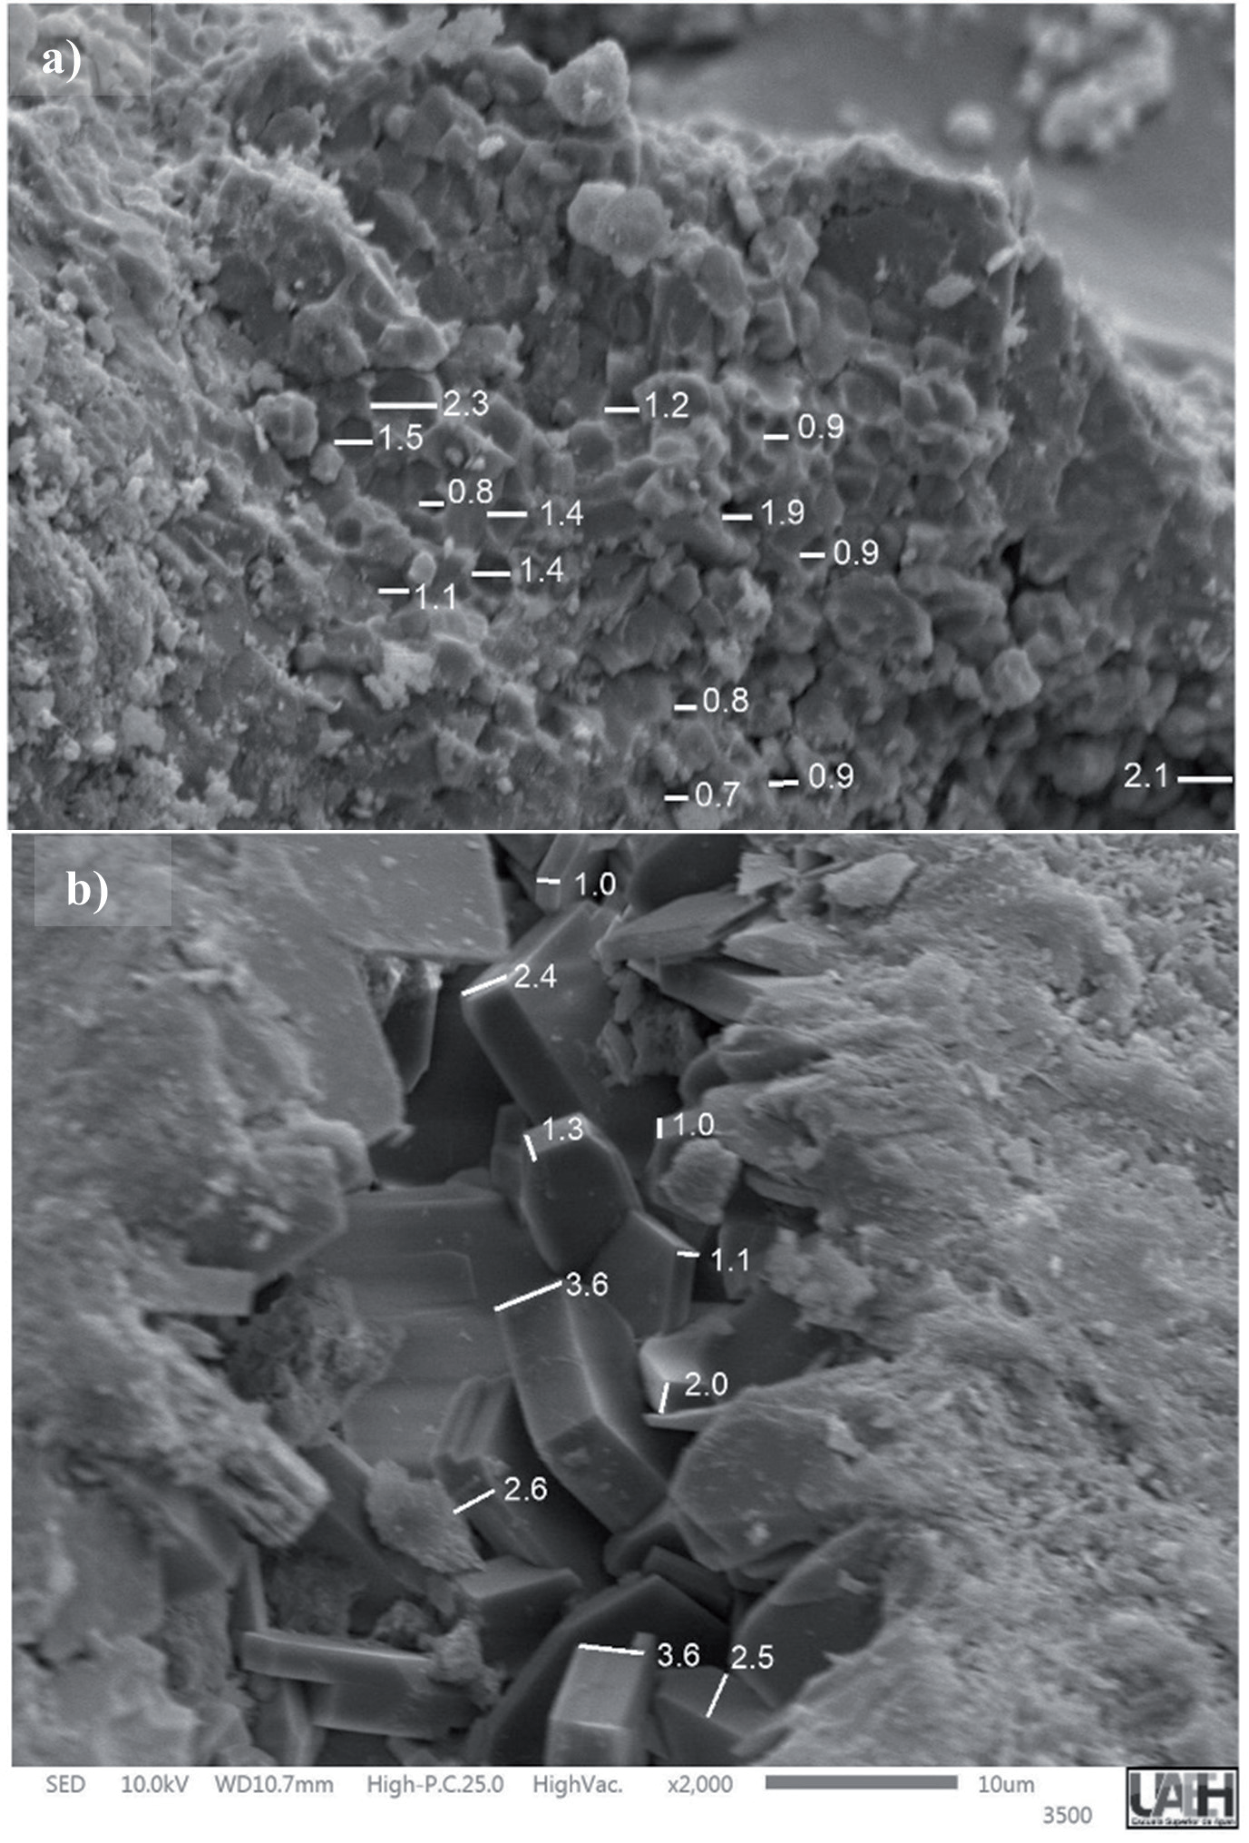
Through scanning electron microscopy (SEM), the fractured surface of the phosphate rock is shown in Fig. 5a). An intergranular fracture is observed, revealing a notable presence of cavities ranging in length between 0.7 and 2.1 micrometers along the edges. The hexagonal shape of these cavities is typical of minerals in the apatite group, which exhibit a stable arrangement of Ca-PO ions [32]. Indeed, an EDS analysis in the central area of the image indicates a chemical composition in weight % with Ca = 40.4%, P = 16.2%, O = 34.7%, C = 5.6%, and F = 3.1%. The presence of carbon can be attributed to its association with calcium carbonates, with calcium being an essential nutrient. The apatite structure can replace the carbonate ion, as suggested by Hughes and Rakovan [52]. These findings are consistent with the crystallographic analyses conducted earlier.
Fig. 5b) displays an SEM image of the interior of a crack in the natural zeolite, revealing euhedral tabular crystals with orthorhombic and monoclinic symmetry, typical of clinoptilolite-heulandite crystals, as demonstrated by Abatal et al. [53]. The natural zeolite sample exchanged with ammonium ions displayed a similar morphology. The approximate crystal thicknesses range from 1 to 3.6 µm. It is noteworthy that a specific EDS analysis was conducted to detect radioactive elements, yielding no evidence of their presence.
Infrared Spectroscopy Study
In Fig. 6 (left), the FTIR spectrum of the phosphoric rock is shown. The analysis reveals the presence of various functional groups, such as OH- bond, water flexion, C-H bond, and the PO43– group (3434 cm-1 and 1625 cm-1) [54]. In addition, the spectrum displays the 3 stretching bands of the C-H bond at 2964, 2925, and 2853 cm-1, attributed to the existence of OH group stretching vibrations (from Al-Al-OH or present water) [55]. The functional group values PO43– are determined by the presence of corresponding bands, such as the symmetric stretching band at 965 cm-1, flexion band at 462 cm-1 and 471 cm-1, stretching band at 1094 cm-1, flexion band at 1047 cm-1, and flexion bands at 603 cm-1 and 577 cm-1 [56, 57]. The analysis strongly indicates the presence of phosphate ions, reinforcing the findings of the crystallographic study and scanning electron microscopy. Additionally, it is evident that phosphoric rock contains a small amount of water and organic matter.
Fig. 5.
a) SEM image of the intentionally fractured surface of the phosphate rock. b) SEM image of euhedral HEU-type crystals contained in the studied pheldespatic rock. White numbers represent units given in µm.
The FTIR spectrum of natural zeolite (Fig. 6 right) exhibited characteristic bands of the stretching vibration of structural water molecules attributed to the zeolite and some other clays present are observed in the range of 3200 to 3700 cm-1, corresponding to OH- stretching vibration and H-O Flexion at 1635 cm-1 [54, 58, 59]. The C-H bond symmetric and asymmetric stretching bands are observed at approximately 2960 cm-1 and 2853 cm-1, attributed to the contamination of samples with organic material. Also, the presence of SiO4 tetrahedra and AlO4 or Si-O-Si and Si-O-Al bonds were also detected. The observed widening of the bands towards higher wavenumbers may potentially be attributed to the presence of other cations, as demonstrated [59]. The allocation of the different absorption bands in 797 to 459 cm-1 are typical of the minerals of the group of both heulandite and clinoptilolite. The intense band around 595 cm-1 is related to an HEU-type zeolite [60].
Chemical Analysis
Table 2 presents the results of the chemical analysis by XRF of the rocks used in this study. The analysis of the phosphoric rock indicates the predominance of calcium oxide and phosphorus oxide, in line with common compositions found in rocks of this type [61]. These findings align with the chemical formula of the fluorapatite mineral [62, 63], the main phase identified in the XRD analysis. These findings underscore the suitability of the phosphoric rock for use as a natural fertilizer.
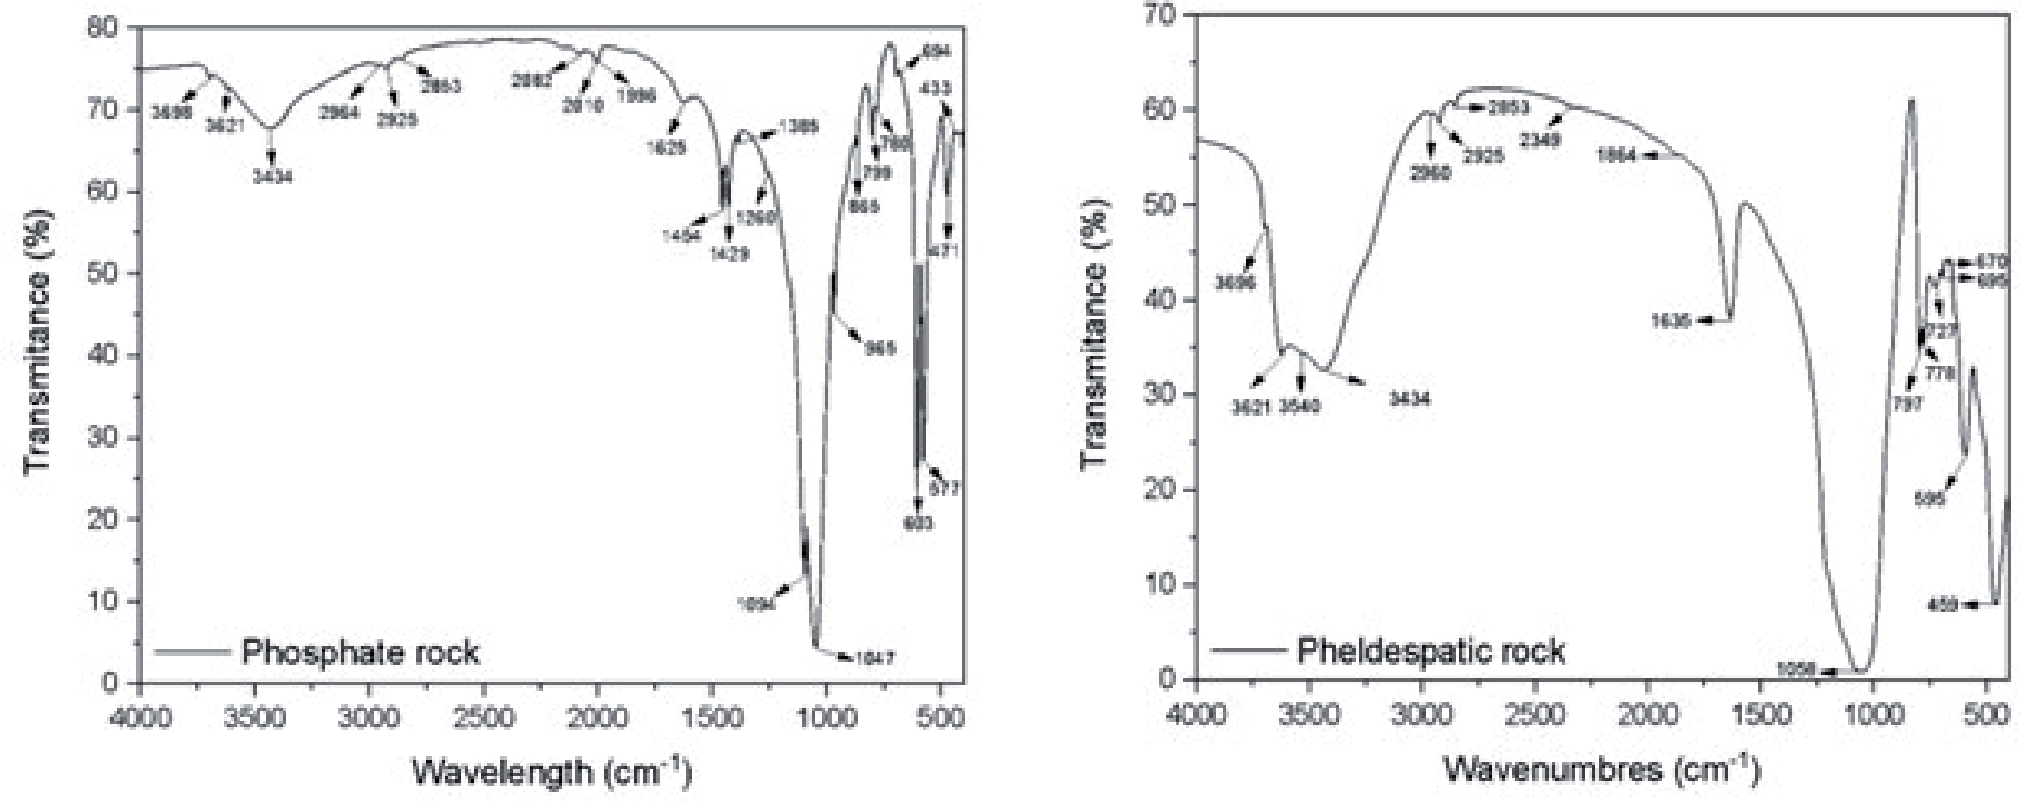
Table 2.
The XRF chemical analysis is expressed in wt% of the rocks used.
The chemical analysis of the natural zeolite used in this study revealed a notable content of silicon oxide (65.755% by weight), a value consistent with the previously known amount of SiO2 in such materials, as additionally confirmed by X-ray diffraction analysis (XRD). Relatively low concentrations of oxides such as potassium, iron, calcium, magnesium, and sodium, typical in zeolitic or phosphoric rocks, were also observed. These elements may reside in the zeolite cavities or form other types of silicates [64]. The levels of these elements, including K, Ca, Fe, Mg, Mn, and S, are conducive to promoting crop growth [65-67]. Of particular note is the substantial presence of K2O and CaO in the zeolite, representing 3.995% and 4.851% by weight, respectively, which are of significant importance as they constitute vital nutrients for plant growth. Additionally, the inherent characteristics of the zeolite, such as the presence of potassium and minimal sodium content, suggest its potential utility in enhancing soil ion exchange capacity.
Determination of the Proportions of the Mineral Components Added to the Soil
Using chemical analyses obtained through XRF and the results of cationic exchange experiments, it is feasible to determine the nutritional contribution of each mineral employed. Table 3 displays the contributions in grams of different elements in the mineral mixture, encompassing natural zeolite, zeolite exchanged with ammonium (NH4+), and phosphoric rock. With this data, the quantities required to add each mineral to the 74 plants were calculated, resulting in approximately 155 kg of natural zeolite, 63 kg of zeolite with NH4+, and 33 kg of phosphoric rock.
Each row spans 21 linear meters and holds around 1500 kg of soil. Upon introducing 250 kg of the mineral mixture, the proportion was calculated as 19.6% by weight of zeolite and 80.4% by weight of soil. It is noteworthy that the amount of phosphoric rock used significantly exceeds the minimum calculated due to its low solubility.
Phenological Studies
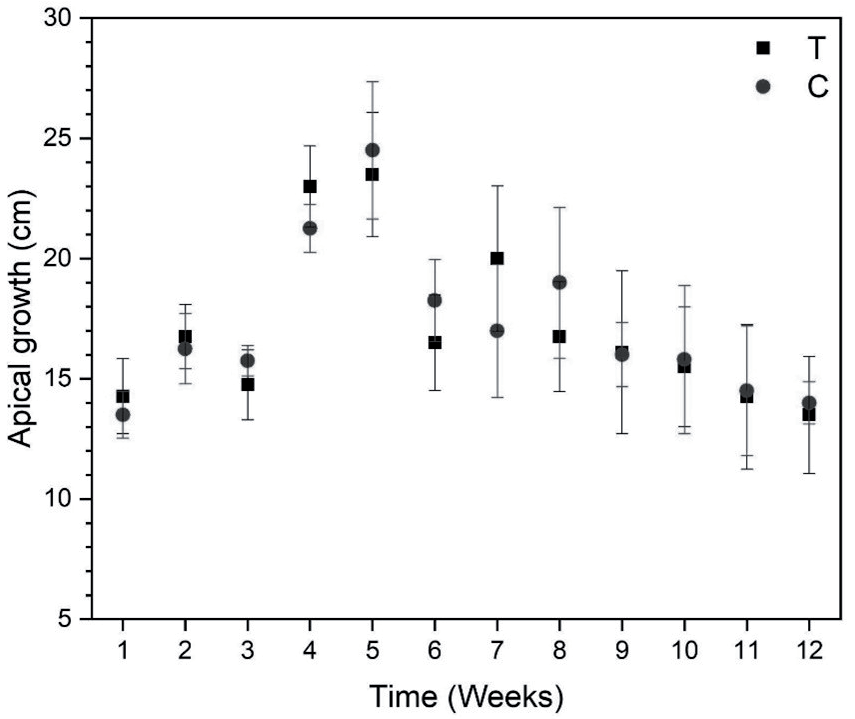
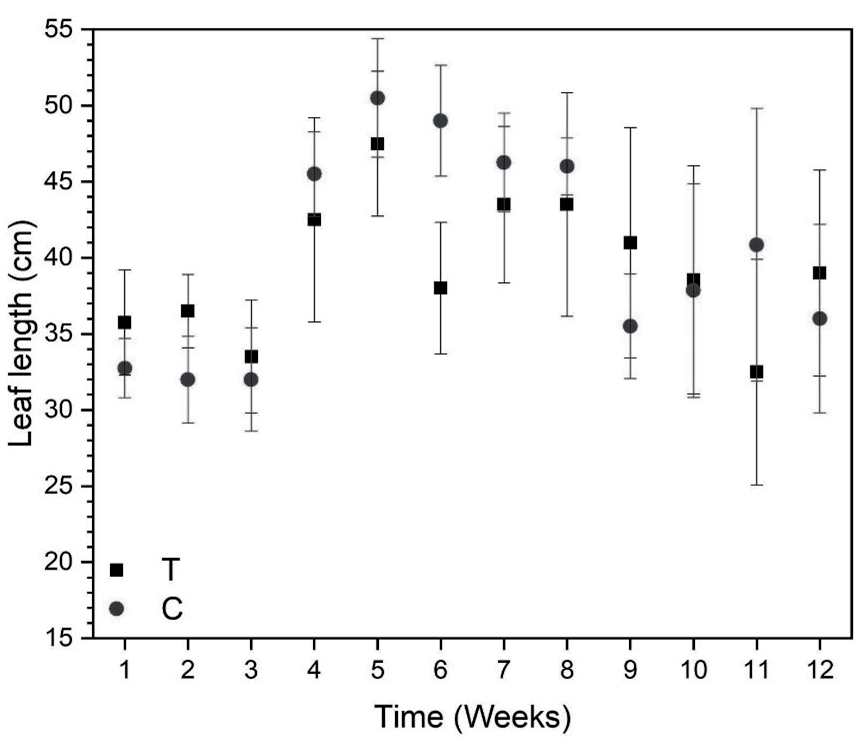
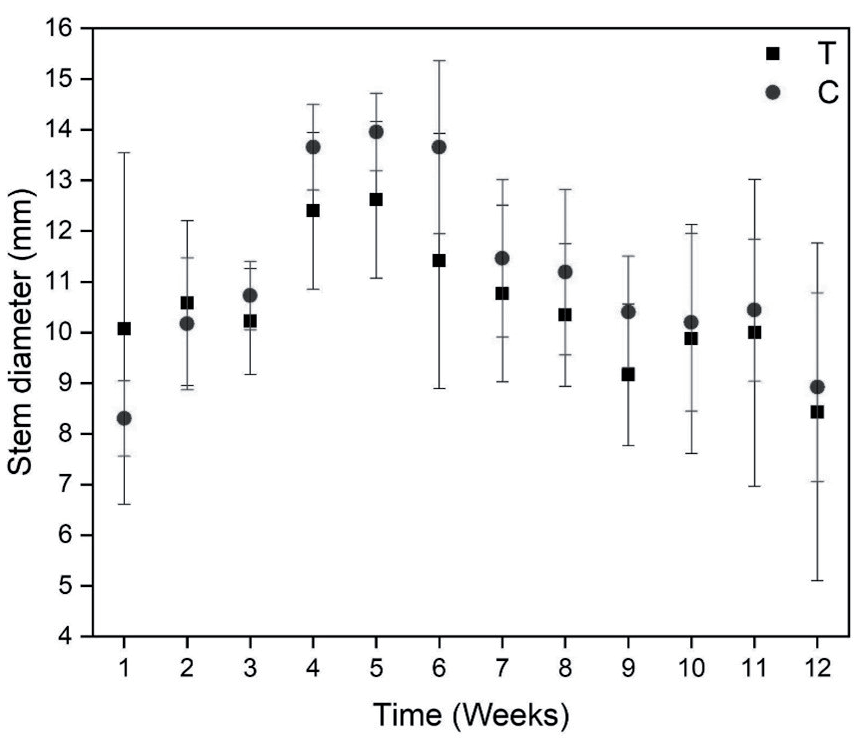
The results of these studies are shown in Fig. 7 to 10, allowing us to compare the growth of tomato plants in two groups: the control group (C), visually represented in red on the graph, and the treatment group (T), indicated in black. The impact of zeolite and phosphoric rock treatment on the phenological behavior, stem diameter, and color of tomato plants was determined. A comprehensive analysis of several parameters was performed, including apical growth, developmental patterns, stem diameter variations, and color measurements represented by G/(R+G+B). These parameters provide valuable information about plant physiology, responses to environmental conditions, and overall health. This review seeks an understanding of the effects of natural rocks on tomato plants, with implications for improving agricultural practices that promote plant growth.
Table 3.
Nutritional contribution of each of the minerals.
The results from Table 4 highlight the effects of different treatments on key phenological variables in tomato plants
Apical Growth and Development Pattern
Fig. 7 shows the weekly apical growth for control (red) and treatment (black). In this case, very similar behavior can be observed for both treatments. The development pattern has similar behavior to that of apical growth and leaf length. It can be seen in Fig. 8 (leaf length) that T has a slightly higher value than C. From the fourth week, it is observed that the control treatment has a slightly higher average growth. Although there is a difference, it is of a minimum magnitude on average of 4 cm. The most significant difference is observed in week 11, which can be derived from environmental conditions. However, during the 12 weeks, it presented a size like that reported by other researchers of 40-60 cm [68], finding measurements outside this range only in the first 3 weeks, as well as in weeks 10 and 12 with lengths between 32 and 39 cm in both C and T. Both in apical growth and leaf development, Ca+ plays a very important role as has been demonstrated in various research, which is why its supply must be guaranteed at all phenolic stages [69].
Stem Diameter Variations
Application of stem diameter variations as a tool to examine plant water relations, plant hydraulics, plant carbon relations, freezing effects, plant phenology, and dendroclimatology [70]. The stem diameter was measured immediately after the first leaf after the first open floral cluster. A slightly larger diameter for T during the first two weeks is displayed in Fig. 9. From week three, it is observed that the behavior is invested, having the treatment control a diameter slightly greater than the T treatment. Despite this, the differences are minimal. In both cases, there is a diameter lower than that reported in other investigations [68]. It may be due to a lack of phosphorus during the transplant [71].
Fig. 8.
Weekly average measurement of leaf length in the last floral cluster of the Solanum lycopersicum plant during the experiment.
Measurement of G/(R+G+B) Color
Fig. 10 displays average colorimetry measurements G/(R+G+B), which are directly correlated with the amount of chlorophyll and nitrogen in plants. Similarly, to the data collected on stem diameter and leaf length, the control treatment exhibits a slightly higher average value in most cases. Although the trend persists from the second week onwards, the difference is minimal, and both treatments present typical values. This color discrepancy is only present in the first week after transplantation. This phenomenon occurs because plant leaves may exhibit a lighter and more yellowish color due to the stress caused by transplantation. As time progresses, and the plants become established in the greenhouse and adapt to the new nutritional and growth conditions, the leaves typically regain their bright and uniform green color.
Foliar Analysis
Table 5 presents the results of foliar analysis for both treatments. A lower concentration of all anions is evident in treatment T, with nitrogen and phosphorus compounds being the most prominent. In contrast, the concentration of cations is higher in T. The reduction of Na and the increase in K in this treatment are noteworthy, resulting from the competition between sodium (Na) and potassium (K) transport. Both ions share the same pathway of ionic absorption from the growth medium to the roots and then to the entire plant. The intensity of this competition is conditioned by the concentration of ions in the growth medium, favoring the absorption of the ion with higher concentration by the root system, as indicated by Amjad et al. [72]. At last, all microelements show a higher concentration in T, with iron (Fe) and manganese (Mn) being particularly prominent.
Fig. 10.
Average colorimetry measurements G/(R+G+B) of both treatments in leaves of the Solanum lycopersicum plant during the experiment.
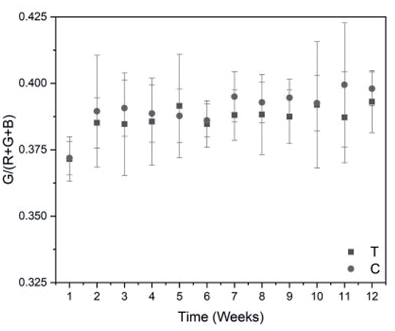
Table 5.
Results obtained in the foliar analysis for both treatments
Conclusions
In this study, phosphoric and natural zeolites from the state of Hidalgo were characterized and evaluated for their potential as natural fertilizers. It was found that the phosphoric rock contains fluorapatite, while the natural zeolite contains heulandite-clinoptilolite crystals. The endemic presence of potassium, low sodium content, and high ion exchange capacity of zeolite proved to be a suitable combination of properties for its use as a slow-release fertilizer in combination with phosphoric rock. These rocks have appropriate properties as an alternative system during the preharvest stage for Solanum lycopersicum plants. Both treatments, T and Control, were found to be suitable for plant nutrition, with no signs of nutrient deficiency observed. The length of the leaves showed a significant reduction in Na and an increase in K in the T treatment. Moreover, all microelements were found to be in higher concentration in the T treatment. The phenological study found statistically significant differences in chlorophyll content and leaf length, showing an inverse relationship. No statistical differences were observed in apical length or stem diameter. It is concluded that the proposed system, based on phosphoric rock, natural zeolite, and ammonium-exchanged zeolite, represents an alternative to the conventional fertigation system due to its slow-release capability and no requirement for continuous chemical fertilization. Furthermore, the use of these rocks as fertilizers represents potential cost savings for farmers and increased production value. Finally, the use of these rocks could promote economic development in the municipality of Zimapán in the Hidalgo state.

