

Introduction
Urban road dust is a significant factor in the movement and spread of pollutants since it is both a source and a container of urban pollutants [1]. Due to their substantial pollution consequences and intricate environmental impacts, heavy metals in urban road dust represent a risk to human health as well as to the urban ecological environment [2, 3]. As a result, one of the major scientific problems in the investigation of urban environmental pollution revolves the quantity, distribution, source, and contamination risk of heavy metal components in urban surface dust.
Numerous studies have been conducted on the geographical distribution, features, and sources of heavy metals in surface dust in various Chinese cities by relevant academics. In Xi’an, Wang Li et al. [4] analysis of the distribution and sources of eight heavy metals in surface dust revealed that industrial operations were the largest contributors to Cu, Ni, and Cr while commercial and car exhaust emissions were the leading producers of As, Pb, and Zn. Based on GIS technology and Geostatistical methods, Gulibanu et al. [5] mentioned the spatial distribution patterns and sources of nine elements in surface dust in Urumqi, Xinjiang, and discovered that the patterns of spatial distribution of the elements varied significantly, with Mn being primarily controlled by natural factors and As, Hg, Cd, Cr, Cu, Ni, Pb, and Zn being primarily influenced by anthropocentric factors. Three of the elements, including Cu, Pb, and Zn, possess comparable geographical distribution patterns, according to Wang Shuo et al. [6] analysis of the spatial distribution features of five elements, including Cr, Cu, Pb, Zn, and Cd, in urban surface dust in China. Utilizing GIS technology, Geng Yanni et al. [7] explored the spatial distribution characteristics of eight elements in urban dust in Baoji and discovered that the areas with high elemental content appeared to have frequent traffic activities, with Zn, Cd, and Cu among them being primarily caused by traffic pollution. The Hg element was the most seriously polluted, and the heavy metals in the study area mainly originated from five pathways, including coal combustion, transportation, atmospheric precipitation, industrial emissions, and natural factors. Bilali et al. [8] analysis of the pollution status and sources of six heavy metals in the soil around the Zhundong coal mine based on the positive matrix decomposition model revealed this.
The possibility of contaminated soil in oil extraction locations has elevated significantly in recent years [9, 10]. The biotoxic heavy metals Cd, Cr, Pb, and Hg are among those that are present in crude oil. During the extraction, processing, and transportation of crude oil, pollutants are generated that endanger the local soil, water, and air quality [11, 12]. In order to investigate the distribution pattern and sources of heavy metal elements in the urban surface dust against the backdrop of the petroleum and chemical industry, this paper makes use of Karamay, a typical oil city in western China, as the study area. It analyzes the content, spatial distribution characteristics, pollution level, and main sources of six heavy metal elements, such as As, Cd, Cr, Cu, Pb, and Hg, in the surface dust.
Overview of the Research Area
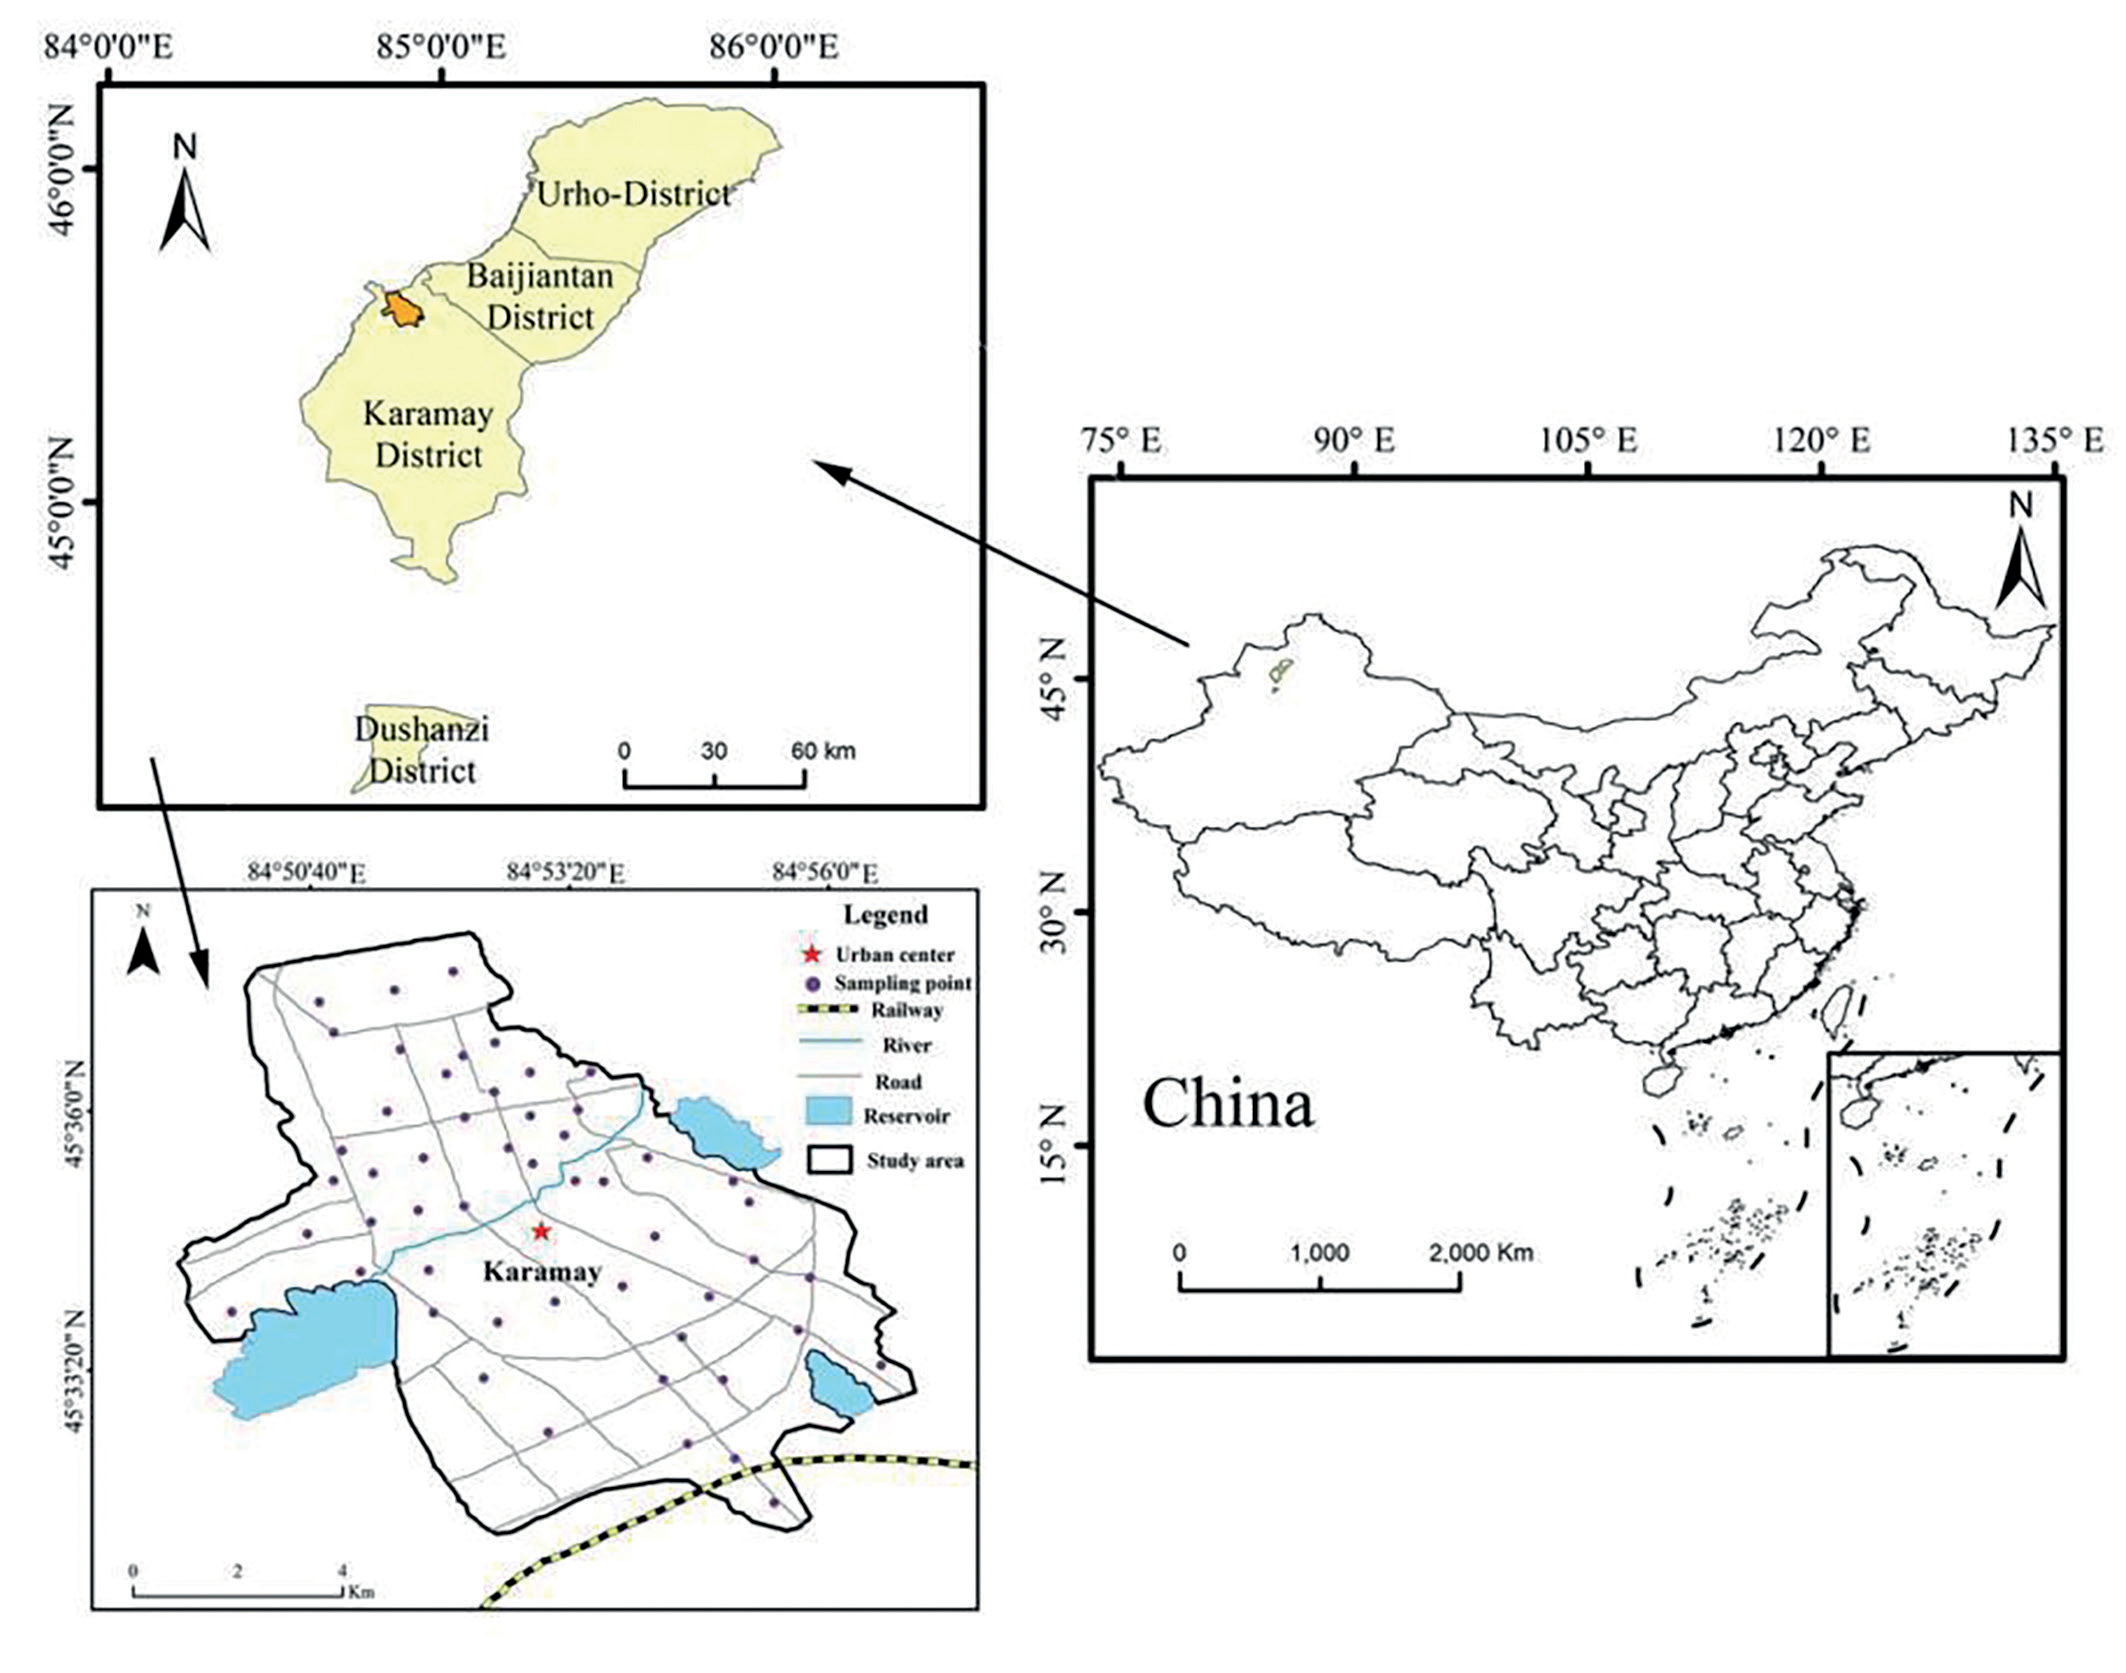
The Junggar Basin’s westernmost region contains Karamay, which experiences a moderate continental desert climate. One of the biggest causes of weather disasters in the area is high wind, which mostly happens in the spring, summer, and fall when the wind speed is less than 5 m/s [13]. With shallow oil and gas reservoirs, substantial reserves, and outstanding crude oil texture, Karamay is a significant petroleum and petrochemical base in China and a newly industrialized city in Xinjiang. Karamay District, one of Karamay’s four municipal districts, boasts a population of 300,723, or 65.04% of the city nationwide. The city’s gross domestic product (GDP) in 2019 was 97.29 billion yuan, and its primary, secondary, and tertiary sectors’ structural ratios were 1.78:68.83:29.39. The major urban area of Karamay District is the subject of this study (Fig. 1), or the sample area, featuring a total size of 53 km2 and is situated between 45°31’ and 45°39’N and 84°49’ and 84°57’E. 53 km2 total, 45°39’N and 84°49’–84°57’E, are located there.
Materials and Methods
Surface Dust Sample Collection and Measurement
In August 2021, 52 surface dust samples were collected from the Karamay District under clear and dry conditions with wind speeds below 5 m/s. The sampling points were distributed on impervious asphalt and concrete surfaces as well as sidewalks in the study area. Depending on the size of the sampling area and the actual situation, within each set surface dust sampling area, 8–10 surface dust sub-samples (each sub-sample weighing about 10 g) were first swept with a brush and a plastic dustpan, and then these sub-samples were fully mixed into about 100 g, picked out the bricks or stones in them, and put into polyethylene self-sealing bags for sealing and preservation. The samples of surface dust were naturally dried, pulverized in an agate mortar employing a 100-mesh nylon filter, and then packed in a self-sealing bag. The Xinjiang Uygur Autonomous Region Institute of Analysis and Testing was charged with the task of determining the presence of As, Cd, Cr, Cu, Pb, and Hg in the dust samples. The samples of surface dust were naturally dried, pulverized in an agate mortar utilizing a 100-mesh nylon filter, and then packed in a self-sealing bag. The Xinjiang Uygur Autonomous Region Institute of Analysis and Testing was charged with the task of determining the presence of As, Cd, Cr, Cu, Pb, and Hg in the dust samples. As and Hg were measured employing an atomic fluorescence photometer (BAF-2000), Cr and Cu were found through an inductively coupled plasma emission spectrometer (ICP-5000), Pb was measured using an ICE- 3500 atomic absorption spectrometer, and Cd was measured via a SOLAAR M6 atomic absorption spectrometer. During the testing method, standard soil reference material (GSS-12) was employed for quality control, and the recoveries of each element were within the permitted range (Table 1).
Evaluation of Heavy Metal Pollution of Surface Dust
The Geo-accumulation index (Igeo) [14], which was derived utilizing the method below, was employed to assess the level of heavy metal contamination of surface dust:
where Ci stands for the measured element i content and Bi for the reference background value. In this study, the Xinjiang soil background value was utilized as the reference value[15], and 1.5 was the correction factor to account for changes in the background value brought on by variations in the types of rocks. Table 2 below contains a list of the Geo-accumulation index’s grading standards.
Correlation Analysis
The correlation coefficient and cluster analysis of the heavy metal concentration in surface dust in the research region were performed employing SPSS 23 software.
Cluster Analysis
The research area’s surface dust was subjected to cluster analysis utilizing the SPSS 23 program.
Positive Definite Matrix Factor Analysis (PMF) Model
For source resolution in this investigation, EPA PMF 5.0 was employed. The PMF modeling equations[16] are provided in Table 3 of the PMF 5.0 User’s Guide:
Table 2.
Igeo pollution classification criteria pollution classification criteria
Table 3.
PMF Model Calculation Formula
Results and Analysis
Characteristics and Spatial Distribution Pattern of Heavy Metal Content in Surface Dust
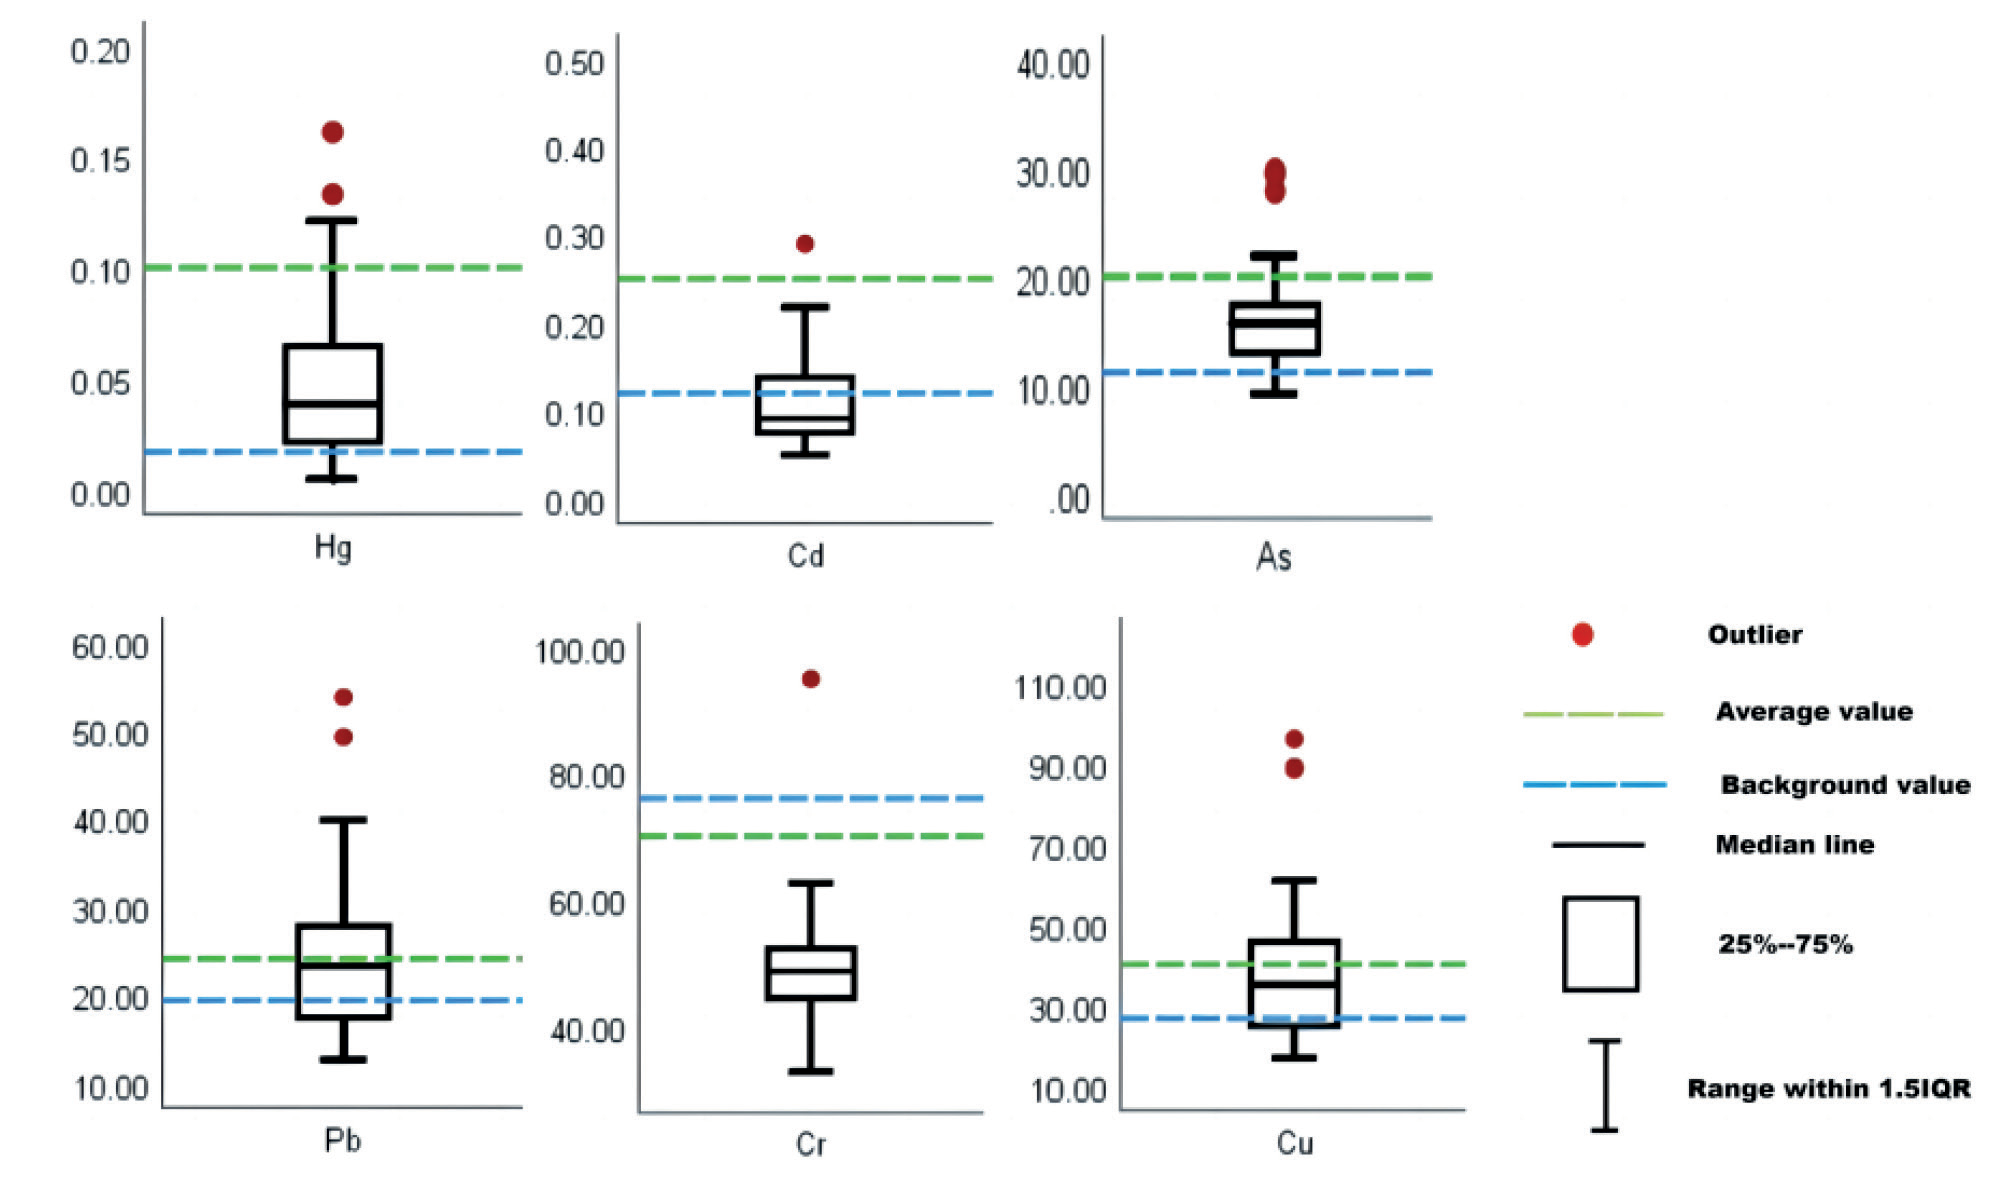
According to the findings of the study of the surface dust in Karamay for the presence of heavy metals (Fig. 2), the average concentrations of As, Cd, Cr, Cu, Pb, and Hg were respectively 18.34 mg·kg-1, 0.22 mg·kg-1, 48.93 mg·kg-1, 40.11 mg·kg-1, 24.12 mg·kg-1 and 0.05 mg·kg-1. Average concentrations of As, Cd, Cu, Pb, and Hg were 1.64, 1.85, 1.50, 1.24, and 2.94 times higher in the study area’s surface dust than the background soil concentrations in Xinjiang, respectively. The greatest value of Cr content was equivalent to 1.93 times the background value of the soil in Xinjiang, although the average value of Cr content was lower than that value. The contents of these four elements may be more obviously impacted by some localized pollution sources, as evidenced by the coefficients of variation (CVs) of As, Cd, Cu, and Hg in surface dust in the study area, which were 0.78, 2.72, 0.68, and 0.75, respectively [17]. The concentrations of these two elements were less influenced by outside factors since the coefficients of variation (CVs) of Cr and Pb in surface dust were 0.20 and 0.35, respectively.
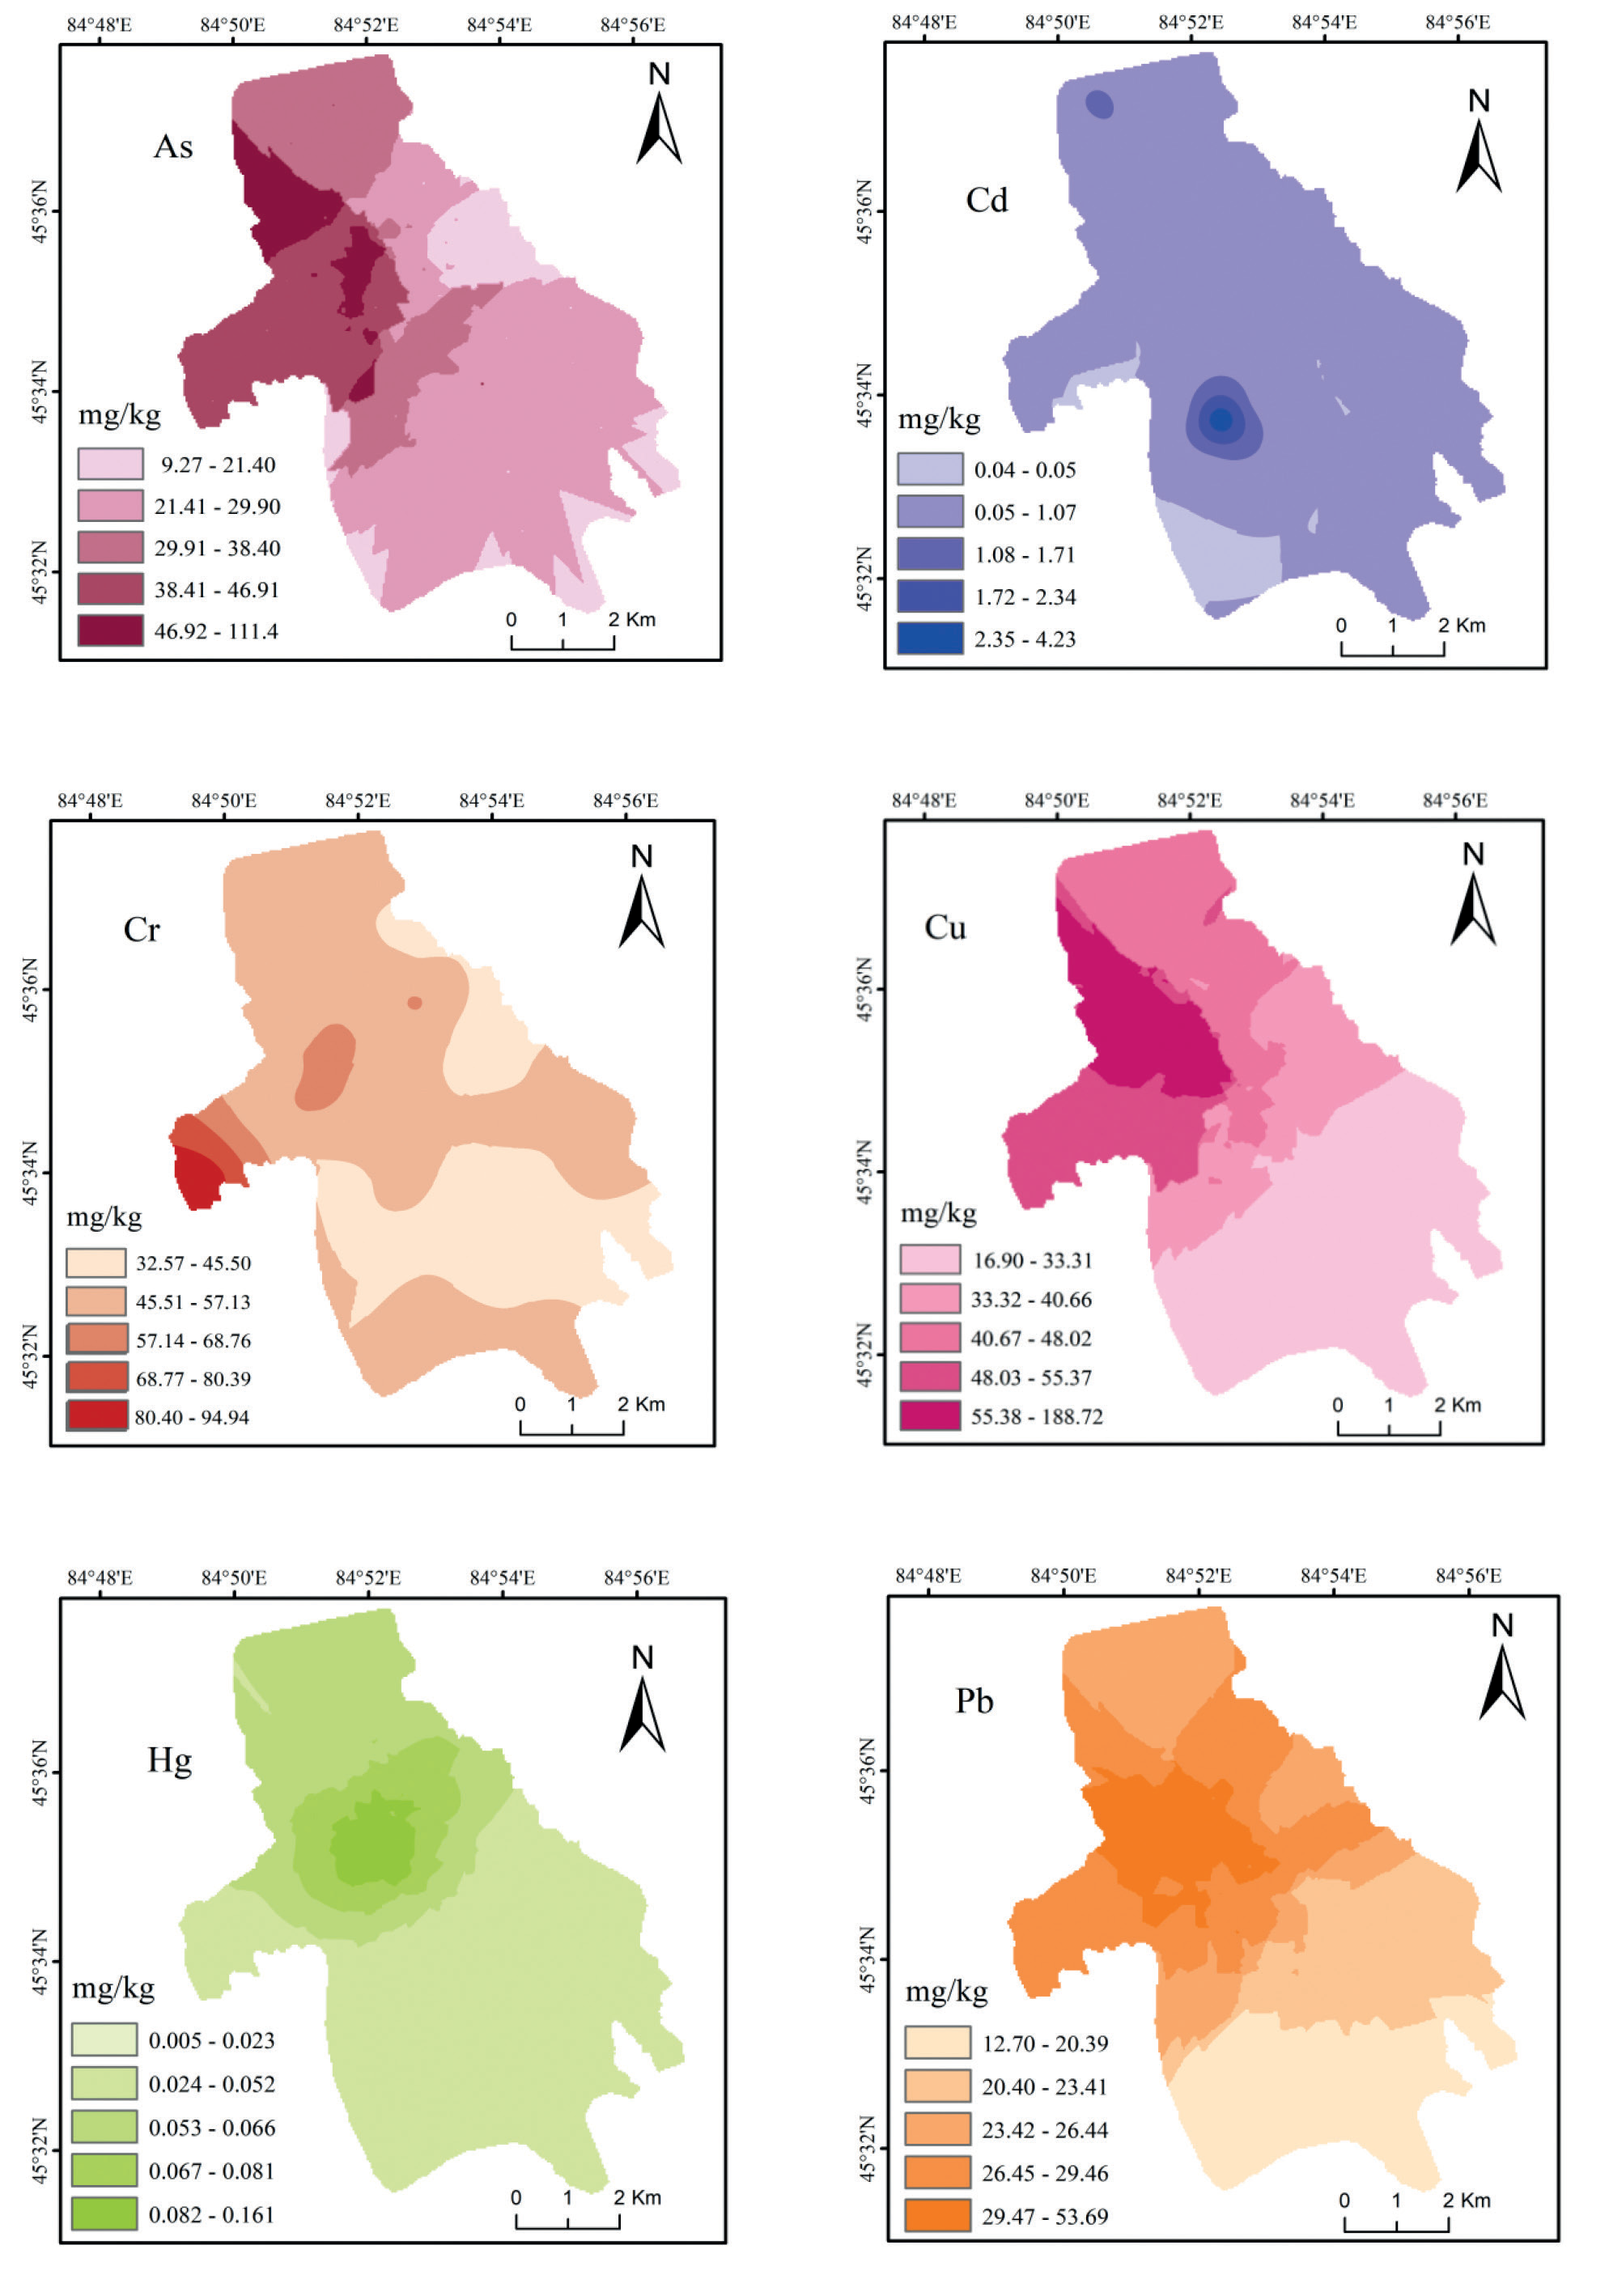
Using the GS+ software to decide on the half-variance function model of each element’s content as well as the nugget gold value, the base state value, and the variation range, etc [18], and the ArcGIS 10.3 software afterwards, the spatial distribution pattern of heavy metals in surface dust in Karamay was created. This pattern is displayed in Fig. 3. In surface dust, As, Pb, Cu, and Hg concentrations revealed a tendency toward progressive decline from the northwest to the southeast of the research region, with a high value area emerging in the northwest, as shown in Fig. 3. Surface dust in the research region has one location with high values for Cd and Cr and many places with high values for As and Cu in the northwest, respectively. The field research found that the northwest region of the study area is a significant industrial sector, home to thermal power plants, businesses engaged in the smelting and processing of metals, as well as printing and paint factories. This could be one of the possible sources of heavy metals in the surface dust in the research area’s northwest. In Karamay, the northwesterly direction of the wind is primarily predominant. The heavy metals transported by the sediments in the northwestern part of the research area under the impact of the northwesterly wind may be one of the causes of the comparatively high concentration of heavy metals in the surface dust in the northwestern portion of the study region. In the northwest of the research region, near the intersection of Provincial Highway S201 and National Highway G30, as well as in the vicinity of the city center and an industrial sector, there was a much higher concentration of heavy metals than elsewhere. It is clear that the northwestern portion of the research area’s industrial pollution and transportation emissions are most likely to blame for the comparatively high concentration of heavy metals in surface dust.
Characteristics and Spatial Distribution Pattern of Heavy Metal Pollution in Surface Dust
According to Table 4’s geological accumulation index (Igeo) results for As, Cd, Cr, Cu, Pb, and Hg in surface dust from Karamay, the six elements’ average Igeo values are Hg, As, Cu, Pb, Cr, and Cd, in that order. The average value of the element Hg is somewhat contaminated in comparison to Igeo pollution categorization standards, but the average levels of five other elements, including As, Cu, Pb, Cr, and Cd, are not polluted. Pb, Cr, Cd, and Cu. As, Cu, Pb, Cr, and Cd average levels are not contaminated, whereas Hg average values are only weakly polluted. According to the ratio of samples with various levels of Igeo pollution to the total number of samples, the number of samples with non-polluted (Igeo ≤ 0) Igeo values of As, Cd, Cr, Cu, Pb, and Hg in the surface dust in the study area accounted for, respectively, 69.23%, 88.46%, 98.07%, 69.23%, 78.85%, and 36.54% of the total number of samples. These six elements’ Igeo values revealed mild contamination (0 < Igeo ≤ 1) in 26.92%, 3.85%, 1.92%, 23.07%, 19.23%, and 26.92% of the total samples, respectively. The Igeo values of the four other elements, As, Cd, Cu, and Hg, revealed moderate contamination (1 < Igeo ≤ 2) in 1.92%, 3.82%, 5.67%, and 21.15% of the total samples, respectively. correspondingly 1.92%, 3.82%, 5.67%, and 21.15%. In addition, moderate to high contamination was found for As in 1.92% of the samples, Cu in 1.92% of the samples, and Hg in 15.38% of the samples (2 < Igeo ≤ 3). It is noteworthy that the number of samples with strong contamination (3 < Igeo ≤ 4) of Cd and Pb elements accounted for 1.92% of the total number of samples, and 1.92% of samples with strong to very strong contamination (4 < Igeo ≤ 5) of Cd elements.
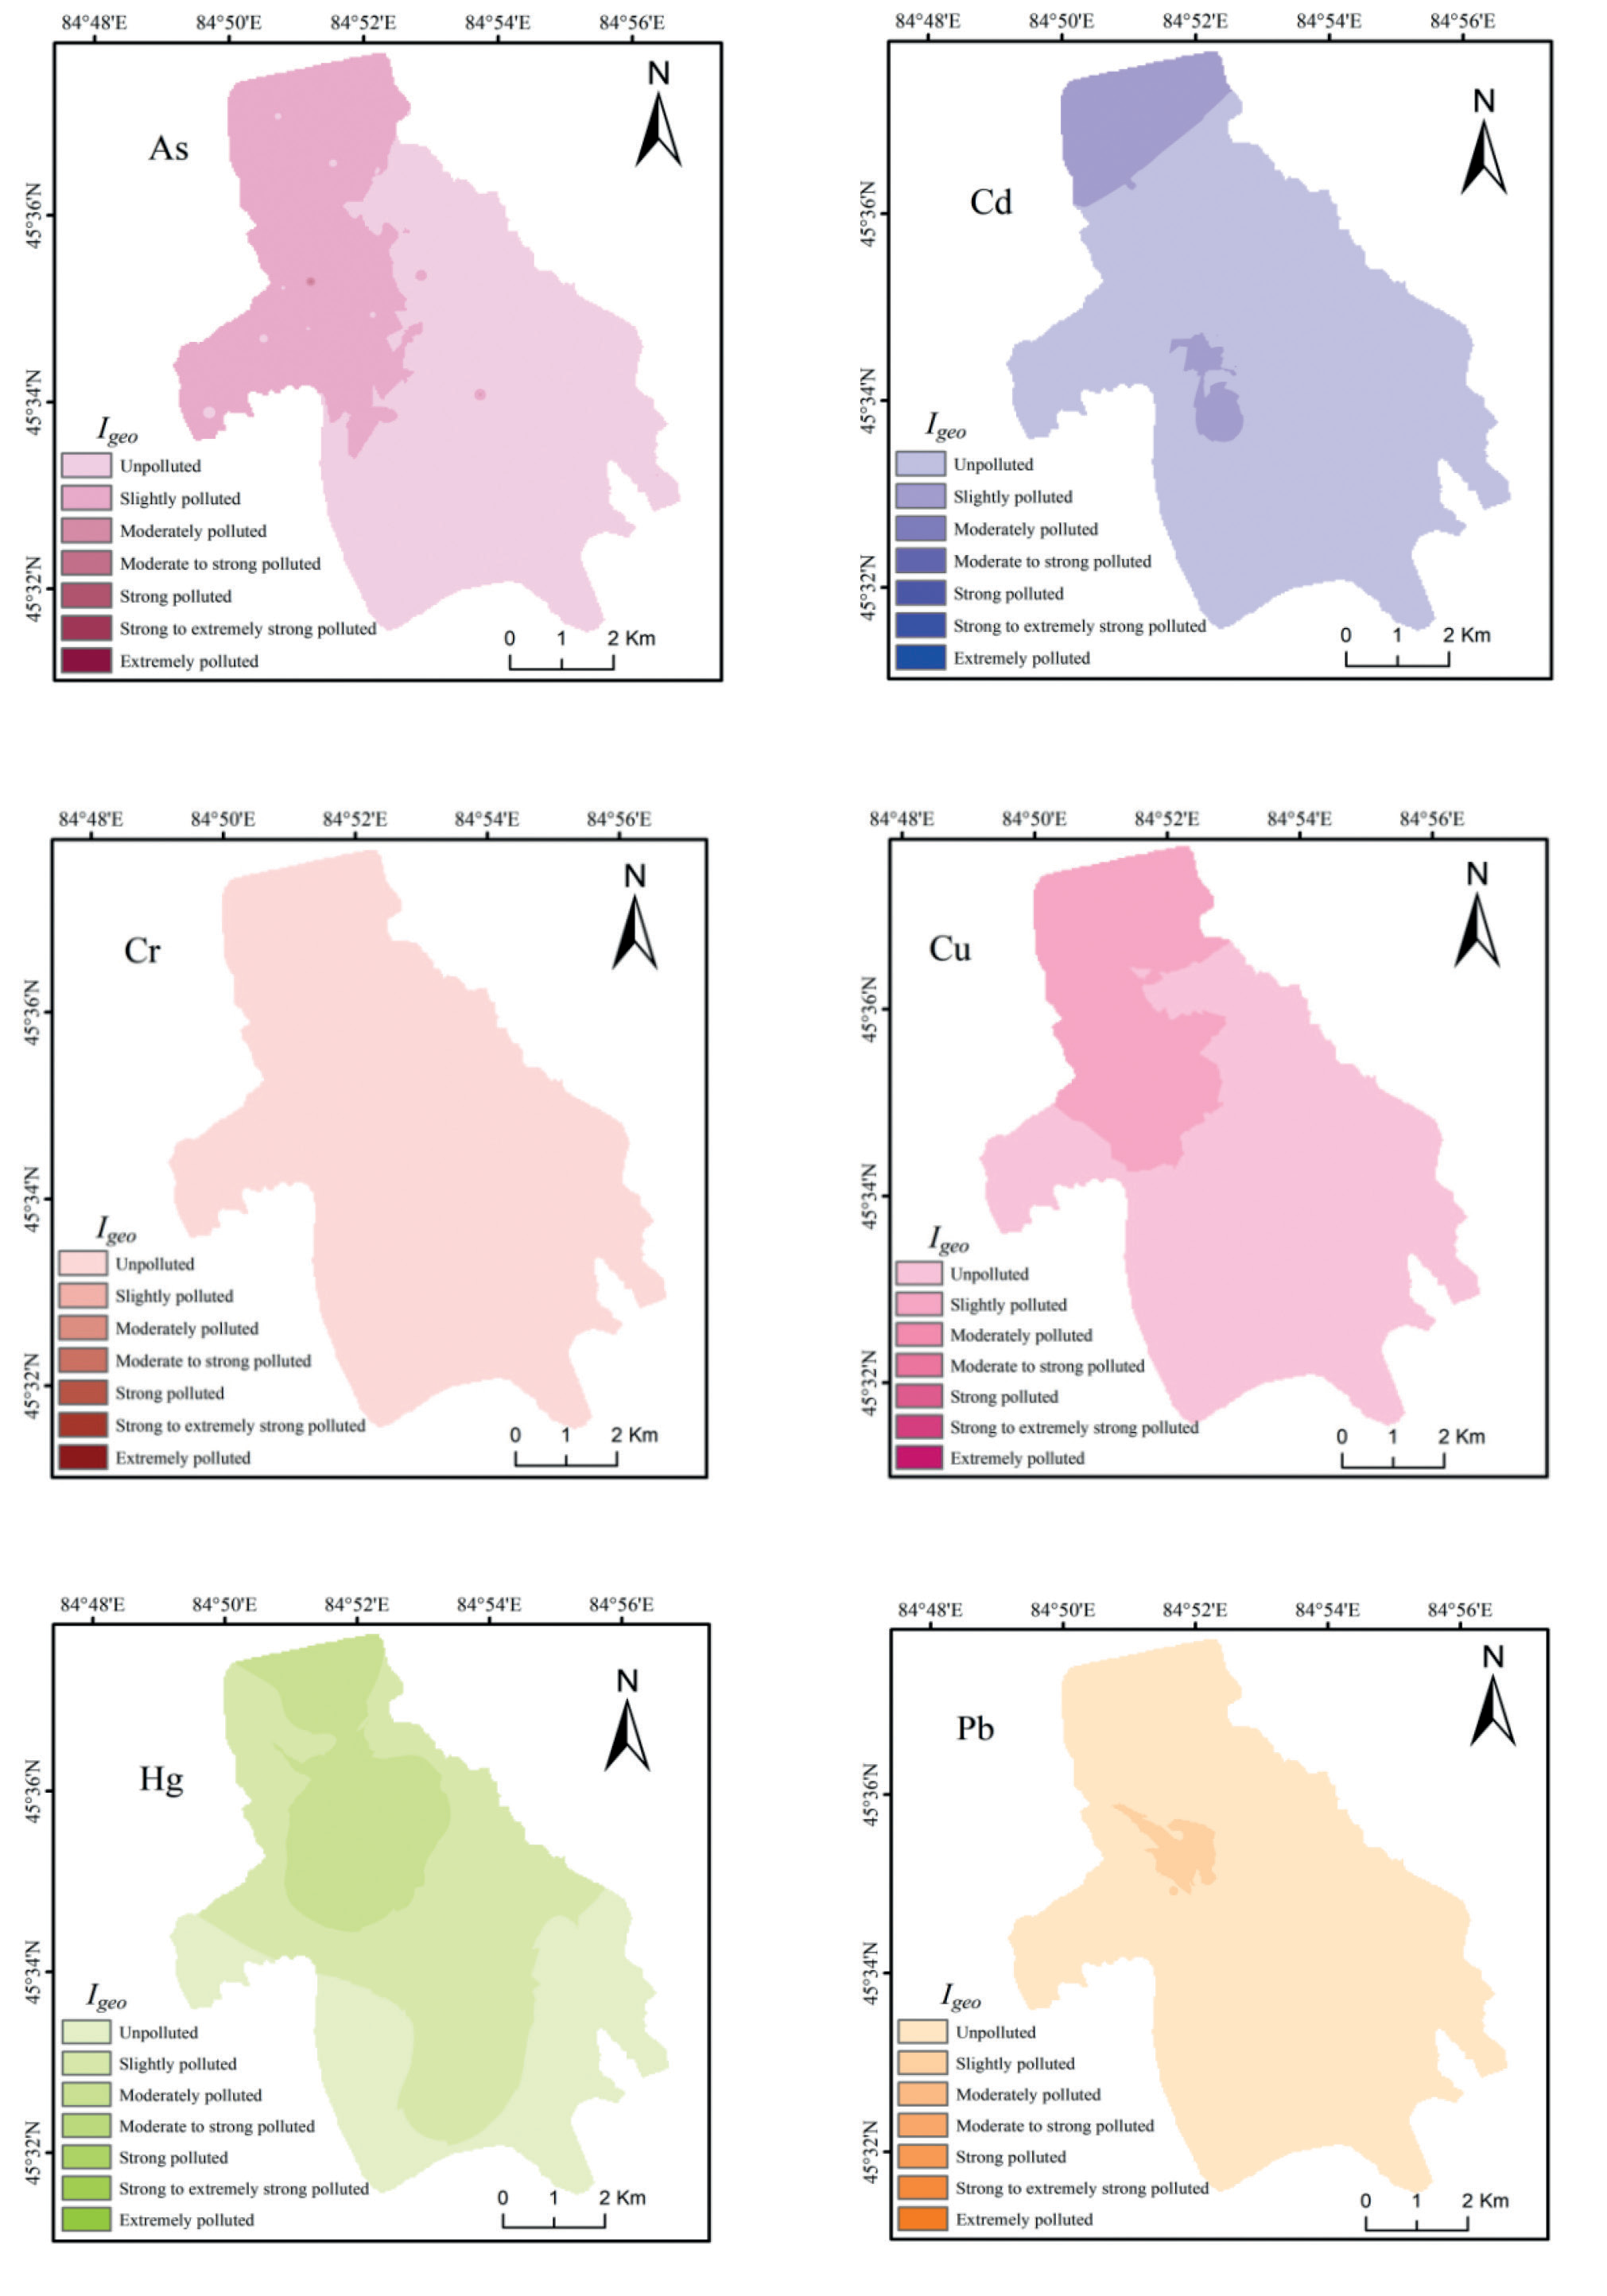
The six heavy metals’ geographical distribution in the research area’s surface dust is depicted in Fig. 4 together with their Igeo values. According to Fig. 4, there are some differences in the geographical distribution patterns of the Igeo values of the six heavy metals in the surface dust in Karamay. Related scholars have carried out a lot of research on the spatial distribution characteristics and contamination characteristics of heavy metal elements in surface dust of different cities in China. For example, Based on GIS technology and geostatistical method, Gulibanu et al. [5] discussed the spatial distribution pattern and pollution characteristics of 9 elements in the surface dust of Urumqi city, Xinjiang, and found that the mean Igeo of 9 heavy metals in the surface dust in the study area reached moderate Hg and slight Zn, Pb and Cd pollution levels. Adila et al. [19] studied the pollution characteristics and source analysis of 6 trace elements in the surface dust of Korla city, Xinjiang, and found that Hg and Pb in the mean Igeo of 6 heavy metals were mildly polluted, while Cd, As, Cr and Cu were at the pollution-free level. Tao Hong et al. [20] studied the pollution characteristics of heavy metals in the surface dust of Yinchuan City, and concluded that the mean value of heavy metals Igeo As, Ni and Cr showed no pollution level, Cu and Pb were light pollution levels, Hg and Zn were moderately polluted, and Cd was moderately polluted.Mohammed et al. [21] studied the Human Health Risks Associated with Metals from Urban Soil and Road Dust in an Oilfield Area of Southeastern Algeria, Regarding road dusts, mean Igeo of heavy metals were significantly higher than those of the urban soils.
In general, the zonal distribution pattern of the Igeo values of As, Cu, and Hg in surface dust in Karamay exhibits a clearer declining tendency from the northwest to the southeast of the research region. In the urban environment, Hg in surface dust has been linked to commercial, transit, and home sources, according to research by Sternbeck et al. [22] Additionally, road emissions and regular residential sources were linked to the Cu and As element concentration in surface dust [23– 25]. One of the causes of Cu and Hg elements in surface dust is related to transportation operations, such as the deterioration of brake blocks and other automobile components, exhaust emissions, etc [26]. In Karamay, the surface dust exhibits a distinct spatial distribution pattern of Cd Igeo values with two pollution zones. Jiang Bingyan et al. [27] study revealed that there are many different sources of atmospheric emissions, plating metal corrosion, shedding of building coatings and wall repairs, and long-term use of Cd-containing fertilizers in urban green spaces (Jiang et al.2010). These sources all contribute to the complex sources of Cd elements in urban surface dust. A significant industrial area and the intersection of the G30 National Highway and the S201 Provincial Highway can be found in Karamay’s northern region. As can be observed, industrial production and transportation in the research region have a significant impact on the distribution pattern of Cd and Hg components in surface dust. It is evident from the geographical distribution pattern of Pb and Cr that natural factors like urban soil matrices mostly impact the distribution of these two elements in surface dust in the studied region.
Table 4.
Geo-accumulation Index of heavy metals of road dusts in Karamay.
Source Analysis of Heavy Metal Elements in Surface Dust
Correlation Analysis of Heavy Metal Element
To determine the sources of heavy metals and to study the relationship between the elements in Karamay’s surface dust, SPSS 23 was employed. As shown in Fig. 5, there were strong positive correlations between Hg–Pb–Cu, As–Cu, and Pb–Cr–Cu in the Karamay surface dust at the P < 0.01 level. Hg–As–Cr and Cr–Cu demonstrated significant positive relationships at the P < 0.05 level [28]. The analysis presented above indicates that these factors’ interactions are complicated and require further investigation.
Cluster Analysis
Fig. 6 illustrates the division of the sources of heavy metals in surface dust in Karamay into two groups: the first group consists of four elements, including Hg, Pb, As, and Cd, while the second group consists of two elements, including Cu and Cr.
Hg, Pb, As, and Cd compose the first set of elements. The correlation between the Hg–Pb and As–Hg elements is extremely significant and considerably positive, demonstrating that the Geo-chemical qualities or sources of these four elements in the surface dust in Karamay are comparable. Which Indicates that the Geo-chemical characteristics or origins of these four elements are comparable in the surface dust of Karamay, the Hg–Pb and As-Hg elements both shown extremely significant positive correlation and substantial positive correlation, respectively [5]. The research area’s surface dust revealed higher concentrations of Hg, Pb, As, and Cd than the equivalent soil background levels, suggesting some human effect [29]. According to related research, the sources of mercury in surface dust are diverse and mostly come from the burning of fossil fuels, the electronics sector, the paper industry, the pharmaceutical business, and household garbage. In Wuhu, As was researched in soil and surface dust by Fang Fengman et al. [30] They discovered that As is mostly produced during the burning of fossil fuels. Tire attrition and the combustion of leaded fuel produce pb, which is then enhanced on the surface by wet and dry deposition [31–34]. Urban surface dust mostly originates from transportation sources, such as traffic exhaust and tire wear [30, 35, 36]. Relevant research has demonstrated that industrial cities often have greater levels of trace element contamination in surface dust [4, 37, 38]. The production and processing of oil results in the discharge of several pollutants, including heavy metals [11, 39–41].There are various levels of heavy metal enrichment in the soil, according to research by Fu Xiaowen et al. [10]. on the heavy metals in the soil of the Shengli oilfield region. The industrial and commercial areas in the study area’s northwest, as well as the area of heavy traffic at the intersection of the G30 national highway and the S201 provincial highway, were where the high value areas of Hg, Pb, As, and Cd in the surface dust first appeared when combined with the actual situation in the study area. There are various levels of heavy metal enrichment in the soil, according to research by Fu Xiaowen et al. on the heavy metals in the soil of the Shengli oilfield region. The industrial and commercial areas in the study area’s northwest, as well as the area of heavy traffic at the intersection of the G30 national highway and the S201 provincial highway, were where the high value areas of Hg, Pb, As, and Cd in the surface dust first appeared when combined with the actual situation in the study area. It is evident that the combined effects of urban human activities such urban industry, commerce, and transportation may have an impact on these four constituents in the surface dust of the research region. The study mentioned above demonstrates that the first set of components is made up of “anthropogenic” elements.
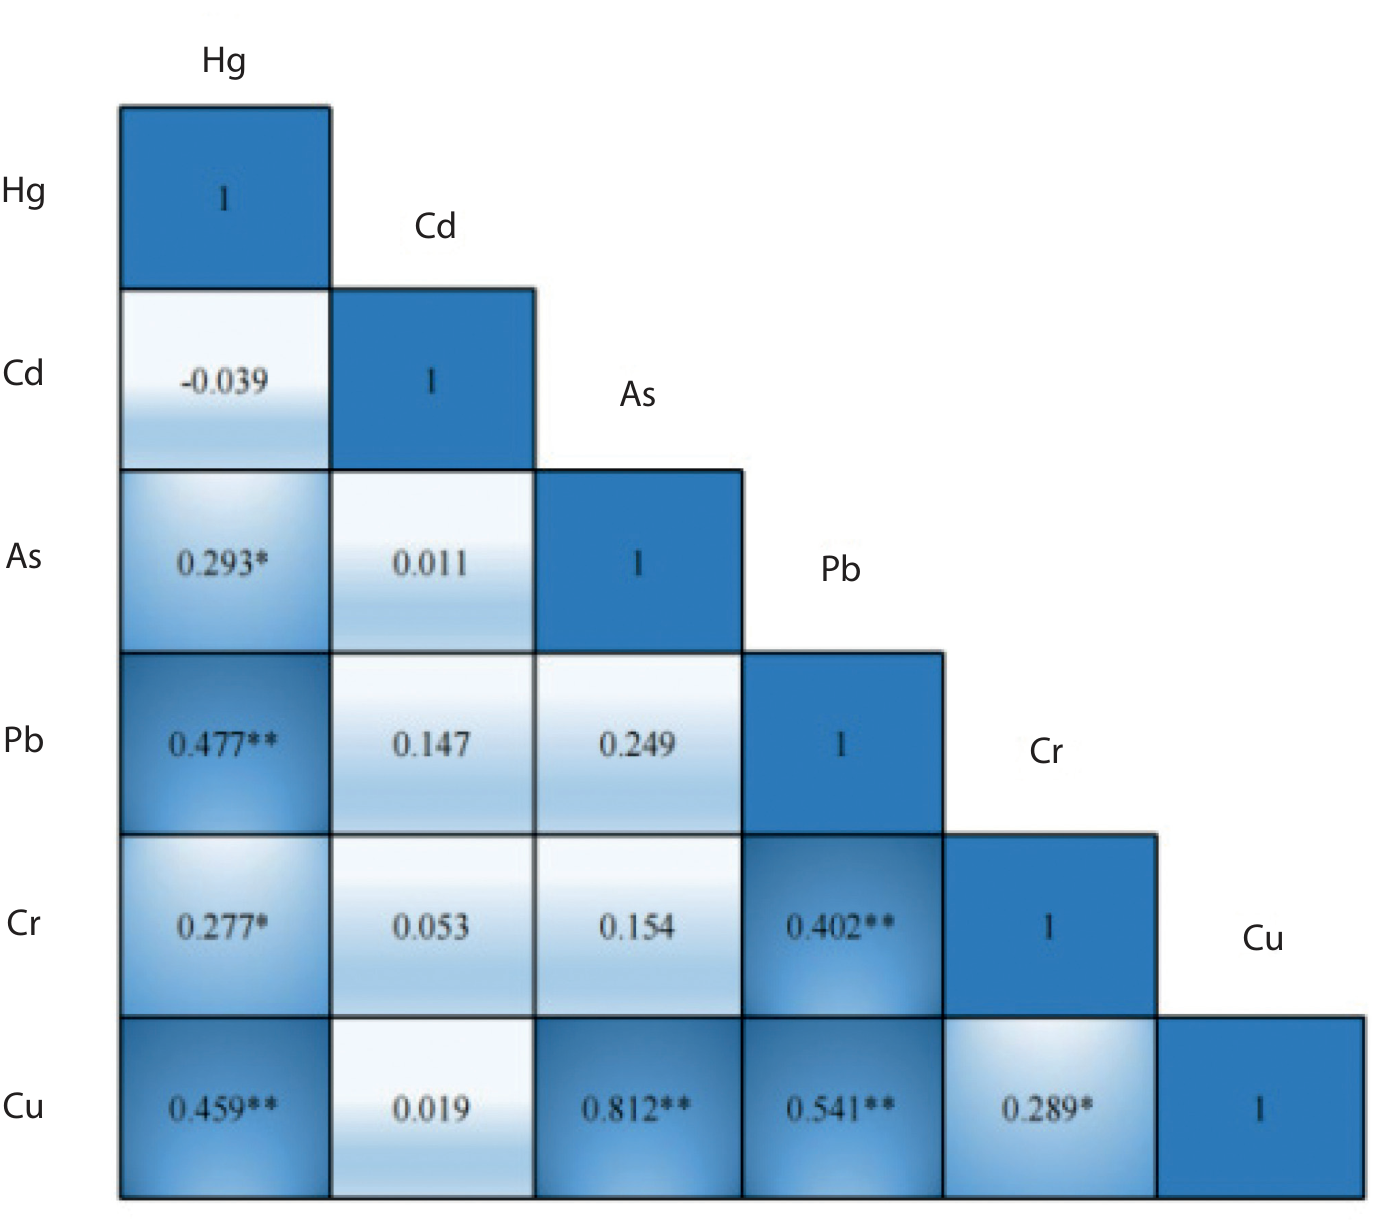
Cr–Cu, the second set of elements, had a strong positive correlation. According to similar research [42, 43], the soil matrix typically regulates the levels of Cu and Cr in urban soils, and they are of natural origin. In their investigation of the heavy metals present in the surface dust of City, Li et al. [35] discovered that Cr also has a natural origin. The results of the content analysis and pollution evaluation in this study suggest that the content of Cr and Cu elements in the surface dust in the study area is largely influenced by natural factors, such as the parent material that forms soil, and that human activities have little impact on it. The study mentioned above demonstrates that the second set of components are those with “natural source” origins.
Positive Matrix Factorization (PMF) Model Analysis
A positive definite matrix factor analysis (PMF) model was employed to assess the sources of six elements in surface dust in the research region and evaluate the contribution ratios of the six elements to further examine the sources of heavy metals in surface dust in Karamay (Fig. 7).
Considering their respective contribution rates of 49.3%, 39%, and 27%, Fig. 7 demonstrates that the principal loading’s of factor 1 are Cu, Hg, and Pb. Relevant studies have demonstrated that Hg elements in surface dust are primarily sourced from the combustion of fossil fuels, the electronics industry, the paper industry, the pharmaceutical industry, and household waste. In contrast, Cu elements in surface dust are primarily sourced from transportation sources [44], and the wear and tear of engine parts and the leakage of fuel oil or gasoline may be the source of Cu accumulation. Since Karamay is a typical windy region of China, the predominant wind direction throughout the year is primarily northwesterly, which may have an effect on the diffusion and dispersion of heavy metals. Therefore, Factor 1 may be understood as a source of atmospheric dust-fall.
With a contribution rate of 78.9%, As is the primary loading component of factor 2. Other related research indicates that the high concentration of As may be connected to industrial activities such as industrial emissions and sewage sludge [30]. Fang Fengman’s study of As in soil and surface dust in Wuhu demonstrates that As is mostly obtained from the burning of fossil fuels[45]. In light of the real scenario in the research region, the northwestern portion of the study area being a large industrial district and old town with dense structures and frequent human activities may have an impact on the high As levels. So, factor 2 may be thought of as representing industrial emissions.
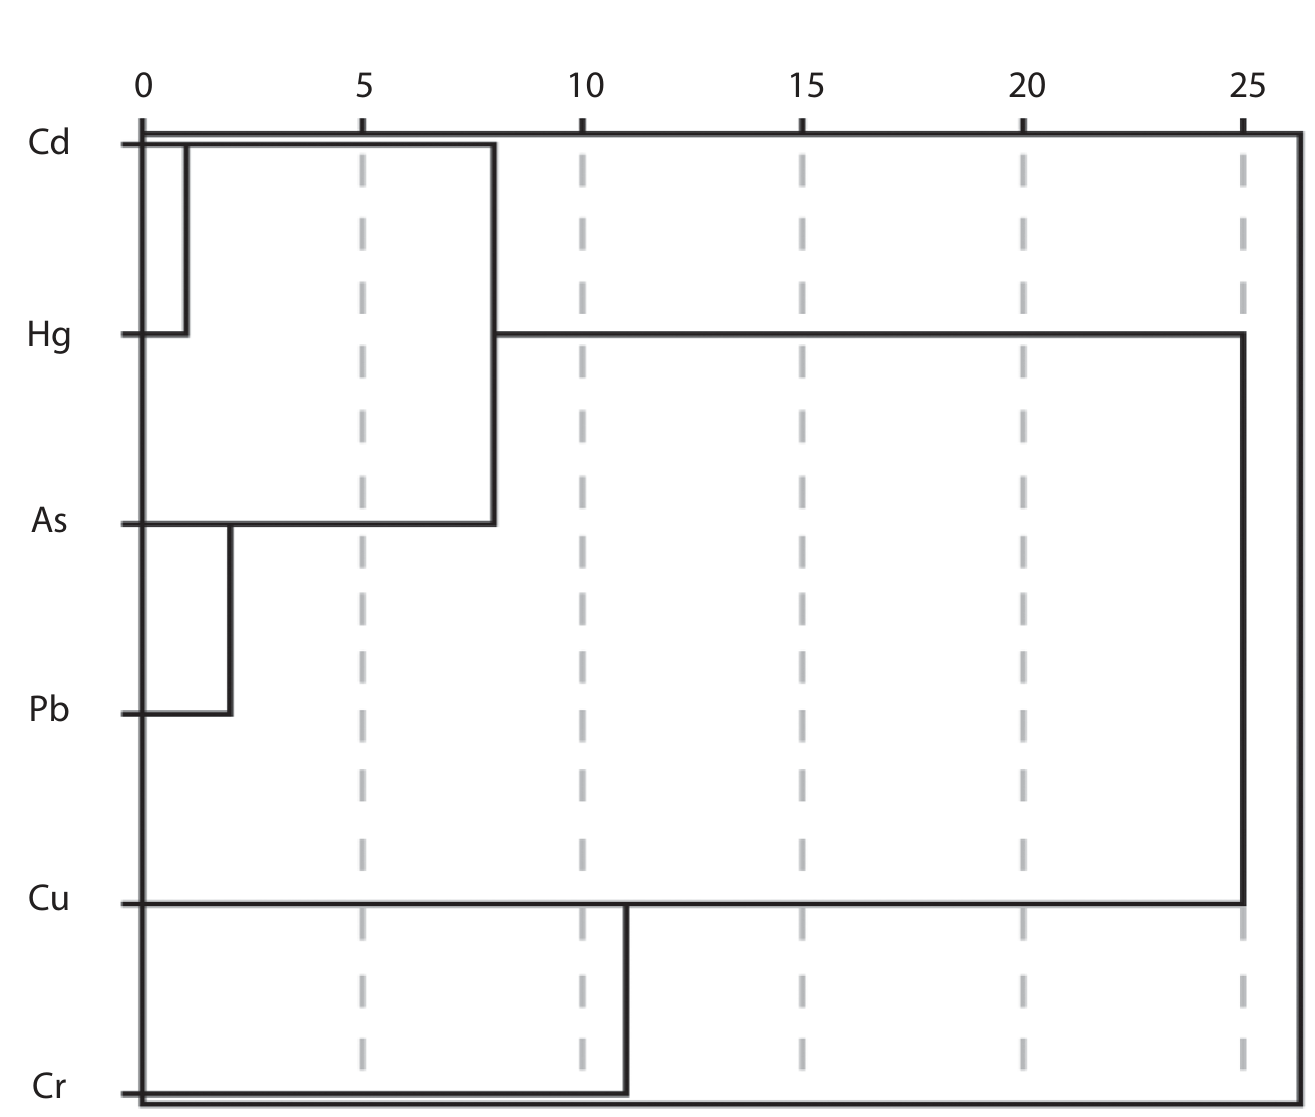
Fig. 7.
Contribution of heavy metal pollution sources to surface dust in the research area from PMF (%).
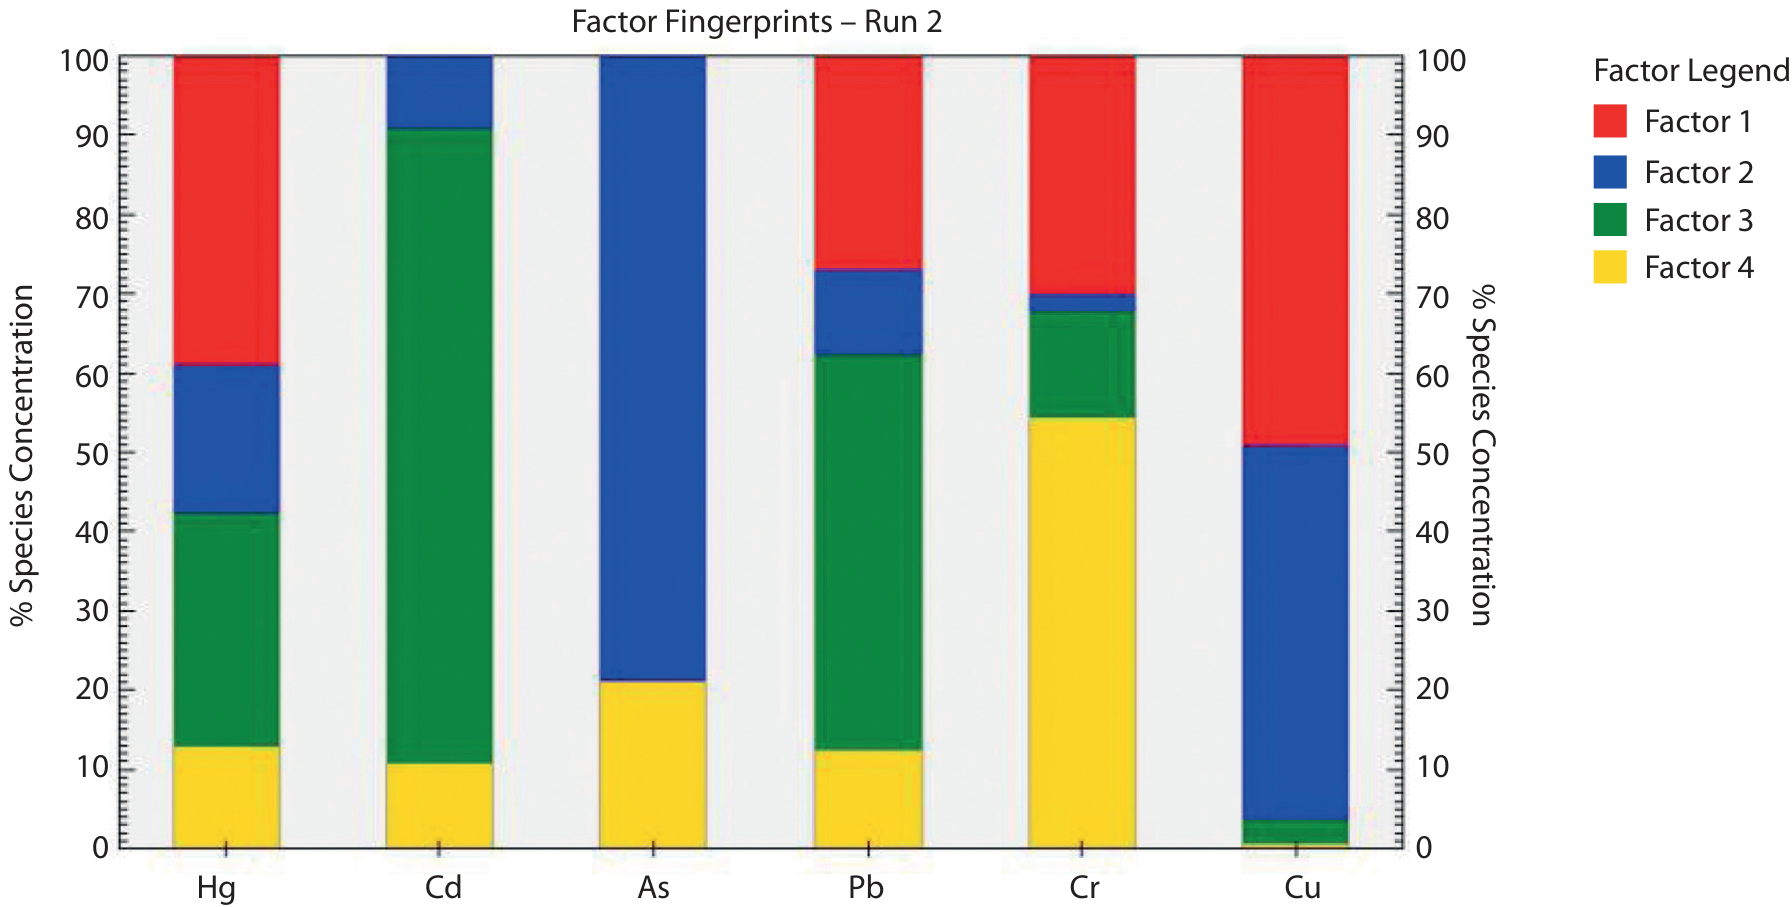
Cd, Pb, and Hg make up the majority of the load components in factor 3, contributing 80.1%, 50%, and 29.5% respectively. According to pertinent research, Pb is produced through the combustion of leaded gasoline and during tire wear, where it is further enhanced through wet and dry deposition. The principal sources of Cd in urban surface dust are from transportation, which includes tire wear and other traffic emissions[30, 35, 36]. As a result, factor 3 may be regarded as a source of transportation.
With contributions of 54.3%, 21.1%, and 12.7% respectively, Cr, As, and Hg made up the majority of factor 4 loadings. Li et al. investigated the heavy metals in surface dust in City and discovered that Cr also derived from natural elements. Relevant research [42, 43] have demonstrated that Cr in urban soils is typically regulated by the soil matrix and belongs to the natural source elements. Li et al. [37] investigation of the heavy metals in Zhuzhou surface dust revealed that Cr was also derived from natural sources.
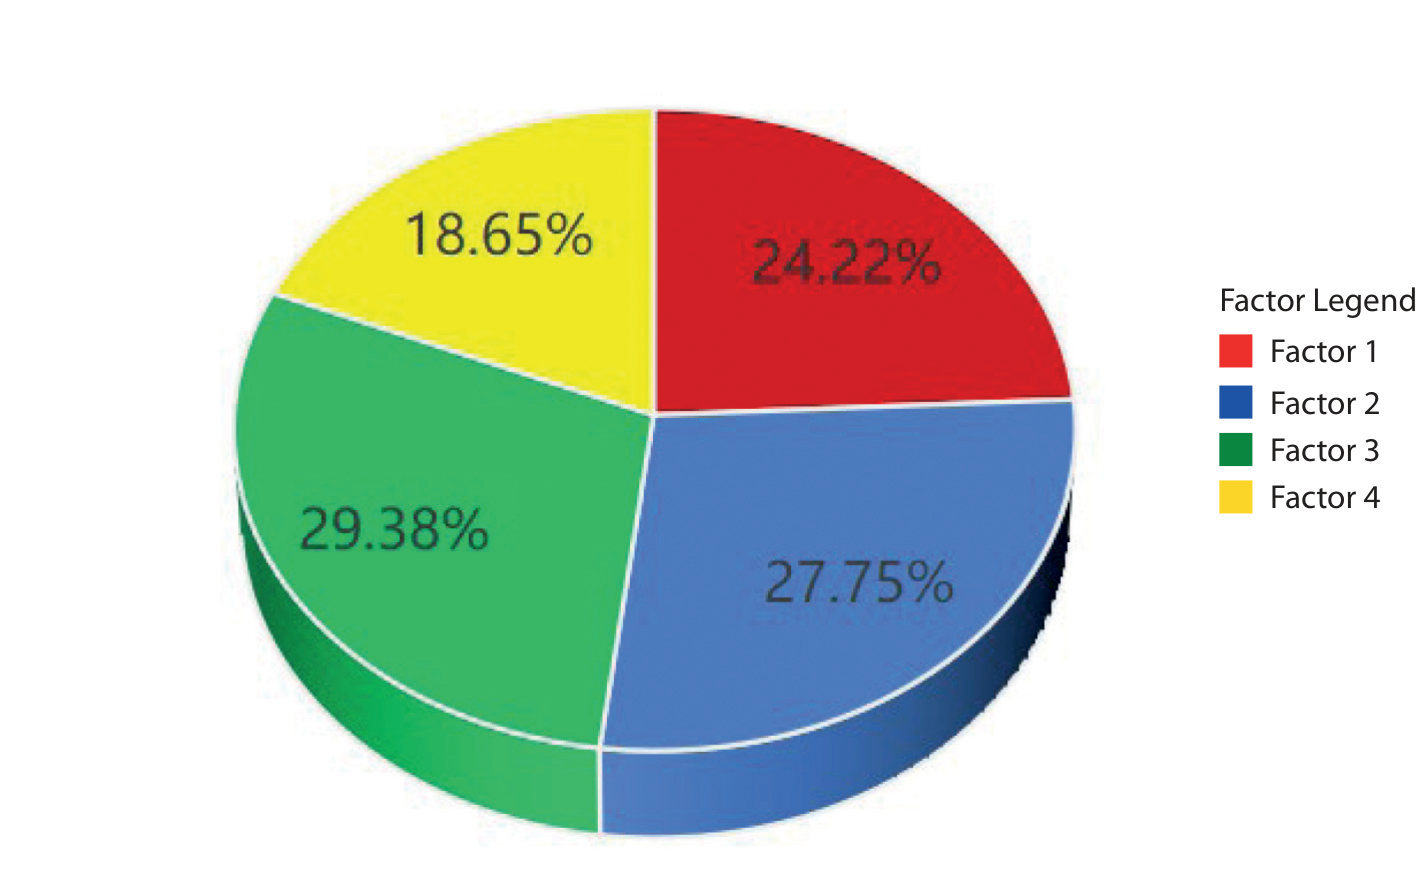
In summary, industrial emissions, transportation, and natural sources are the primary sources of heavy metals in surface dust in Karamay. According to Fig. 8, these four sources contributed a total of 24.22%, 27.75%, 29.38%, and 18.65%, respectively. This outcome demonstrates that the sources’ contribution rate, as determined by the Positive Definite Matrix Factor Analysis (PMF) model, is non-negative in nature, and the outcome is plausible.
Discussion
In order to apply the new development idea of “increasing production without increasing pollution” in the area, the ecological environment is tightly regulated in Karamay, a significant new industrialized metropolis in Xinjiang. The issue of heavy metal pollution has gotten progressively worse with the economy’s fast growth. The pollutants generated during oil production and processing infiltrate the atmosphere, water bodies, and soil system through industrial waste. These pollutants are then dispersed or deposited on various surfaces due to human activities and natural processes, posing harm to the surrounding ecological environment [46]. Due to variations in human activities’ intensity and nature across urban areas, significant disparities exist both in pollution levels and sources of heavy metals found in ground dust. Considering our specific study area conditions, elevated levels of heavy metals pollution primarily concentrate around downtown areas, as well as residential areas situated towards the northwest and southwest, along with the industrial zone located towards the northwest. Consequently, Karamay City should intensify its efforts to regulate pollution from oil industry operations and traffic emissions to mitigate potential risks associated with heavy metals present in dust.
Based on the average concentrations of As, Cd, Cu, Pb, and Hg elements in surface dust in the study area, it was determined that the heavy metal content of surface dust in Karamay was 1.64, 1.85, 1.50, 1.24, and 2.94 times higher than that of the soil background value in Xinjiang. With the assistance of the spatial distribution map of the heavy metal content in the study area, it is possible to identify that the element Cd has high values in the northwest and central parts of the study area, As and Cu have high values in the western and northwestern parts of the study area, and Pb, Hg, and Cd possess high values in the central part of the study area. These findings are related to the well-developed traffic in the city center, the high volume of vehicular traffic, and the industrial area in the western part. The high value zones are concentrated in the city center, in the residential districts to the northwest and southwest, and in the industrial sectors to the northwest due to spatial disparities in the intensity and nature of human activity in the city.
It is crucial to identify the heavy metals’ sources in surface dust in order to protect the ecological and environmental security of the local area, and a lot of research has been carried out in this area [47, 54]. Du Xianyuan [55] conducted a study on source analysis, toxicity, and rapid detection methods of soil pollutants in oil extraction areas by detecting twelve heavy metals in soil samples. The detection rate of five heavy metals including Pb, Cu, Zn, Ni, and Fe was 100%. Using factor analysis and multiple regression analysis to identify the main sources of heavy metals in soils of onshore oil extraction areas revealed natural sources (37%), transportation sources (19%), mixed sources (18%), coal combustion source (16%), petroleum source (5%), and agricultural source (5%). Liu Wei [56] et al. found that As elemental content was concentrated near the boundary line of the plant area when studying spatial distribution characteristics, source analysis, and pollution evaluation of soil heavy metals in petrochemical parks. Du Chunlei [57] et al.’s research showed that Hg, Cd, and As had single-factor pollution indices less than one while Pb, Zn, Cu, Cr and Ni exceeded it; Cr had the largest pollution index while Cu had the smallest.
In this study, the PMF model was integrated to verify the pollution traceability findings with one another in order to more accurately identify the sources of pollution and calculate their relative contributions. The four main sources – transportation sources, industrial emissions, sources of atmospheric dustfall, and natural sources – were determined using the PMF model. As is dominated by industrial emission sources with a contribution of 78.9%, Pb, Hg, and Cd are dominated by transportation sources with contributions of 80.1%, 50%, and 29.5%, respectively, Cu is drove by atmospheric deposition sources with a contribution of 49.3%, and Cr is dominated by natural sources with a contribution of 54.3%. As is dominated by industrial emission sources. The PMF model is workable for source analysis of heavy metals in surface dust in Karamay because the six heavy metals have larger weights and less variability in each of the four sources. The sources of pollutants may be further validated in conjunction with the geostatistical analysis of the geographical distribution features of the pollution sources, allowing for the proposal of focused solutions for urban environmental management.
Conclusion
Average concentrations of As, Cd, Cu, Pb, and Hg in Karamay’s surface dust were 1.64, 1.85, 1.50, 1.24, and 2.94 times higher than background soil concentrations, respectively. The six heavy metal elements’ average Igeo values were Hg > As > Cu > Pb > Cr > Cd. Overall, it appears that Hg was only faintly present in the research area’s surface dust, whereas As, Cu, Pb, Cr, and Cd were unpolluted.
Generally speaking, a declining tendency was visible from the northwest to the southeast of the research region in Karamay’s spatial distribution pattern of heavy metal components in surface dust. While the geographical distribution of the Igeo of Cd was more distinct, with the formation of two pollution zones, the Igeo of As, Cu, and Hg generally exhibited a decreasing tendency from northwest to southeast. The Igeo of Pb and Cr demonstrated a consistent pattern of distribution, with the Igeo of Pb exhibiting moderate pollution in the city center and no pollution elsewhere, and the Igeo of Cr exhibiting a pattern of non-pollution over the whole research region. As transportation, everyday life, and commercial activity all have a significant impact on Cu and Hg, industrial production and transportation have a significant impact on Cd, while natural variables like the soil-forming matrix of urban soils have a significant impact on Cr and Pb. Overall, the northwestern portion of the research region had more severe heavy metal element contamination in surface dust.
In Karamay, the correlation between six heavy metals in surface dust displayed highly significant positive correlations between Hg, Pb and Cu, between As and Cu, and between Pb, Cr and Cu at the P < 0.01 level, indicating that these heavy metals may come from the same or related sources of pollution. At the P < 0.05 level, there is a strong positive association between Hg and As, Cr, and Cr and Cu. In conclusion, it is thought that the relationship between these six heavy metals in the surface dust of Karamay is quite apparent.
Four sources of heavy metal pollution in surface dust were identified in the research region using the PMF positive matrix decomposition model: natural sources, traffic sources, industrial emissions, and atmospheric dust-fall sources. Among these, the buildup of Cr was mostly attributed to natural sources, that of Pb, Hg, and Cd to transportation, and that of As to industrial emissions as its primary source. The proportions of heavy metals in surface dust generated by atmospheric dust-fall, industrial emissions, transportation, and natural sources were 24.22%, 27.75%, 29.38%, and 18.65%, respectively. The sources that produced the highest heavy metals in the surface dust were those related to transportation.

