

Introduction
Scientific and technological innovation is the primary productive force of social and economic development. It is able to promote labor productivity, diminish pollutant emissions, accelerate industrial construction upgrades, and contribute to ecological protection and the economy’s high-quality development. Technological innovation is the strategic support to improve social productive force and countries’ comprehensive power, which plays an essential role in a country’s economic development. If one country is powerful in the economy, it ought to be strong in technological innovation, with comparative advantages of innovation in technology, products, industries, commercial models, and brands, in addition to the technological innovation’s core position [1]. Chinese President Xi Jinping emphasizes that the international situation is changing and evolving at a high speed, and the new round of technological an d industrial revolution is deeply developing. Only by fully unleashing technology as the primary productive force and activating innovation as the primary driving force can we win the initiative in the new round of competition and provide new impetus for high-quality development.
Under the complicated and flexible external circumstances, it is clear that an imbalance still exists in China’s regional technology innovation level, such as the source distribution of technological innovation, fund support, and support from policies. Relying on technological progress, implementing a strategy of innovation driving development, and consistently improving the quality and benefits of Chinese economic development are vital measures to accomplish the transformation from a power with a large population to a power with strong scientific capacity, in addition to a way to get rid of the extensive growth model [2]. At present, the right approach to improving the technological innovation level is still unsolved, while the premise to solve it is to effectively calculate the technological innovation level. Thus, it is essential and meaningful to measure the technological innovation level, evaluate the regional technology innovation level correctly, and then formulate policies of regional technology innovation [3]. The research in this paper is helpful in comprehensively evaluating the technological innovation ability of each region, clarifying the differences and characteristics of scientific and technological development between regions, and guiding the allocation of resources and industrial upgrading. Through in-depth analysis, the spatial distribution law and dynamic change characteristics of scientific and technological innovation are revealed, which provides a scientific basis for formulating precise policies and measures and promoting the coordinated development of the regional economy. In addition, such research can help monitor the progress of scientific and technological innovation, evaluate the effect of policy implementation, adjust development strategies in time, and promote the formation of an effective regional innovation system. Therefore, in-depth exploration of the measurement and regional differences of China’s scientific and technological innovation level can not only improve the country’s overall innovation ability but also promote balanced development between regions and realize the comprehensive integration of science and technology with an economic society.
The larger the effect of technological innovation on regional development, the more attention is paid to relevant research in technological innovation. Scholars have developed a series of innovative and groundbreaking research on innovative system theory, the principal divide of technical innovation capacity, and theoretical models since 1990. Although these studies have a certain theoretical basis for the case design of technical innovation capacity measurement, the premise that the technological innovation’s capacity measurement can play a positive role in practice is to scientifically and objectively select technological evaluation indexes. There haven’t been unified principles for selecting evaluation indexes in academic circles, resulting in larger differences in evaluation results of national technological innovation capacity levels under different evaluation principles [4]. As for measuring the technological innovation level, Huang et al. started from input, cooperation output, and effect of technological innovation to construct their evaluation index system about 11 provinces of the Yangtze River Economic Belt [5]. Some scholars measured the level of technological innovation based on its efficiency. Using panel data of 179 cities from 2003 to 2020, Ma et al. measured the efficiency of technological innovation of the whole country and seven research regions by the total super efficiency SBM model [6]. Lai et al. measured each province and city’s efficiency of technological innovation by the super efficiency SBM-Malmquist model, with the research objects of China’s 30 provinces and cities from 2011 to 2019 [7]. However, the research is incomplete because researchers only researched and analyzed technological innovation levels from input and output perspectives. Besides, most scholars started from a micro perspective to analyze part of the regions’ technological innovation level, such as cities, economic belts, and urban agglomerations [8]. Huang et al. evaluated the technological innovation capacity of cities in the Yangtze River Economic Belt as a whole. Therefore, it is hard to accurately reflect the total level of China’s technological innovation development from a macro perspective [9]. As for measurement methods in the research, previous research used the entropy weighting method [10, 11], the Topsis method [12], and the analytic hierarchy process (AHP) [13] based on constructing relevant evaluation indices. Nevertheless, the application of these methods is not perfect. For example, the entropy weighting method only considers the dispersion degree in the index value’s weight calculation, without considering the similarity among index values. This means the index may not accurately reflect its importance, as for highly similar index values. In the Topsis method, Euclidean distance and other distance-measuring methods are used to calculate distances, which ignores the relation among indexes and causes the evaluation of index importance to be inaccurate. AHP involves the decision maker’s value judgment, so results that are affected by personal preference or experience may not be objective or the same. Therefore, some scholars realized the issues and proposed the fuzzy matter-element model to overcome these disadvantages [14-16]. Xu et al. used a fuzzy matter-element model to do a dynamic evaluation of China’s 31 provinces’ ecological security in tourism [17]. Regarding 16 cities in Anhui province as research objects, Liu et al. considered self-fuzziness of ecological security in tourism, with the measurement balancing advantages of the fuzzy matter-element model and the Euclid approach degree [18]. Other studies develop research based on technological innovation’s overflow effect at the microenterprise level, such as effects that technological innovation has on enterprises’ carbon emissions [19, 20], supply chain in enterprises’ elasticity [21], and industrial collaborative development [22-24]. So it can be concluded that technological innovation has crucial effects on many aspects of economic and social development.
Compared with previous research, the present literature lacks deeper knowledge, so there is still space to improve information. Firstly, the measurement index is monotonous. The measurement index system of technological innovation level is only constructed from input or output, so that the development status of the technological innovation system cannot be reflected completely. Secondly, research on spatial dynamic evolution is monotonous. Few researchers focus on spatial characteristics based on spatial autocorrelation analysis. Thirdly, adding fuzzy matter-element to the system evaluation of technological innovation can eliminate the index system’s fuzziness and incompatibility. Thus, starting from input, effects, innovative environment, and technological innovation output, the paper constructs an evaluation index system of China’s technological innovation level, making comprehensive comments on China’s technological innovation level by improved CRITIC and fuzzy matter-element analysis methods. At last, the paper analyzes measurement results, regional differences, and the spatial dynamic evolution of China’s technological innovation level.
To solve this problem, the premise is to have an effective way to measure the level of scientific and technological innovation. Therefore, the scientific and reasonable measurement of scientific and technological innovation is particularly important. This measure can not only help us to accurately assess a regional scientific and technological innovation level but also develop the region’s science and technology innovation policy to provide a powerful basis. Only when the current level of innovation is clear can we put forward targeted improvement measures to promote the development of scientific and technological innovation. So, scientific and reasonable measures for evaluating science and technology innovation levels and optimizing regional scientific and technological innovation have profound significance.
The rest of the paper is divided into four parts. The second part describes research methods and data sources. The third part is the measurement results and the difference analysis of China’s technological innovation level. The fourth part discusses China’s technological innovation level’s dynamic evolution and spatial characteristics. The final part contains research conclusions, implications, recommendations, and prospects.
Research Methods and Data Sources
Research Methods
Improved CRITIC Method
The CRITIC method is an objective weighting method based on data fluctuation. The point is two indices: one is fluctuation (contrast intensity) and the other is conflict (correlation). Standard deviation was used to represent contrast intensity. The larger the standard deviation, the more serious the fluctuation and the higher the weight. The correlation coefficient represents conflict. The larger the correlation coefficient between indicators, the smaller the conflict, and the lower their weight. When calculating weights, the comparison strength is multiplied by the conflicting indicators and normalized to obtain the final weight. However, previous research has found that some issues exist in the process of calculating weights. Using standard deviation to reflect the degree of variation between data may carry the risk of low accuracy and large errors, and the dimensions between various indicators are different. Using standard deviation to reflect the contrast strength is not accurate or objective. In addition, the correlation coefficients between indicators may have negative values, which may result in offsetting during the calculation process. The improved CRITIC method reduces subjectivity through objective weighting and data-driven approaches, enhancing the reliability and adaptability of the evaluation while considering conflicts between indicators to avoid redundant weighting issues. Therefore, the paper will improve the CRITIC method by replacing the standard deviation and correlation coefficient with the absolute values of the standard deviation and correlation coefficient. The process to improve the calculation weights of the CRITIC method is as follows:
Among this, Cj represents the j index’s information amount; X̅j represents the j index’s average value; σj represents the j index’s standard deviation in the technological innovation level index system, rij represents the i and j index’s relevant coefficients, and
Fuzzy Matter-Element Analysis
Fuzzy matter element analysis is an organic combination of fuzzy mathematics and matter element analysis, with the core of promoting the transformation of things and effectively solving fuzzy incompatibility problems. Matter element analysis was proposed by the famous Chinese mathematician Cai Wen in 1980. It is mainly used to solve complex issues that are incompatible with each other and is applied to multifactor evaluation problems, pioneering an ordered triplet composed of three basic elements: “things”, “features”, and “fuzzy values”. Combining matter element analysis with fuzzy set theory and using the membership degree theory of fuzzy mathematics can transform uncertainty evaluation into deterministic evaluation. The fuzzy matter-element analysis method excels in handling uncertainty and ambiguous information, supports multi-dimensional evaluation and flexible modeling, and provides intuitive and easily interpretable results. Combined, these methods not only provide objective weights but also effectively address uncertainties in complex systems, making the evaluation results more comprehensive, scientific, and reliable. This combination of methods is not only suitable for assessing scientific and technological innovation but also has broad applicability, offering robust support for the comprehensive measurement of complex systems. The evaluation of technological innovation level can be seen as a complex problem where various evaluation factors are incompatible. Introducing matter element analysis can reduce subjective one-sidedness in multifactor discrimination. At the same time, using the Euclidean closeness method in fuzzy matter elements, the uncertainty evaluation of the scientific and technological innovation level is transformed into a deterministic evaluation, comprehensively and scientifically measuring China’s scientific and technological innovation level. The algorithm steps for expressing fuzzy matter elements are as follows.
(1) Fuzzy matter-elements and fuzzy composite matter-elements. Fuzzy matter-elements consist of ordered triplets of things, features, and fuzzy quantity values.
In the formula, R represents the fuzzy matter-element; M represents matter; C represents the matter features (the indexes in the technological innovation level); X represents the magnitude; and μ(X) represents the fuzzy magnitude response to matter features (the membership degree of the relative magnitude X).
Matter M has n features C1, C2, ..., Cn, and the corresponding fuzzy magnitudes are μ(X1), μ(X2), ..., μ(X1). These are factors of the fuzzy matter-element with n dimensions. If the fuzzy matter-element with n dimensions and m matters exists, it can be called the fuzzy composite matter-element of n dimensions with m matters.
Among this, Rmn represents the fuzzy matter-element; Mj(j = 1, 2, ..., m) represents j matter; Ci(i = 1, 2, ..., n) represents i matter features; Xij represents the i feature’s magnitude corresponding to j matter; and μj(Xij) represents the fuzzy magnitude corresponding to the i feature of j matter (the membership degree of relative magnitude Xij with matter Mj that corresponds to feature Ci).
(2) According to the principle of the subordinate membership degree, the degree to which the corresponding fuzzy quantity value of each single index belongs to the corresponding fuzzy quantity value of the corresponding evaluation index of the standard scheme is called the subordinate membership degree. In terms of the evaluation scheme, each evaluation index is divided into a larger and better index and a smaller and better index, which are calculated using the following formula:
The bigger the better type index:
The smaller the better type index:
Where Xij denotes the subordinate membership degree, that is, representing the evaluation index value of the j index in i region; max(Xij) represents the maximum value of Xij; min(Xij) represents the minimum value in Xij; and xij represents the values after standardization.
Therefore, a fuzzy matter element was constructed with the optimal membership degree R'mn.
(3) Standardized fuzzy matter-element with n dimensions. All fuzzy magnitudes that comply with set standards are defined as standardized fuzzy matter-elements with n dimensions. Due to the index system consisting of positive and negative indexes, a standardized fuzzy matter-element was confirmed by the maximum or minimum value of its superior membership degree, according to all indexes in fuzzy matter-elements with a superior membership degree R'mn.
(4) Difference-squared composite fuzzy matter element. The square of the difference between the optimal membership degree fuzzy matter element and the standard fuzzy matter element was calculated to form the difference square composite fuzzy matter element and accurately express the absolute amount between each indicator value and the standard value, which provided a calculating basis for the following calculation of the Euclid approach degree.
Among this, Δij = (xij – x0j)2, i = 1, 2, ..., m; j = 1, 2, ..., n.
(5) Euclid approach degree. Approach degree represents how close this plan is to the best plan. The higher the approach degree of the plan, the closer it is to the best plan. Multiple factors decide the technological innovation level, so they adopted the “multiply first and then add” approach to calculate the Euclid approach degree. The formula is as follows:
Among this, 0≤ρHj≤1; the closer the value is to 1, the higher each region’s technological innovation level.
Dagum Gini Coefficient
Comparing the traditional Gini coefficient and the Theil index, the Dagum Gini coefficient not only copes with the cross-overlap problem in sample data but also reflects regional differences in the technological innovation level and decomposes sources of general regional differences [12]. Therefore, with the help of the Dagum Gini coefficient, the paper analyzed technological innovation levels’ regional differences and sources [25]. The Dagum Gini coefficient and decomposing formula are as follows:
The first approach is to calculate the total Gini coefficient of all provinces.
Among this, j and h are different regions; i and r are different provinces; Q and k are the total number of provinces; Qj(Qh) is the number of provinces in the j(h) region; Tji(Thr) is i(r) province’s technological innovation level in the j(h) region; and T̅ is the technological innovation level’s average value for all provinces.
Then, the Gini coefficient was decomposed by subgroup decomposition to fill the gap in region Gw, among region Gnb, and the intensity of transvariation Gt.
Among this, Gjj and Gjh represent the Gini coefficient of the j region and the Gini coefficient between the j region and h region, respectively.
In the formula, Uj = Qj/Q, Vj = QjT̅j/QT and Djh is the interaction of the technological innovation level between the j region and h region. The formula is as follows:
In the formula, djh represents the D-value of the technological innovation level between the jregion and h region; and Fj(Fh) is the accumulated distribution function of the technological innovation level in the j(h) region.
Kernel Density Estimation
As a non-parametric method, traditional kernel density estimation is mainly used to study the imbalance of spatial distribution. This method uses consistent density curves to describe random variables’ distribution situation so that the variable distribution’s position, shape, and other information can be reflected [26-30]. Kernel density functions included triangular kernel functions, quadrilateral kernel functions, Gaussian kernel functions, and Epanechnikov kernel functions. The Gaussian kernel function was selected in the paper to study the dynamic evolution of the distribution of high-level educational competition. The calculation formula was as follows:
Among this, f(x) is the density function of random variable x; N is the number of the observed value; xi is the independently-distributed observed value; x̅ is the average value of the observed value; h is the bandwidth; and K(x) is the Gaussian kernel density.
Exploratory Spatial Data Analysis
Exploratory spatial data analysis can accurately reflect the spatial distribution characteristics of data in both the overall and regional contexts, including global spatial autocorrelation and local spatial autocorrelation. Global spatial autocorrelation describes the spatial characteristics of data as a whole, explaining the spatial correlations and differences of the overall region. Local spatial autocorrelation describes the degree of difference between a local area and its surrounding areas. This article introduces exploratory spatial data analysis methods to analyze whether the level of scientific and technological innovation in various regions has spatial correlation.
The global spatial autocorrelation index selected the index used, and the calculation formula was as follows:
Among this, n means 30 provinces; xi and xj mean the technological innovation level in the i province and j province, respectively; x̅ means the average value of 20 provinces’ technological innovation levels; and Wij means the spatial weight matrix co-constructed by i province and j province. Morans'I index value range is [-1, 1]. The closer the value is to 1, the stronger the spatial correlation is. The opposite result means spatial contribution at random.
The LISA index for calculating the local spatial autocorrelation index was further used, and the calculation formula is as follows:
In the formula, all letters have the same meaning as in Formula (22). Based on the value range, spatial geographic elements were divided into four spatial correlation forms, including gatherings of “High-High (H-H)”, “Low-Low (L-L)”, “Low-High (L-H)”, and “High-Low (H-L)”.
Evaluation Index System Construction
Technological innovation is a key element that promotes economic growth and productivity. Technological innovation can improve industrial efficiency, lower costs, and create new job opportunities by introducing new technologies, upgrading production processes, and developing new products. High-level technological innovation is beneficial to increasing a country’s competitive capacity, promoting the economy to develop consistently and healthily. In the educational field, technological innovation is able to provide more learning opportunities and resources to drive the popularization of education and the improvement of educational quality. In the environmental field, it can accelerate the development and application of clean energy and diminish pollution and resource waste. Furthermore, technological innovation plays a crucial role in sustainable development. It can reduce dependence on natural resources, diminish environmental pollution, and push green development of the economy via researching and applying new clean technology and environment-friendly plans.
Thus, four layers of input, effects, environment, and output of technological innovation were finally confirmed based on systematicity, hierarchy, and data availability. 24 specific indices were used to construct a comprehensive measurement evaluation index system (see Table 1).
Data Sources
The research objective of the paper is the technological innovation level of China’s 30 provinces (including autonomous regions and municipalities directly under the central government) from 2010 to 2022. Due to a serious lack of data in Tibet, Hong Kong, Macao, and Taiwan, they were not included in the research range. The main data in the paper stem from the China Statistical Yearbook, the China Statistical Yearbook on Science and Technology, the China City Statistical Yearbook, the China Population & Employment Statistical Yearbook, and the website of the Ministry of Education of the People’s Republic of China (http://www.moe.gov.cn/). The linear interpolation method was used to remedy partial-year and provincial lost data.
Measurement and Difference Analysis of Technological Innovation Level
Weight Determination of the Measurement Index
To diminish the effects of subjective factors and keep evaluation results more scientific and reasonable, the paper calculated the weight of the technological innovation level’s index system using the improved CRITIC method. Table 1 provides more details.
Measurement Results and Fact Evaluation of the Technological Innovation Level
In this part, the fuzzy matter-element model was used to calculate the Euclid approach degree of technological innovation, so that each region’s comprehensive measurement evaluation results of technological innovation level. Table 2 illustrates Euclid’s approach to degree results of technological innovation in each region from 2010 to 2022.
Notes: Limited by length, the paper reports the Euclid approach degree results of each region’s technological innovation in partial years.
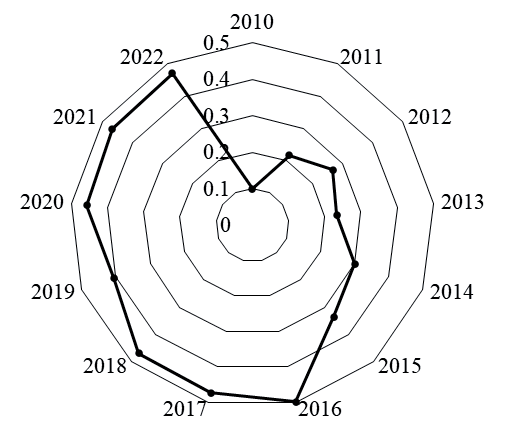
There was a rising trend in China’s overall technological innovation level between 2010 and 2022, with an annual average growth rate of 4.51%, which was fairly close to the technological innovation development highly emphasized by China’s government. In recent years, China’s government has regarded technological innovation as an important strategy for national development and one of the core powers that drive economic and social development. China has launched various policies and taken measures to push technological innovation, including investment enlargement, improvement of research personnel’s welfare, revolution of scientific management systems, and promotion of international technological cooperation. Also, enterprises are encouraged to increase research investment and accelerate product-study-research cooperation, cultivating innovative and technology-based small and medium-sized enterprises. These effects lead to obvious achievements. China has won crucial technological breakthroughs and innovative achievements in many fields, such as artificial intelligence, 5G communication, high-speed rail technology, and new energy vehicles. Besides, the development of Chinese technological enterprises greatly contributes to leading global enterprises and the progress of global technology.
As for different regions, the technology innovation level of the eastern region increased from 0.207 to 0.405, with an annual average growth rate of 2.37%; that of the central region rose from 0.139 to 0.201, with an annual average growth rate of 2.91%; and that of the western region increased from 0.126 to 0.159, with an annual average growth rate of 1.84%. It can be concluded that China’s technological innovation level and its growth rate showed “low in the west and high in the central region”. Affected by innate factors such as geographic position and economic basis, the technological innovation source level of China’s eastern, central, and western regions had a comparatively large gap, especially between the western and eastern regions.
Regional Differences and Source Analysis of Technological Innovation Level
Based on the measurement of technological innovation level, to further analyze regional differences in the technological innovation level of national, eastern, central, and western regions, the paper adopted the Dagum Gini coefficient subgroup decomposition method to analyze its overall difference, differences in regions, differences among regions, and distribution rate. Results can be seen in Table 3.
Overall Difference Analysis
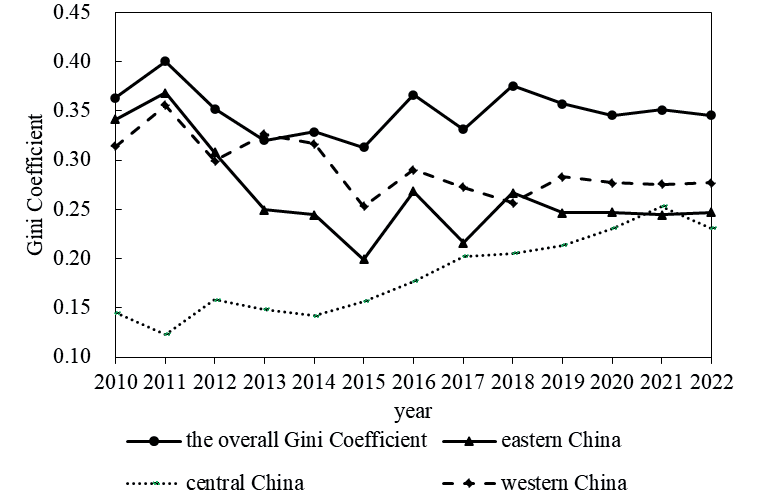
According to Table 3, the average value of the overall Gini coefficient in China’s technological development level from 2010 to 2022 was 0.35. Changing trends showed that China’s technological innovation level’s overall differences increased with a wave shape in the sample observation period. Specific data illustrated that the technological level had a slight upward trend from 2010 to 2011. Then, the technological innovation level’s overall Gini coefficient presented a decreasing trend year by year from 2011 to 2015, reaching the minimum value of 0.313. From 2015 to 2022, China’s technological innovation level showed a fluctuating upward trend. In general, there was a certain difference in technological innovation level among China’s provinces.
Table 1.
Evaluation index system and weight of the comprehensive measure of the scientific and technological innovation level.
Table 2.
The Euclid approach degree results of technological innovation in China’s provinces from 2010 to 2022.
Difference Analysis within Regions
According to the results of Table 3 and Fig. 1, there was an apparent difference between the overall Gini coefficient of China’s technological innovation level and the Gini coefficient within regions in eastern, central, and western China, respectively, and they showed different changing trends. The Gini coefficient in the eastern regions was higher than the Gini coefficient of the entire central and western regions. From the perspective of the three regions, the Gini coefficient in the eastern region decreased from 0.342 in 2010 to 0.247 in 2022, with a decline of 28.47%. The Gini coefficient in the central region increased from 0.145 in 2010 to 0.231 in 2022, with a gradually rising trend year by year. The Gini coefficient in the western region declined from 0.314 in 2010 to 0.277 in 2022, with a range of 12.28%. The self-technological innovation level was lower at the beginning in the western region, and they developed less than the eastern and central regions, so the Gini coefficient’s differences in regions were comparatively small.
Table 3.
Differences and deposition of China’s technological innovation level.
Overall, there was a narrowing trend in the inner differences between eastern and western China’s technological innovation levels. In the central region, partial inner differences in the technological innovation level started to enlarge. The possible reasons for the above phenomena are as follows: The rapid economic development in the eastern region, the concentration of scientific and technological innovation resources, and the large investment of high-end talents and capital lead to the unbalanced development of scientific and technological innovation levels within the region. The eastern coastal cities, such as Beijing, Shanghai, Guangzhou, and other first-tier cities, are far more capable of scientific and technological innovation than other regions. With the implementation of the national strategy of regional coordinated development, the eastern region’s scientific and technological innovation resources begin to radiate to the inland areas, reducing the imbalance within the region. The central region is in the stage of rapid industrialization and urbanization, and some cities, such as Wuhan and Changsha, have become regional centers of scientific and technological innovation, attracting a large number of scientific and technological resources and talents. Implementing the rising strategy in central China has significantly improved the scientific and technological innovation capacity of some regions, but this improvement varies among different cities, leading to the intensification of imbalance within the region. Although the level of scientific and technological innovation in the western region was initially low, with the support of the national western development strategy, the scientific and technological innovation capacity in the western region has been gradually improved, and the differences within the region have gradually narrowed. Implementing infrastructure construction and personnel training policies has improved the overall level of science and technology in the western region, especially the rapid rise of some key cities such as Chengdu and Chongqing, which has led to the development of surrounding areas.
Difference Analysis Among Regions
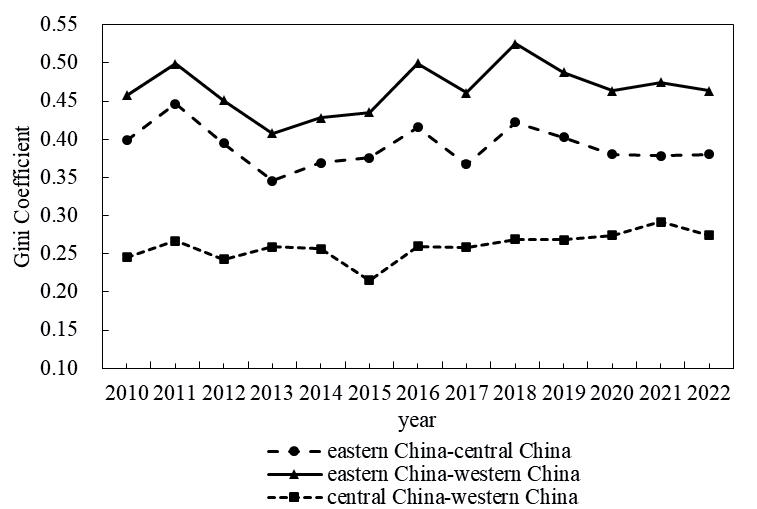
According to the results of Table 3 and Fig. 2, the differences in average values among the regions of the eastern region-central region, eastern region-western region, and central region-western region were 0.390, 0.466, and 0.26, respectively. It can be seen that the average Gini coefficient of regional differences in China’s scientific and technological innovation level during the sample inspection period, from large to small, was as follows: eastern region-western region>eastern region-central region>central region-western region. It was illustrated that technological innovation level differences between the eastern region and the western region were the largest, while high-level technological innovation level differences between the eastern and central regions were comparatively small. The regional differences in changes between the central and other regions were stable, and their gap narrowed. As a whole, differences among eastern, central, and western regions fluctuated, but they had a rising trend in general, with increasing differences among regions. It can be concluded that the imbalance of technological innovation levels was still obvious. Generally speaking, eastern regions had more innovative resources and advantageous conditions, including research institutes, universities, technological enterprises, and investment funds. Substantial research and innovative talents are gathered in these regions, forming an ecological innovation system and developing rapid technological innovation. Nevertheless, comparatively undeveloped central and western regions had lower technological innovation levels because of poor resources and conditions [31-34]. Therefore, these regions may face issues limiting technological innovation development. At that stage, it was key to balance the development capacity of technological innovation, such as further enlarging technological innovation’s support in central and western regions, encouraging enterprises to set up R&D centers in undeveloped regions, and promoting technological achievement transformation and industrial upgrade. Furthermore, it was necessary to encourage cooperation and communication among different regions, promoting source sharing and complementary advantages. Taking measures such as setting up technological innovation platforms and developing the construction of science and technology parks contributes to cooperation among regions and the overall improvement of technological innovation levels.
Source Analysis of Differences
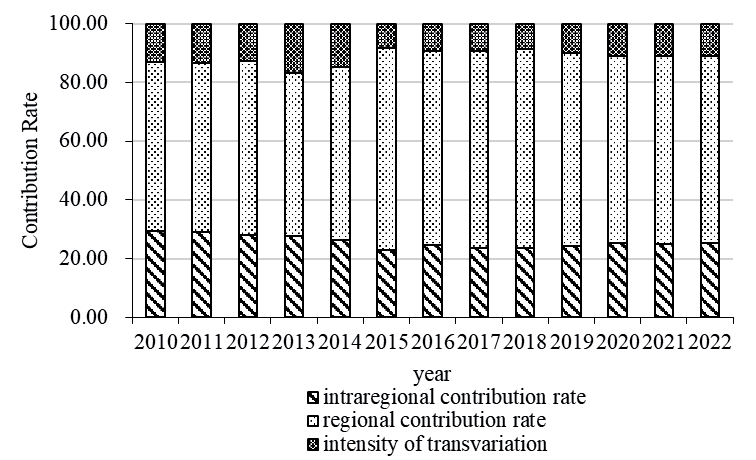
Overall, China’s technological innovation level consists of differences among regions, differences in regions, and the intensity of transvariation, and these are spatial sources of technological innovation. The contribution rate showed that differences among regions were the main source of regional differences in China’s technological innovation level, playing a leading role. From 2010 to 2022, the contribution rate of differences among regions was 62.82%, followed by differences within regions with a rate of 25.72%, and the smallest was the intensity of transvariation with a contribution rate of 11.47%. The difference in contribution rate of China’s technological innovation level among regions rose from 57.737% in 2010 to 63.74% in 2022 within the sample observation period. In addition, the difference in the contribution rate within regions and the contribution rate of intensity of transvariation declined 14.95% and 16.01%, respectively, from 2010 to 2022 (Fig. 3). Therefore, promoting high-level education at a competitive power level, especially narrowing the gap among regions, is the key to solving the imbalance of China’s technological innovation.
Dynamic Evolution and Spatial Effect of Technological Innovation Level
Dynamic Evolution
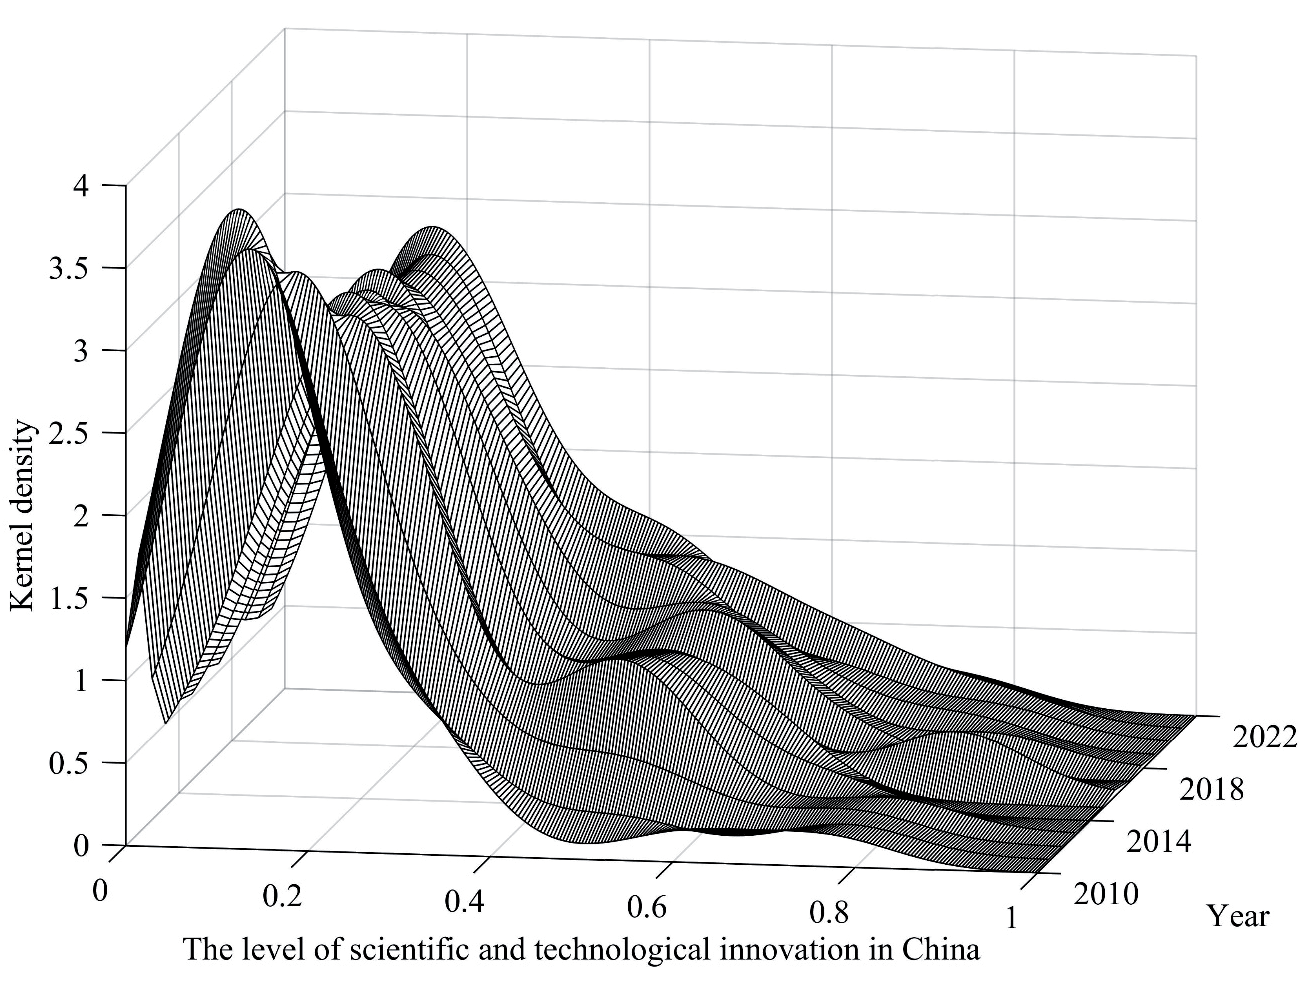
To discover dynamic features of China’s technological innovation level, the paper used kernel density estimation to analyze features, including distribution positions, morphology, extensibility, and polarization phenomena in three regions and China, respectively. Fig. 4 reports the dynamic evolution trend of the overall technological innovation level nationwide in the sample observation period. The key position and changes of distribution curves moved to the right, with right-tailing in curves, which meant each region’s technological innovation level increased gradually. The higher peak’s height and narrower peak’s width illustrated that the overall differences in China’s technological innovation level kept narrowing, but it was not very clear. The double-peak distribution pattern, including one main peak and one side peak, was shown in the curve distribution, which reflected polarization patterns and spatial imbalance in China’s technological innovation development.
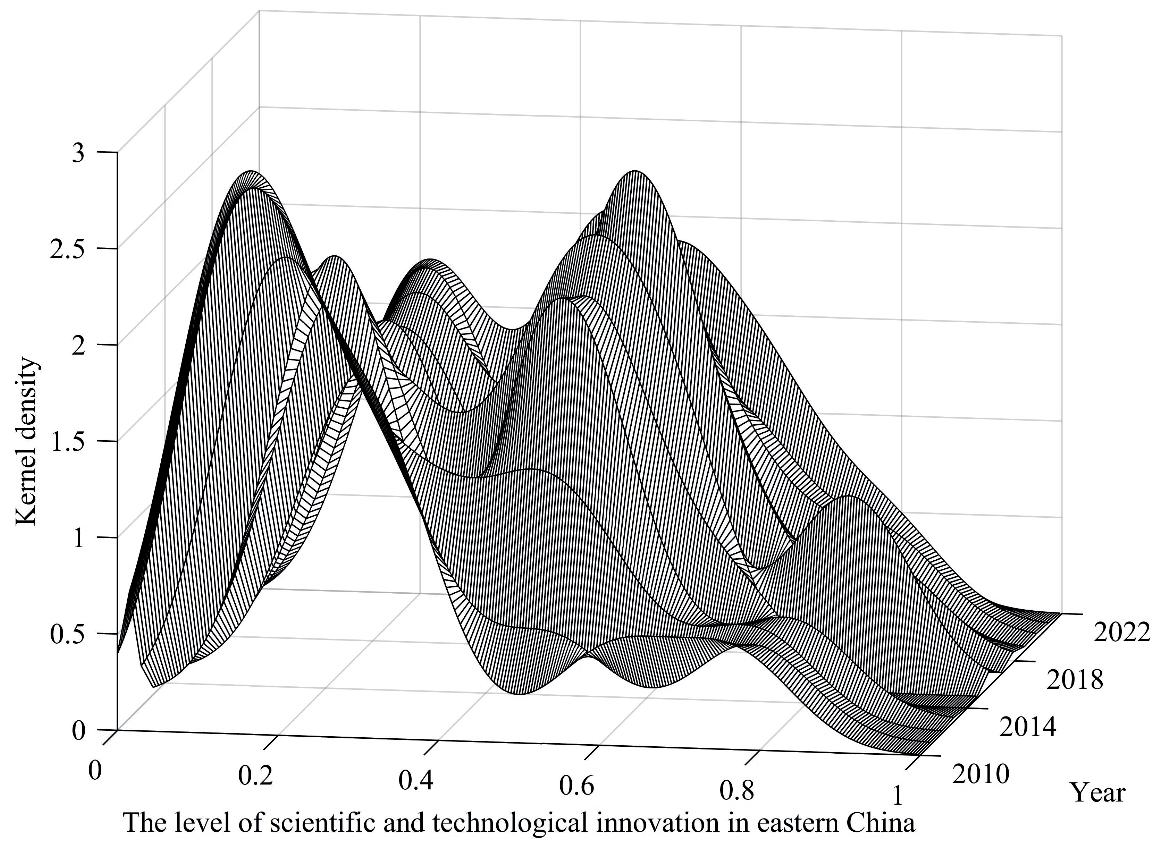
Fig. 5 reports the dynamic evolution trend of the eastern region’s technological innovation level in the sample observation period. The distribution position showed that each region’s technological innovation level in eastern China increased gradually. The main peak’s height fluctuated to decrease, and its width tended to narrow first and then become wider. Therefore, the overall differences in technological innovation level in the eastern region narrowed first and then enlarged gradually. Side peaks formed after 2014, meaning that a comparatively apparent polarization phenomenon occurred in the eastern region’s technological innovation level.
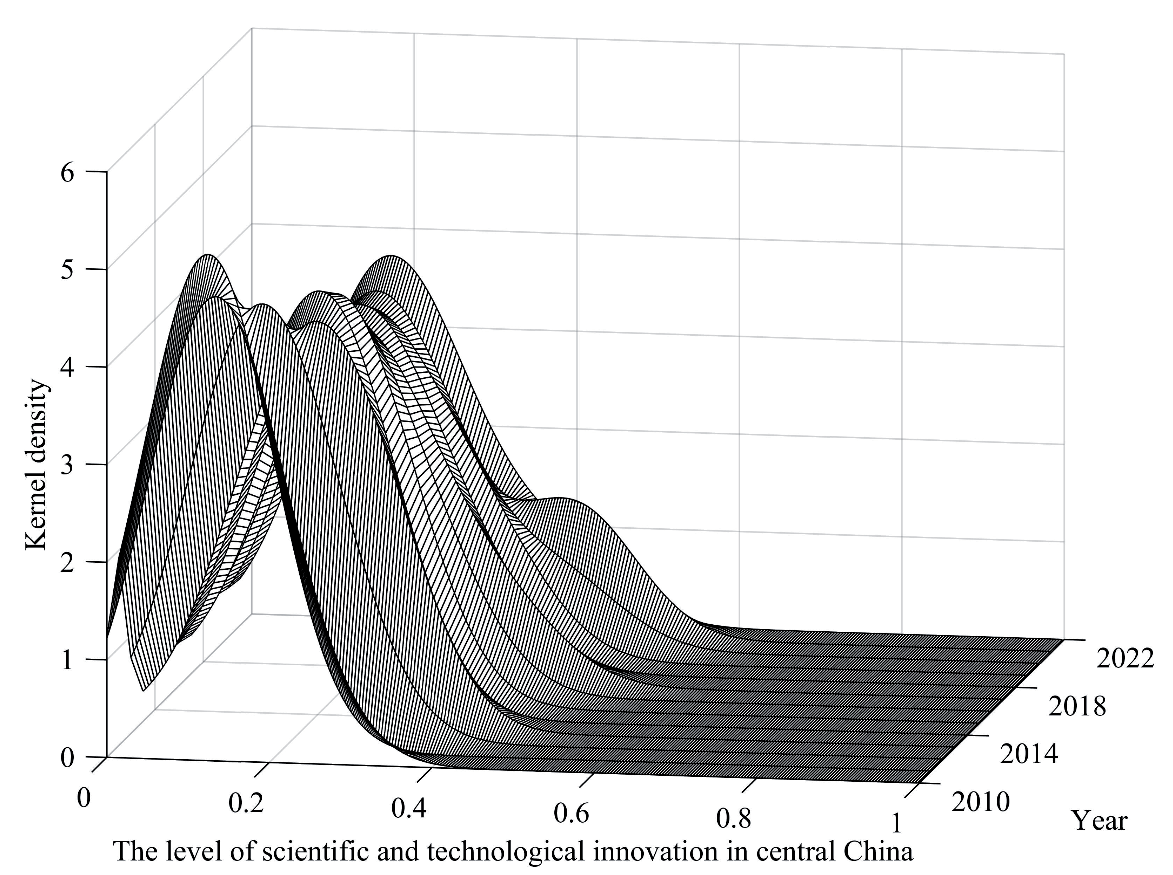
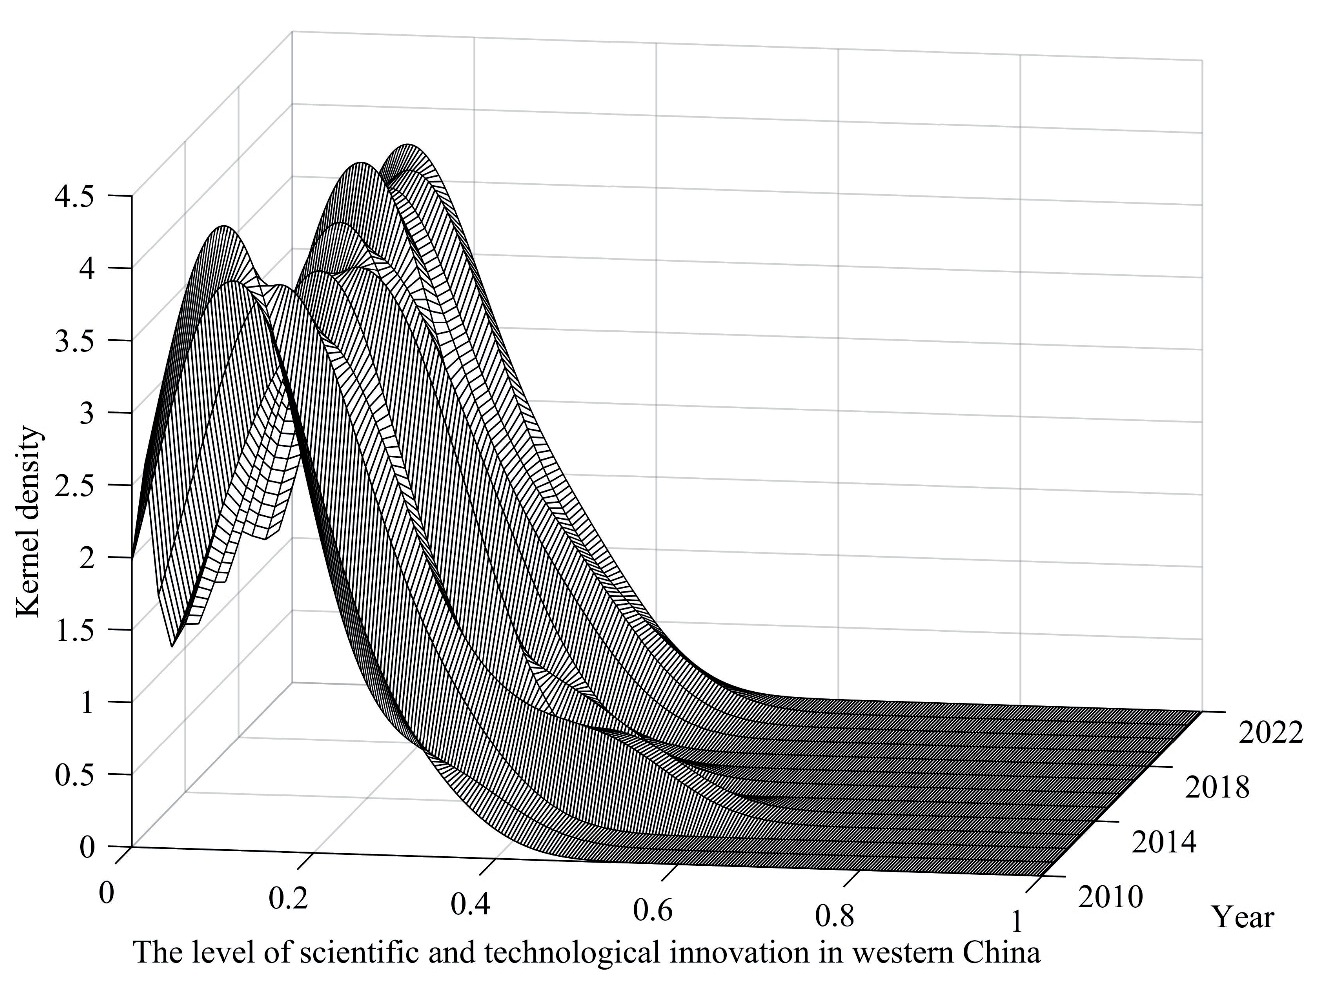
Fig. 6 reports the dynamic evolution trend of the central region’s technological innovation level in the sample observation period. The distribution of curves moved to the right in general, so technological innovation development in each region in central China increased gradually. Peak’s height increased gradually, and its width became narrower, so the overall differences of technological innovation in central regions had been narrowed. Furthermore, the distribution curves didn’t have apparent tailing, which meant the central region’s technological level was not the highest or the lowest. Fig. 7 reports the dynamic evolution trend of the western region’s technological innovation level in the sample observation period. The distribution of curves moved to the right in general, so technological innovation development in each region in western China increased gradually. The peak’s height decreased first and then rose, forming a V-shaped fluctuation. The width of the peak narrowed consistently, so the overall differences in technological innovation development level in western regions kept narrowing. Although there is a gap between the western and eastern regions in terms of economic aggregate, the ability to develop scientific and technological innovation has significantly improved in recent years through the state’s policy support and its own efforts. In particular, in some key cities and high-tech industrial parks, scientific and technological innovation activities have become increasingly active, and innovation capabilities have been continuously enhanced. The western region has also given full play to its advantages in resources, developed characteristic industries, and promoted the optimization and upgrading of industrial structure.
Spatial Correlation Analysis
Overall Spatial Pattern
According to Formula (22), GeoDa was used to calculate Moran’s I value of global spatial autocorrelation in China’s regions. Results showed that Moran’s I’s positive statistic value of Z was all over, passing the significance test. Fig. 8 shows that the value of Moran’s I was positive, and it became larger gradually, even though the total situation was smaller. This means that the level of technological innovation in various regions of China shows a significant positive spatial correlation. Meanwhile, the spatial distribution did not exhibit complete randomness but had a certain degree of spatial agglomeration and Matthew effect in space. It can be seen that the level of technological innovation in various regions is not only related to the spillover effects of neighboring regions but also influenced by their own technological innovation resources, industrial foundation, and institutional construction [22].
Partial Spatial Pattern
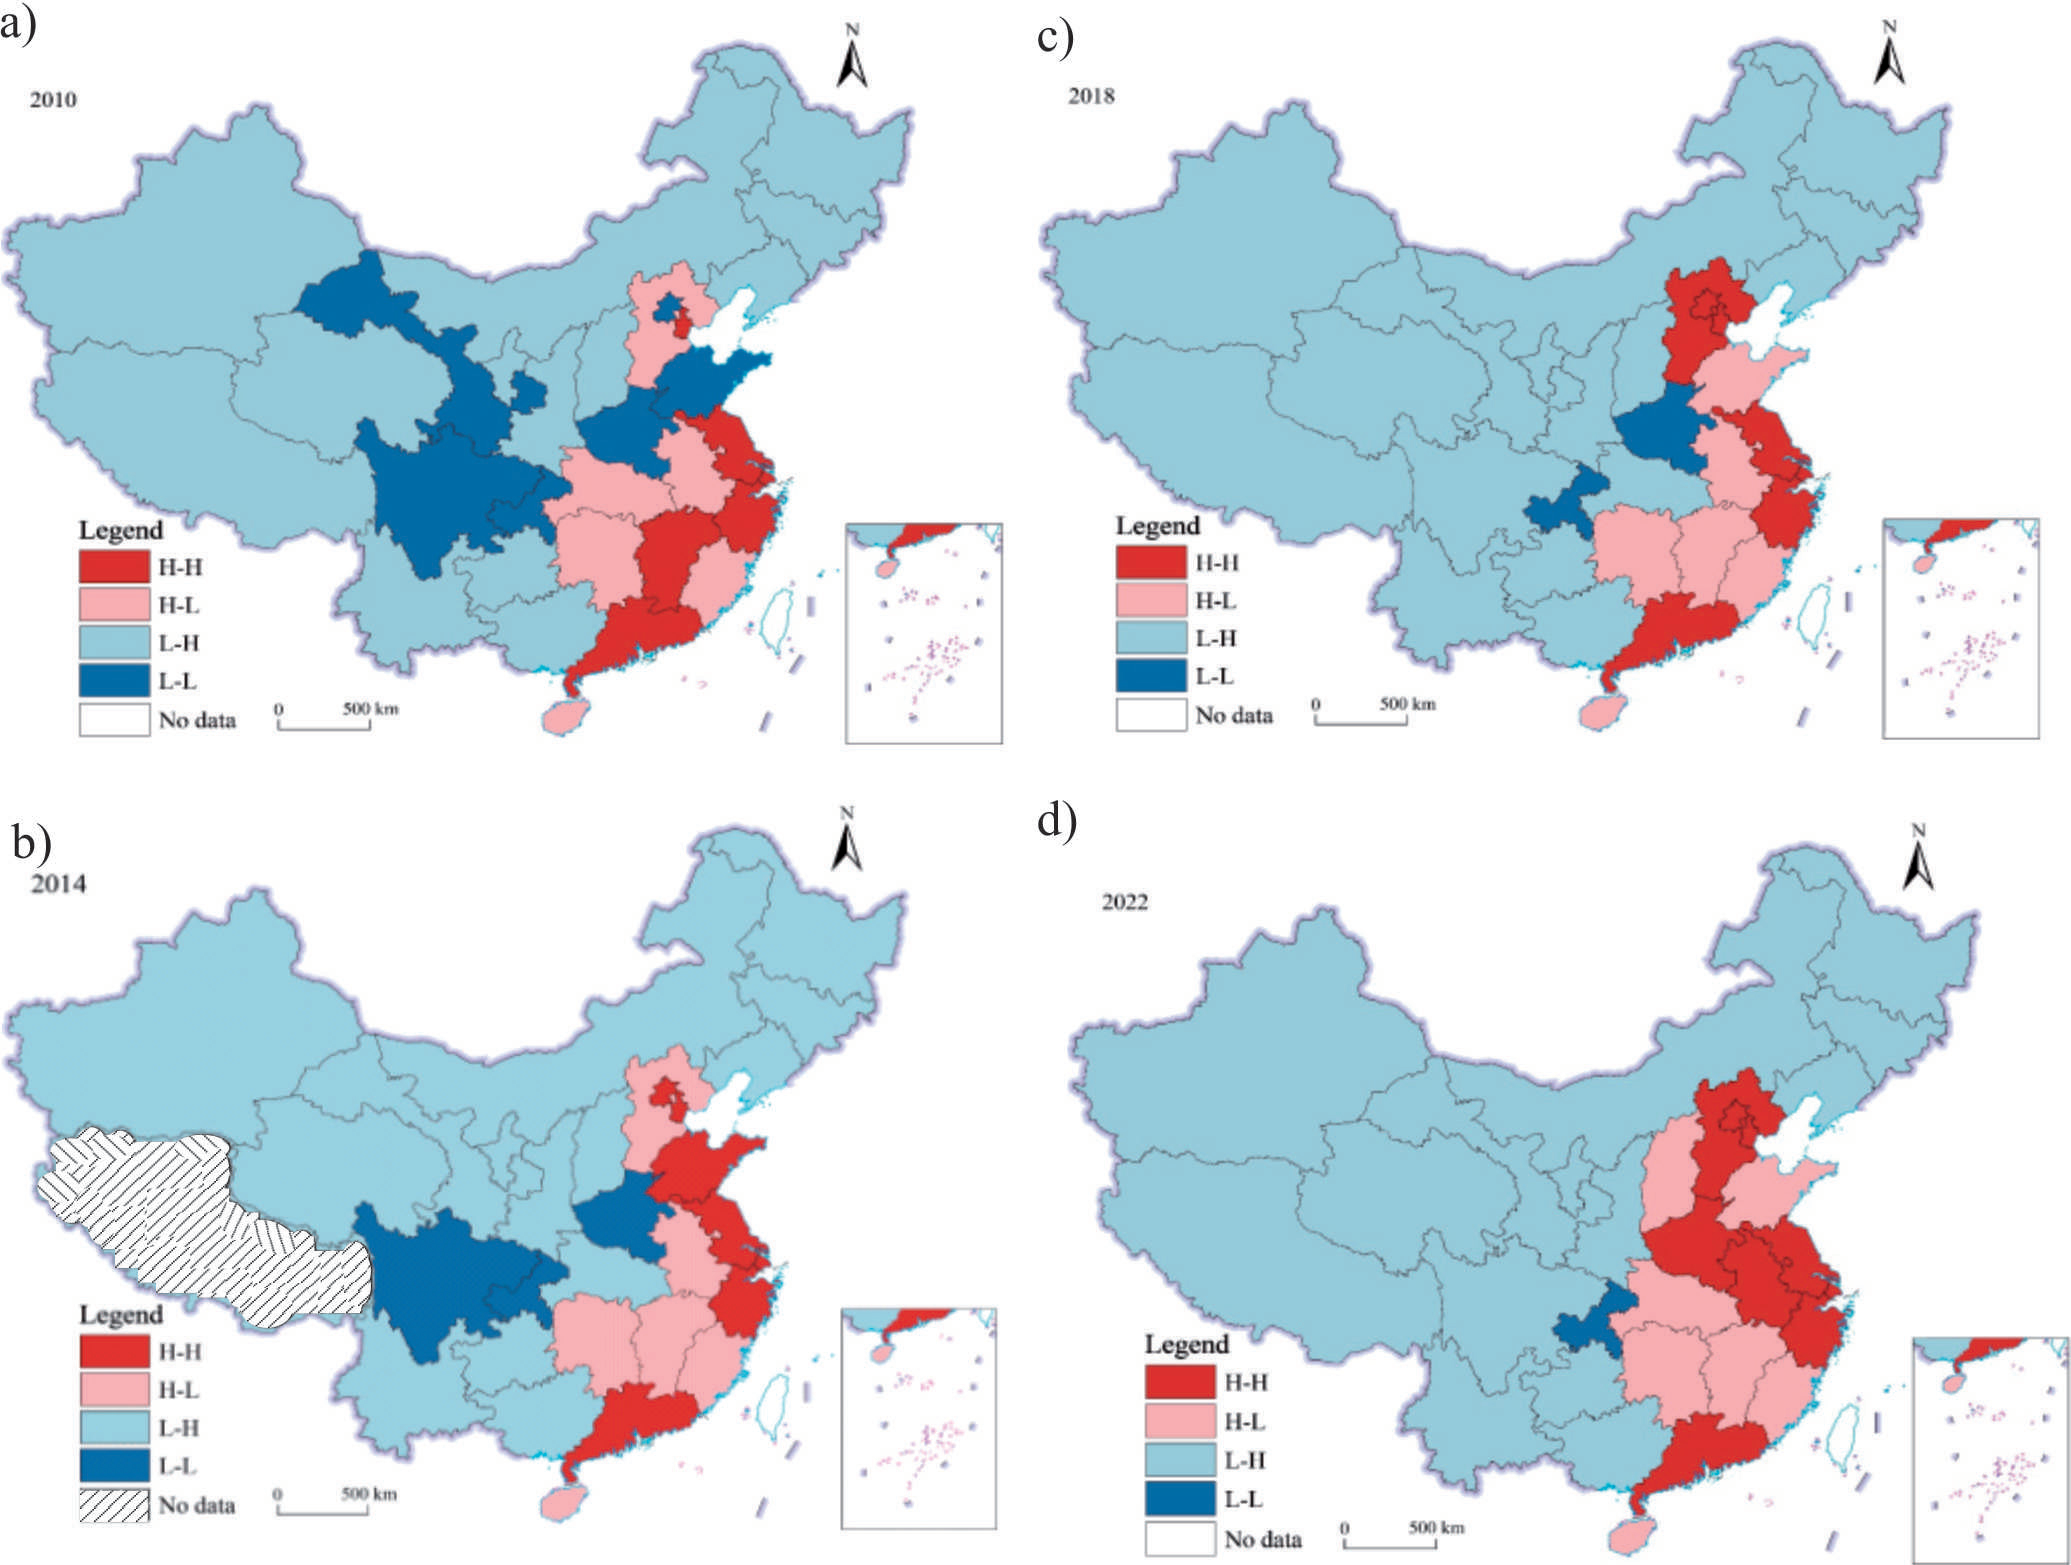
The study selected the years 2010, 2014, 2018, and 2022 as representatives by partial spatial autocorrelation analysis and visualized partial spatial autocorrelation analysis of technological innovation levels in different Chinese regions by ArcGIS to further explore correlations between gathering and space in China’s technological innovation level. Therefore, spatial evolution principles were illustrated more directly (Fig. 9).
Fig. 9.
LISA gathering map of China’ technological innovation level in different regions from 2010 to 2022. a) year 2010, b) year 2014, c) year 2018, d) year 2022.
Notes: The figure is based on the standard map (review number: GS (2020) 4632) on the National Bureau of Surveying, Mapping, and Geoinformation’s service website. The base map has not been modified.
According to Fig. 9, high-high gathering areas are mainly distributed in China’s Beijing-Tianjin-Hebei Urban Agglomeration, the Yangtze River Delta, etc. These areas had higher developed economic development levels in regions and adequately circulated production requirement elements related to technological innovation. They had a higher technological innovation level, so they had positive driving and promoting effects on the surrounding regions’ technological innovation development by spatial conduction effect, achieving technological innovation’s collaborative development between regions and adjacent areas. Most high-low gathering areas are in economically developed regions or main city regions. Their economic development and technological innovation had good coupling relations. Although they had a higher technological innovation level, due to the lower level in surrounding regions, part of the spatial pattern showed polarization. The low-high gathering area had a larger gap in its technological innovation level compared to the adjacent areas, so a sag feature occurred. In general, China’s technological innovation level’s partial spatial pattern was comparatively stable, with the change of “high-low-high-low”. There were larger differences in overall technological development level, without a clear trend to reverse [6-7].
Conclusions and Implications
The paper calculated the technological innovation level of China’s 30 provinces from 2010 to 2022 using the improved CRITIC and fuzzy matter-element analysis methods. Meanwhile, the Dagum Gini coefficient was used to analyze regional differences and sources of the technological innovation level. Eventually, kernel density estimation and exploratory spatial data analysis were used to study the dynamic evolution and spatial effects of the technological innovation level in China’s different regions. Research findings are as follows:
(1) The measurement results illustrated that China’s technological innovation level increased in general from 2010 to 2022, with an annual average rising rate of 4.51%. However, the level in general was still comparatively low, and only 1/3 of provinces reached the national average level, with larger differences among regions and obvious regional characteristics. China’s technological innovation level and rising rate illustrated the “low west and high central” feature.
(2) As for regional differences, the overall difference in technological innovation level decreased, and the main source was regional differences, with an average contribution rate of 62.82%. Differences mainly stem from differences among the three regions, and they increased with different ranges. Among these, the inner differences between the eastern and western regions had the smallest range. Besides, the eastern region-western region had the largest differences, followed by the central region-western region, and the eastern region-central region had the smallest difference.
(3) From the perspective of dynamic evolution’s trends, the central position and changes of overall distribution curves nationwide moved to the right gradually. The right tailing in curves showed that the technological innovation level in each region gradually increased, narrowing the overall gap, which meant polarization and imbalance in technological innovation development. The technological innovation level tended to be apparent polarization in the eastern region, while the gap of technological innovation development in the central and western regions was narrowing. In addition, there was an apparent spatial positive correlation between technological innovation levels in China’s regions.
In order to improve our country’s scientific and technological innovation level, narrow regional disparities, and promote comprehensive innovation reform, we should first establish a collaborative innovation system with differentiated functional positions in the east, middle, and west, based on the spatial characteristics of “low west, medium, and high west”, and design a differentiated collaborative governance framework for different regions. We will focus on breaking down the technological barriers between the East and West, perfecting the compensation system for cross-regional innovation factors, establishing a mechanism for sharing technological spillovers and benefits, and systematically reducing the imbalance of technological development between regions. For example, a “basic innovation cultivation belt” will be established in the west, focusing on improving the scientific research infrastructure network and relying on major national projects to cultivate unique technological capabilities; a “technology transformation demonstration zone” will be created in the central part of the country, giving full play to its location advantage of connecting the east and west, and building regional technology trading centers and industrial pilot bases; and a “cutting-edge innovation source” will be built in the east, focusing on constructing the national laboratory system and subversive technological innovation, forming a staggered development zone with the central and western parts of the country. In the east, it will build a “frontier innovation center” and focus on constructing a national laboratory system and disruptive technological innovation, thus forming a staggered development pattern with the central and western regions. In particular, it is necessary to establish a compensation mechanism for cross-regional technology transfer, realize the gradient transfer of technological potential through innovation enclaves, partner parks, and other modes, and establish a cross-regional cooperation mechanism.
Secondly, we can combine the spatial correlation characteristics of technological innovation levels to build a dynamic compensation mechanism for regions lagging in technological diffusion and regulate the spatial and temporal mismatch of innovation factors through tools such as flexible mobility policies for talents and trans-regional intellectual property rights trading markets. Simultaneously, we can promote the regional innovation resilience assessment system to enhance the endogenous development momentum of less developed regions.
Finally, in terms of national policy, we should promote the modernization of science and technology innovation governance systems and build a full-chain governance framework covering “difference diagnosis - policy design - effect evaluation”. Regional innovation disparity indicators should be incorporated into the assessment system of local governments to strengthen the pulling effect of national strategic scientific and technological forces on the coordinated development of the region and to realize the dual goals of upgrading the level of technological innovation and balanced spatial development.
Although the study focuses on measuring China’s technological innovation level and its characteristics of dynamic spatial evolution, the following research limitations still exist. For one thing, the analysis in the paper is based on panel data of 30 provinces in China, so the research scale is relative to the macro level. Studies in the future can select panel data at the municipal level to analyze, which stands as a more micro and complete position to analyze China’s technological innovation level with study units of cities. Moreover, the paper deeply analyzes China’s technological innovation level in various aspects, but the driving mechanism that causes the phenomenon can still be further studied. Therefore, a future driving mechanism model can be constructed to effectively explore the transmission path and effect mechanism among elements in the technological innovation system.

