

Introduction
With regard to economic progress, social stability, and environmental protection, green is a common concern worldwide, as well as a way forward and a wise choice [1]. In the context of increasing global emissions of pollutants, particularly greenhouse gases, green innovation can help to promote economic development while maintaining environmental sustainability [2]. It is apparent that promoting green innovation has become a necessary route to achieving high-quality development [3]. Due to the high risks normally associated with technological innovation [4], green innovation cannot be achieved without the support of a large number of scientific and technical personnel and financial resources. According to the National Bureau of Statistics of China, the intramural expenditure on R&D and the full-time equivalent of R&D personnel in China reached 3.078 trillion yuan and 6.354 million man-years in 2022, respectively. As for industrial enterprises above the designated size, the percentage of enterprises with R&D activities in the total number of enterprises was as high as 37.3% in 2022, much higher than the 13.7% experienced in 2012. Evidently, both the government and enterprises have consistently invested heavily in the process of promoting green innovation. Against this backdrop, China has made many world-renowned achievements, such as supercomputing and manned spaceflight [5].
The high-risk attributes of green innovation signify that innovative activities are prone to failure and that technological transformation and upgrade of enterprises are costly. Therefore, high investments are not necessarily meant to imply high productivity. Accordingly, green innovation efficiency (GIE) has gradually become one of the crucial points of concern in both academia and practice. From the perspective of environmental concerns, GIE generally refers to an innovation efficiency that considers environmental benefits and economic outputs [6, 7]. Similarly, in terms of the input-output perspective, GIE refers to obtaining optimal innovation achievements with minimal resource and environmental costs [3, 8]. That is, a relatively low GIE may facilitate technological progress and upgrading within the short term, but it certainly hinders green technological innovation and environmental sustainability in the long term.
China’s GIE is largely constrained by an excessive focus on economic benefits and a huge waste of resources in innovation activities. Additionally, the rigidity of technology innovation management regimes may also hinder the exploration of emerging and advanced technologies. In view of many external factors, such as the technology blockade from developed countries, China’s GIE to date is still relatively low [9, 10]. Based on this, accurately evaluating the GIE of each province in China has become an important prerequisite for grasping the current state of green innovation. Commonly, the influencing factors of GIE are multiple and complex, involving various aspects of social prosperity and economic development. Meanwhile, inter-provincial differences due to resource endowments are also an issue that the Chinese government needs to take fully into account. This implies that there may be spatiotemporal heterogeneity in the impacts of a specific variable on GIE. It is apparently inappropriate to adopt a one-size-fits-all policy for different provinces. Thus, this study is also beneficial to the formulation of China’s rational science and technology policies.
In summary, this paper addresses the following questions in light of the research gaps that exist in previous studies of China’s GIE: What is the current level of provincial GIE in China, with full consideration of economic, social, and environmental aspects? What kind of spatial and temporal evolution has China’s GIE experienced during the period of examination? Can the ranks of GIE in each province be transferred across ranks, and is this transfer related to the ranks of the surrounding provinces? For individual provinces, which factors have a positive and which have a negative impact on GIE, and does this vary from province to province?
Literature Review
In contrast to green innovation, which typically considers only the number of technological innovation outputs [11, 12], the evaluation of GIE is mainly concerned with the proportional relationship between green innovation inputs and outputs, i.e., efficiency [13, 14]. Among the input variables, labor and capital are the ones that have been fully considered by the most existing literature. For instance, Li [3], Song, and Han [15] employed human resources and financial investment as inputs. Besides, energy inputs are also significant input indicators considered by many scholars when measuring GIE. Proxies for energy inputs vary depending on the industry sector and the spatial scale of existing studies. Total energy consumption [8], total power supply [16], total electricity consumption [7, 17], and total gas supply [18] are the most commonly used proxy variables for energy inputs. On the methodological side, the data envelopment analysis (DEA) model is most popular when it comes to calculating relative efficiency [3]. However, traditional DEA models, such as the CCR-DEA model and the BCC-DEA model, have some shortcomings [19]. Specifically, these models ignore input and output slack variables and are unable to distinguish and compare the efficiency of the effective DMUs [3]. In this regard, Tone [20] and Tone [21] introduced the slacks-based measure (SBM) method and super-efficiency into traditional DEA models, respectively. Hence, the super efficiency SBM model has been widely applied to calculate GIE [6]. Additionally, as public concern regarding global environmental issues increases, the undesirable outputs are becoming a non-negligible part of the efficiency calculations. The outputs are categorized into desirable and undesirable outputs. In the calculation of GIE, desirable outputs consist mainly of economic benefits, and undesirable outputs mainly refer to environmental impacts and burdens caused by innovative activities. Undesirable outputs are commonly added to the calculation formula for GIE as part of the output [22]. However, there are still a few existing studies that calculate GIE by treating undesirable outputs as part of the inputs [23].
GIE involves input and output indicators that are multifaceted, and similarly, it is affected by many factors, including social, economic, political, geographic, and environmental [24]. For instance, theoretically, the urbanization level, which reflects the degree of social development, significantly promotes green technology innovation activities [25]. Economic development is closely linked to infrastructure, construction, and technological research and development [26], which is conducive to attracting a large number of innovative entities [27]. Additionally, the government’s governance, policy preferences, and decisions, such as policy support and fiscal decentralization, can also influence the effective improvement of GIE [7, 28]. Usually, local fiscal decentralization reflects the fiscal power of local governments, which in turn influences policy preferences. In economically developed regions, local fiscal decentralization may lead governments to pursue higher and faster short-term economic benefits at the expense of long-term environmental benefits, thereby suppressing GIE [28]. In addition, geographic factors are closely associated with a region’s resource endowments, such as land and energy, as well as industrial structure and agglomeration, which clearly affect GIE. Geographic spatial linkages between regions have also been one of the hotspots for scholars in recent years [24]. Besides, environmental regulations, such as environmental pollution, control investment, and pollution removal rate, also significantly affect GIE [8, 16]. In terms of methodology for impact effects, the spatial econometric model [3], panel threshold model [16], quadratic assignment procedures [24], fuzzy set qualitative comparative analysis [29], geographical weighted regression model [30], generalized method of moment, and moderating effect model [31] have been applied to empirically examine the impact of influencing factors on GIE. However, many of the results obtained from the above methodologies fail to distinguish among the heterogeneity of impacts in both temporal and spatial terms, yielding one-size-fits-all policies. This shortcoming affects regional policy preferences, which in turn affects GIE.
There are three potential contributions to this study in comparison to existing studies. First, this study fully considers both the quantity and quality of green innovation as output variables for measuring GIE. Specifically, the number of patent applications is employed to indicate the quantity of green innovation, while the number of green invention patent grants is adopted to indicate the quality of green innovation. Second, the spatial Markov chain model is applied to dynamically analyze the spatial evolution of GIE, whereas most of the existing studies mainly selected a few specific years for static analysis. Third, the traditional methods employed in the majority of existing studies yield the same regression coefficients for each spatial location and time point. The geographically and temporally weighted regression (GTWR) model applied in this study can capture the parameter variability of different spatial units in both temporal and spatial dimensions.
Materials and Methods
Data Sources
Considering the availability of data, we selected 30 provinces in China (excluding Xizang, Hong Kong, Macao, and Taiwan) as the research objects in this paper. The time frame of this study is 2011-2022. Eventually, a total of 360 samples will be included in this study. The raw data for input and output variables employed to calculate GIE were obtained from the China Statistical Yearbook, the Chinese Research Data Services Platform, the China Statistical Yearbook on Science and Technology, and the China Statistical Yearbook on Environment. In addition, GDP per capita, industrial structure, and import and export trade could be obtained by calculating the raw data from the China Statistical Yearbook. The digital financial inclusion index was released by the Institute of Digital Finance at Peking University and the Research Institute at Ant Group. R&D expenditure was obtained from the Communiqué on National Expenditures on S&T released by the National Bureau of Statistics of China. Besides, the marketization index was produced by the China Market Index Database. The descriptive statistics of the selected influencing factors are shown in Table 1.
Definition and Measurement of Variables
Explained Variable
The super-SBM undesirable model is employed to evaluate China’s GIE in this paper. The model involves 3 types of variables simultaneously: input variables, and desirable and undesirable output variables. Input variables mainly include labor, capital, and energy. Hence, in this paper, input variables include R&D expenditure, R&D personnel, and energy consumption. We select intramural expenditure on R&D (10000 yuan) to represent R&D expenditure and choose the full-time equivalent of R&D personnel (man-year) to denote R&D personnel. Also, electricity consumption (100 million kWh) is selected as a proxy for energy consumption. In addition, desirable output variables consist of 3 parts: patent applications, green patent grants, and sales revenue of new products, considering both quantity and quality. We choose domestic patent applications (piece), green invention patent grants (piece), and sales revenue of new products of industrial enterprises above the designated size (10000 yuan) as proxies for desirable outputs, respectively. Furthermore, undesirable output variables are composed of 3 parts: wastewater discharge, waste gas emissions, and solid waste generated. In this paper, the chemical oxygen demand discharge in wastewater (10000 tons), sulfur dioxide emissions in waste gas (10000 tons), and common industrial solid wastes generated (10000 tons) are chosen to represent the undesirable output variables.
Explanatory Variables
As mentioned previously, GIE is influenced by many factors from various aspects. Hence, considering the availability and applicability of data, referring to [15, 19, 22, 23, 32], we choose economic development, marketization level, industrial structure, digital economy, government financial support, and trade openness as the influencing factors and explore the heterogeneity of their effects on GIE from temporal and spatial perspectives. Specifically, GDP per capita (GDPPC, 10000 yuan) is selected as the proxy of economic development; the digital financial inclusion index (DFI) is applied to represent the digital economy. Besides, the proportion of R&D expenditure to GDP (RDE) is used to denote government financial support, and the marketization index (MI) is chosen to represent the marketization level. Moreover, the ratio of the output value of the tertiary industry to the output value of the secondary industry (INS) is used to measure industrial structure, and the proportion of total import and export trade in goods to GDP (IET) is applied to measure trade openness.
Research Methods
The Super-SBM Undesirable Model
The super-SBM undesirable model has been demonstrated to be superior to the traditional DEA models in many research areas. It takes into account both undesirable outputs and allows for more in-depth comparisons of effective DMUs. Hence, it was adopted to evaluate China’s GIE in this paper. Referring to [33], the super-SBM undesirable model can be constructed as follows:
(1)
where ρ represents China’s GIE. The parameter λ represents the constant vector. Besides, xjt, yjt, and bjt denotes inputs and desirable and undesirable outputs, respectively. In addition, m, l, and h represent the number of inputs, desirable outputs, and undesirable outputs, while smx, sly, and shb are the corresponding slack vectors, respectively.
Spatial Markov Chain Model
When exploring the distributional evolution of variables, as an extension of the traditional Markov chain model, the spatial Markov chain model can demonstrate the dynamic evolutionary characteristics of variables and explore spatial spillover effects [34]. Currently, the spatial Markov chain model has been widely employed in various academic fields, such as air pollution [35], urban health development efficiency [36], and urban resilience [37]. Hence, a spatial Markov chain model is used in this paper to explore the dynamic evolutionary characteristics of GIE. Besides, before executing the spatial Markov chain model, we first divided GIE into 5 levels based on the natural breaks (Jenks) method, i.e., the levels were employed to represent GIE of different provinces in different years. In the traditional Markov chain model, pij is usually used to denote the probability that this stage is in rank i, and the next stage transitions to rank j. Therefore, referring to Du et al. [34], pij(k) is used to represent the probability that this stage is in rank i, and the next stage transitions to rank j while the adjacent regions are in rank k at this stage. Moreover, the spatial weight matrix involved in the spatial Markov chain model is generated on the basis of the queen adjacency principle in this paper.
Geographically and Temporally Weighted Regression
Traditional econometric methods, such as geographically weighted regression and spatial econometric models, ignore the role of temporal or spatial factors in the analysis. In order to account for both temporal and spatial nonstationarity and to compensate for the shortcomings of traditional econometric methods, Huang et al. [38] proposed the GTWR model to analyze house prices. Currently, the GTWR model has been widely applied in the fields of environmental science [39, 40] and economic analysis [41, 42], etc., and has been demonstrated to be superior to other traditional econometric models. Thus, referring to Chen et al. [43], the GTWR model can be constructed as follows:
(2)
where ui, vi, and ti represent the longitude coordinate, latitude coordinate, and specific year, respectively; βi denotes the constant and regression coefficients, while εit is the error term.
Results and Discussion
Evaluation of China’s GIE
Evaluation Results of GIE
The super-SBM undesirable model is employed to evaluate each province’s GIE in China during 2011-2022 in this paper. The evaluation results of GIE in China by province are shown in Table 2. The lowest GIE was 0.137 in Inner Mongolia in 2011, while the highest GIE was 1.269 in Hainan in 2016. The latter is 9.263 times higher than the former, showing a very significant difference in GIE among provinces. In addition, GIE in most of the provinces does not show a consistent and clear trend, which fully illustrates the complexity of the evolution of GIE. This finding is consistent with Huang et al.’s [10] study that GIE in Hainan is almost always above 1.000, while the vast majority of China’s provinces have GIEs below 1.000, i.e., a state of inefficiency, and GIEs in less developed regions are relatively low.
Spatiotemporal Evolution of GIE
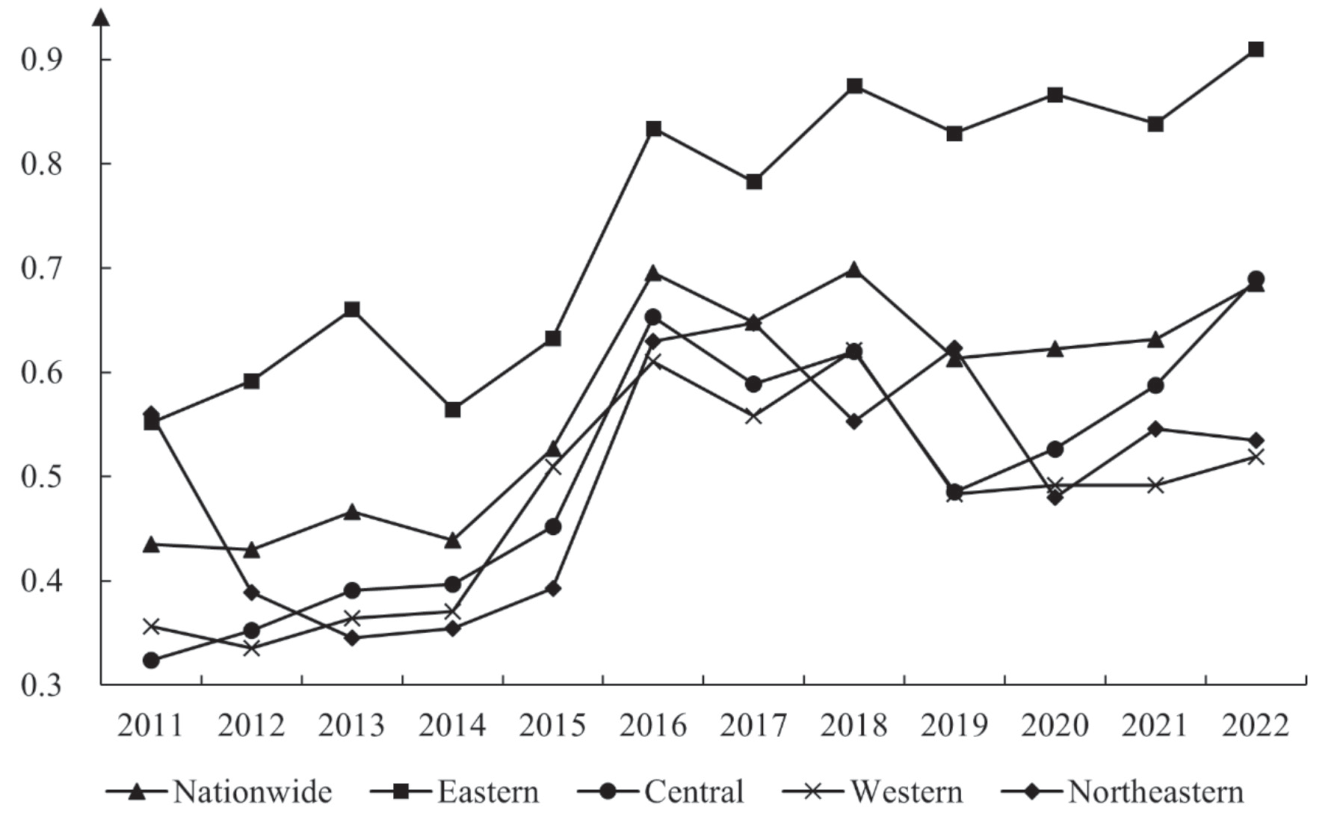
The temporal evolution of GIE in China by region is shown in Fig. 1. Ordinarily, China’s economic zones, which contain 31 provinces (excluding Hongkong, Macao, and Taiwan), can be divided into 4 regions: the eastern, central, western, and northeastern regions. The trends in the temporal evolution of the nationwide GIE and GIE in the individual regions remain highly consistent. For each region, the year 2016 is a critical juncture for significant changes in GIE. The nationwide GIE exhibits 3 distinct phases in the time dimension: 2011-2014, 2014-2016, and 2016-2022. GIE at these 3 phases successively shows a steady, sharp rise and fluctuating upward trend, respectively. In the long run, such a trend reflects the continued improvement of green innovation in China. This is consistent with the conclusions of Zhang et al. [25], which concluded that China’s GIE has generally shown an increasing trend through time. The temporal evolution of GIE in the western region is strongly characterized by similar characteristics as the nationwide GIE, but the former always remains at a relatively low level after 2019 and does not exceed 0.5 until 2022.
In the eastern region, GIE is consistently and significantly higher than GIE in other regions, except in 2011. This finding confirms the conclusions of Zhao et al.’s [14] study that the eastern region has the highest average GIE. This is due to the fact that the eastern region has the best economic base and the highest level of technology, as well as being a magnet for high-level talents from various regions. After 2016, GIE in the eastern region has been slowly and intermittently rising on the whole, and its dominance has become more pronounced, i.e. the phenomenon of the Matthew Effect has emerged. Additionally, the temporal evolution of GIE in the central region can be divided into 3 stages: 2011-2016, 2016-2019, and 2019-2022, with an accompanying rising-falling-rising characteristic. The economic base of the central region is second only to that of the eastern region, and it is also attractive to high-level technical talents. Simultaneously, the central region is endowed with abundant resources, such as minerals, and GIE may be further substantially enhanced in the process of industrial green transformation. Fig. 1 also shows the significant potential for the central region to increase its GIE beyond 2019, which is different from the slow rise in the western region. This finding is in contrast to that of Zhao et al. [14] who concluded that the difference in GIE between the central and western regions is decreasing. One possible explanation is that the latter only calculates GIE up to 2020, and the regional division criteria for China are not consistent with this paper. The temporal evolution characteristics of GIE in the northeastern region are more complex compared to other regions. GIE underwent a downward-upward trend with a clear U-shaped pattern before 2016. By contrast, after 2016, GIE in the northeastern region has trended downward with significant fluctuations. The mass outflow of advanced technicians from the northeastern region and the large number of highly polluting heavy industries have inhibited local green innovation.
From a spatial perspective, Hainan has the highest average GIE of 1.056, the only province in the country with a GIE that exceeds 1. Recently, Hainan has been capitalizing on its natural tropical monsoon oceanic climate and island advantages to develop tourism resources, reduce heavily polluting heavy industries, and enhance the advantages of technological innovation in terms of greenness and sustainability. As indicated in Table 2, the average GIE is followed by Tianjin, Zhejiang, Shanghai, and Beijing, with the former two exceeding 0.9 and the latter two exceeding 0.8. Of the 10 provinces in the eastern region, all 7 except Shandong, Fujian, and Hebei are ranked in the top 10 of GIE, which further confirms that GIE in the eastern region is much higher than in other regions as depicted in Fig. 1. Among the 10 provinces at the bottom of the rankings, Hebei belongs to the eastern region, Henan and Shanxi belong to the central region, Heilongjiang and Liaoning are from the northeastern region, while the other provinces are from the western region. The GIEs of these 10 provinces are below 0.45. The average GIE of Inner Mongolia is the lowest nationally, reaching only 0.261, accounting for only 24.716% of Hainan’s GIE. While Inner Mongolia’s average GIE is consistently the lowest nationwide until 2019, it is rising significantly, even surpassing 13 provinces to reach 0.518 in 2022.
Table 2.
The evaluation results of GIE in China by province.
Dynamic Evolutionary Characteristics of GIE
Traditional Markov Chain Model
The transition probability matrix of GIE based on the traditional Markov chain model is shown in Table 3. With the exception of those located at level 4, the GIEs of the provinces located at other levels in this stage remain stable, i.e., the probability of not experiencing a transition in the next stage exceeds 0.5. Provinces located at level 4 in this stage would jump to level 5 in the next stage with a probability of 0.591. Besides, there is a clear trend of upward transfer of level in the majority of provinces, but also a risk of level decline in some individual provinces, especially those whose GIE is at a high level at this stage. Overall, there is much more upward level transition than a downward level. Also, some of the transition probabilities away from the diagonal are not equal to zero, implying that there is a transition of GIE across levels in some provinces. This clearly provides a factual basis for those provinces that have taken appropriate measures with the expectation that GIE will be upward transfer across levels in the short term. Similar to this finding, the conclusions of the study by Xin et al. [44] confirm that green innovations across provinces stabilize to maintain the initial state. The difference, however, is that the latter confirms that there is no overstepping transfer in the level of green innovation in the provinces. This may be due to the fact that only four levels of provincial green innovation were categorized in Xin et al.’s [44] study.
Spatial Markov Chain Model
In comparison to the traditional Markov chain model, the spatial Markov chain model fully takes into account the spatial spillover effect due to geographic proximity and spatial lag conditions. In Table 4, the transition probability matrix of GIE is generated based on a spatial Markov chain model. Under different spatial lag conditions, the spatial Markov transition probability of GIE is different from the transition probability in Table 3, indicating that the transition probability of the level of GIE in the local region to the next stage is affected by the level of neighboring regions. Similarly, there are differences in the spatial Markov transition probabilities for GIEs at the same level under different spatial lag conditions. For instance, the probability that the local region has a GIE rating of level 2 and moves to level 3 in the next stage is 0.083, 0.146, 0.239, 0.077, and 0.000 for different spatial lag conditions, respectively. Additionally, in contrast to Table 3, there is still a high probability that a region’s GIE will remain at its original level or jump upwards after accounting for spatial factors. For instance, when GIE of the local region and neighboring regions are at the same level in the current stage, the probability that GIE of the local region would remain at the same level in the next stage is 0.742, 0.854, 0.621, 0.100, and 0.778, respectively. Also, the level of GIE in the local region is influenced by neighboring regions, and there are relatively few circumstances in which there is a jump across levels and a transition downward. In some regions, the probability of a downward shift in the level of the local region’s GIE is relatively high when adjacent to a province with a low level; conversely, the probability of an upward shift in the local region is also relatively high when adjacent to a province with a high level. The fact that the probability p23 (0.167) is less than p21(1) (0.250) and that p23(3) (0.239) is greater than p23 (0.167) proves this conclusion. To summarize, these findings confirm Xin et al.’s [44] conclusions that the state of China’s provincial green innovation is significantly influenced by geospatial patterns.
Table 3.
Traditional Markov transition probability matrix of GIE.
| pij | n | 1 | 2 | 3 | 4 | 5 |
|---|---|---|---|---|---|---|
| 1 | 62 | 0.645 | 0.339 | 0.000 | 0.000 | 0.016 |
| 2 | 120 | 0.050 | 0.775 | 0.167 | 0.000 | 0.008 |
| 3 | 65 | 0.000 | 0.123 | 0.569 | 0.108 | 0.200 |
| 4 | 22 | 0.000 | 0.046 | 0.136 | 0.227 | 0.591 |
| 5 | 61 | 0.000 | 0.033 | 0.115 | 0.197 | 0.655 |
Table 4.
Spatial Markov transition probability matrix of GIE.
Influences of Factors on China’s GIE
Overall Characteristics of Influences
The GTWR model is adopted to explore the spatiotemporal heterogeneity of influences from factors on China’s GIE in this paper. The GTWR model has the values of adjusted R2, AICc, and residual sum of squares of 0.817, -312.122, and 4.643, respectively, both of which are significantly superior to the global OLS regression, geographically weighted regression model, and temporally weighted regression model. In regression results on the basis of the GTWR model, there is a separate regression coefficient for each variable for each province at each time point. Table 5 depicts the descriptive statistics of regression coefficients based on the GTWR model. As shown in Table 5, in general, GDPPC, MI, and INS promoted GIE, while DFI, RDE, and IET inhibited GIE. In Table 5, the average of the regression coefficients of RDE on China’s GIE is -0.032, indicating a negative effect of the former on the latter. One possible explanation is the relatively great differences in economic development, infrastructure, and resource endowment among provinces, leading to differences in the impact of R&D expenditure on GIE. There are 8 provinces where RDE consistently shows a positive effect on GIE, which are Henan, Anhui, Jiangsu, Hebei, Shanxi, Shanghai, Zhejiang, and Shandong. In comparison, in other provinces, the impact of RDE on GIE is sometimes negative, and in 8 of them, it is consistently negative. Geographically, the 8 provinces in which RDE exhibits a positive effect are spatially closely connected, showing obvious clustering characteristics. The 8 provinces that are consistently negative are mainly located in the less economically developed regions, i.e., the northeastern and western regions of China. These findings are different from Li et al. [22], possibly because we embed both temporal and spatial factors in the regression model, which is clearly a more scientific and rational treatment. Indeed, there are also conclusions from many studies, such as Song et al. [19], that support the findings of this paper that there are significant regional differences in the impact of influencing factors on China’s provincial GIE. Therefore, an in-depth spatiotemporal heterogeneity analysis of impacts is necessary.
Table 5.
The descriptive statistics of regression coefficients based on GTWR model.
Temporal Heterogeneity of Influences
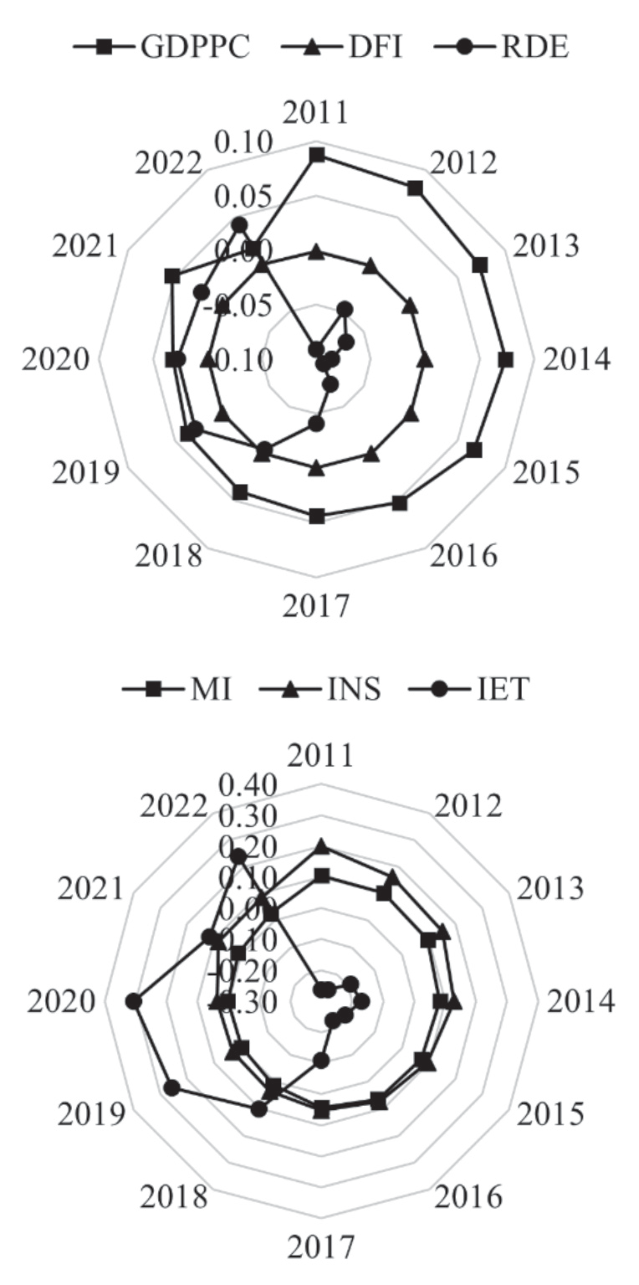
Fig. 2 displays the temporal heterogeneity of factors’ influences on China’s GIE. With the exception of 2021, the positive influence of GDPPC on GIE diminishes over time, from 0.087 in 2011 to 0.017 in 2022. Similarly, INS has consistently demonstrated a positive influence in any given year and has shown a V-shaped trend, with 2020 being the turning point. Moreover, with the exception of 2019, the impact of MI on GIE has also been consistently positive and shown a V-shaped trend. These results indicate that, on the one hand, the enhancement of the GIE is influenced by more and more factors, so that the influence of some traditional factors is gradually weakening. On the other hand, due to the impact of COVID-19 epidemiology, the marketization level and the tertiary sector are becoming increasingly critical to GIE.
Besides, the direction of DFI’s effect on GIE appears to alternate negatively and positively. However, the negative effect of DFI on GIE tends to be close to zero, implying a very weak causal relationship between DFI and GIE. This is different from the findings of Li et al. [22] for the reason that Li et al. [22] focused on analyzing the influence of the digital economy on the industrial GIE, whereas this study does not differentiate between industries. According to Liang et al. [24], the digital economy contributes to sustainable innovation, but the adequacy of the digital economy infrastructure significantly affects the full development of digital green innovation. Obviously, in China, the digital economy serves more as a crucial infrastructure to improve the efficiency of social operations and production, while its impact on advanced green technologies is minimal. This implies that China’s provinces need to continue to promote the digital economy in order to effectively realize its contribution to GIE in the future. In addition, in Table 5, while both RDE and IET show an overall negative impact on GIE, Fig. 2 displays that the impacts of both RDE and IET on GIE shift from negative to positive, with 2019 as the turning point for the former and 2018 for the latter. China’s continued investment in R&D in line with the current situation and the expansion of international exchanges and cooperation are effective ways to enhance GIE.
Spatial Heterogeneity of Influences
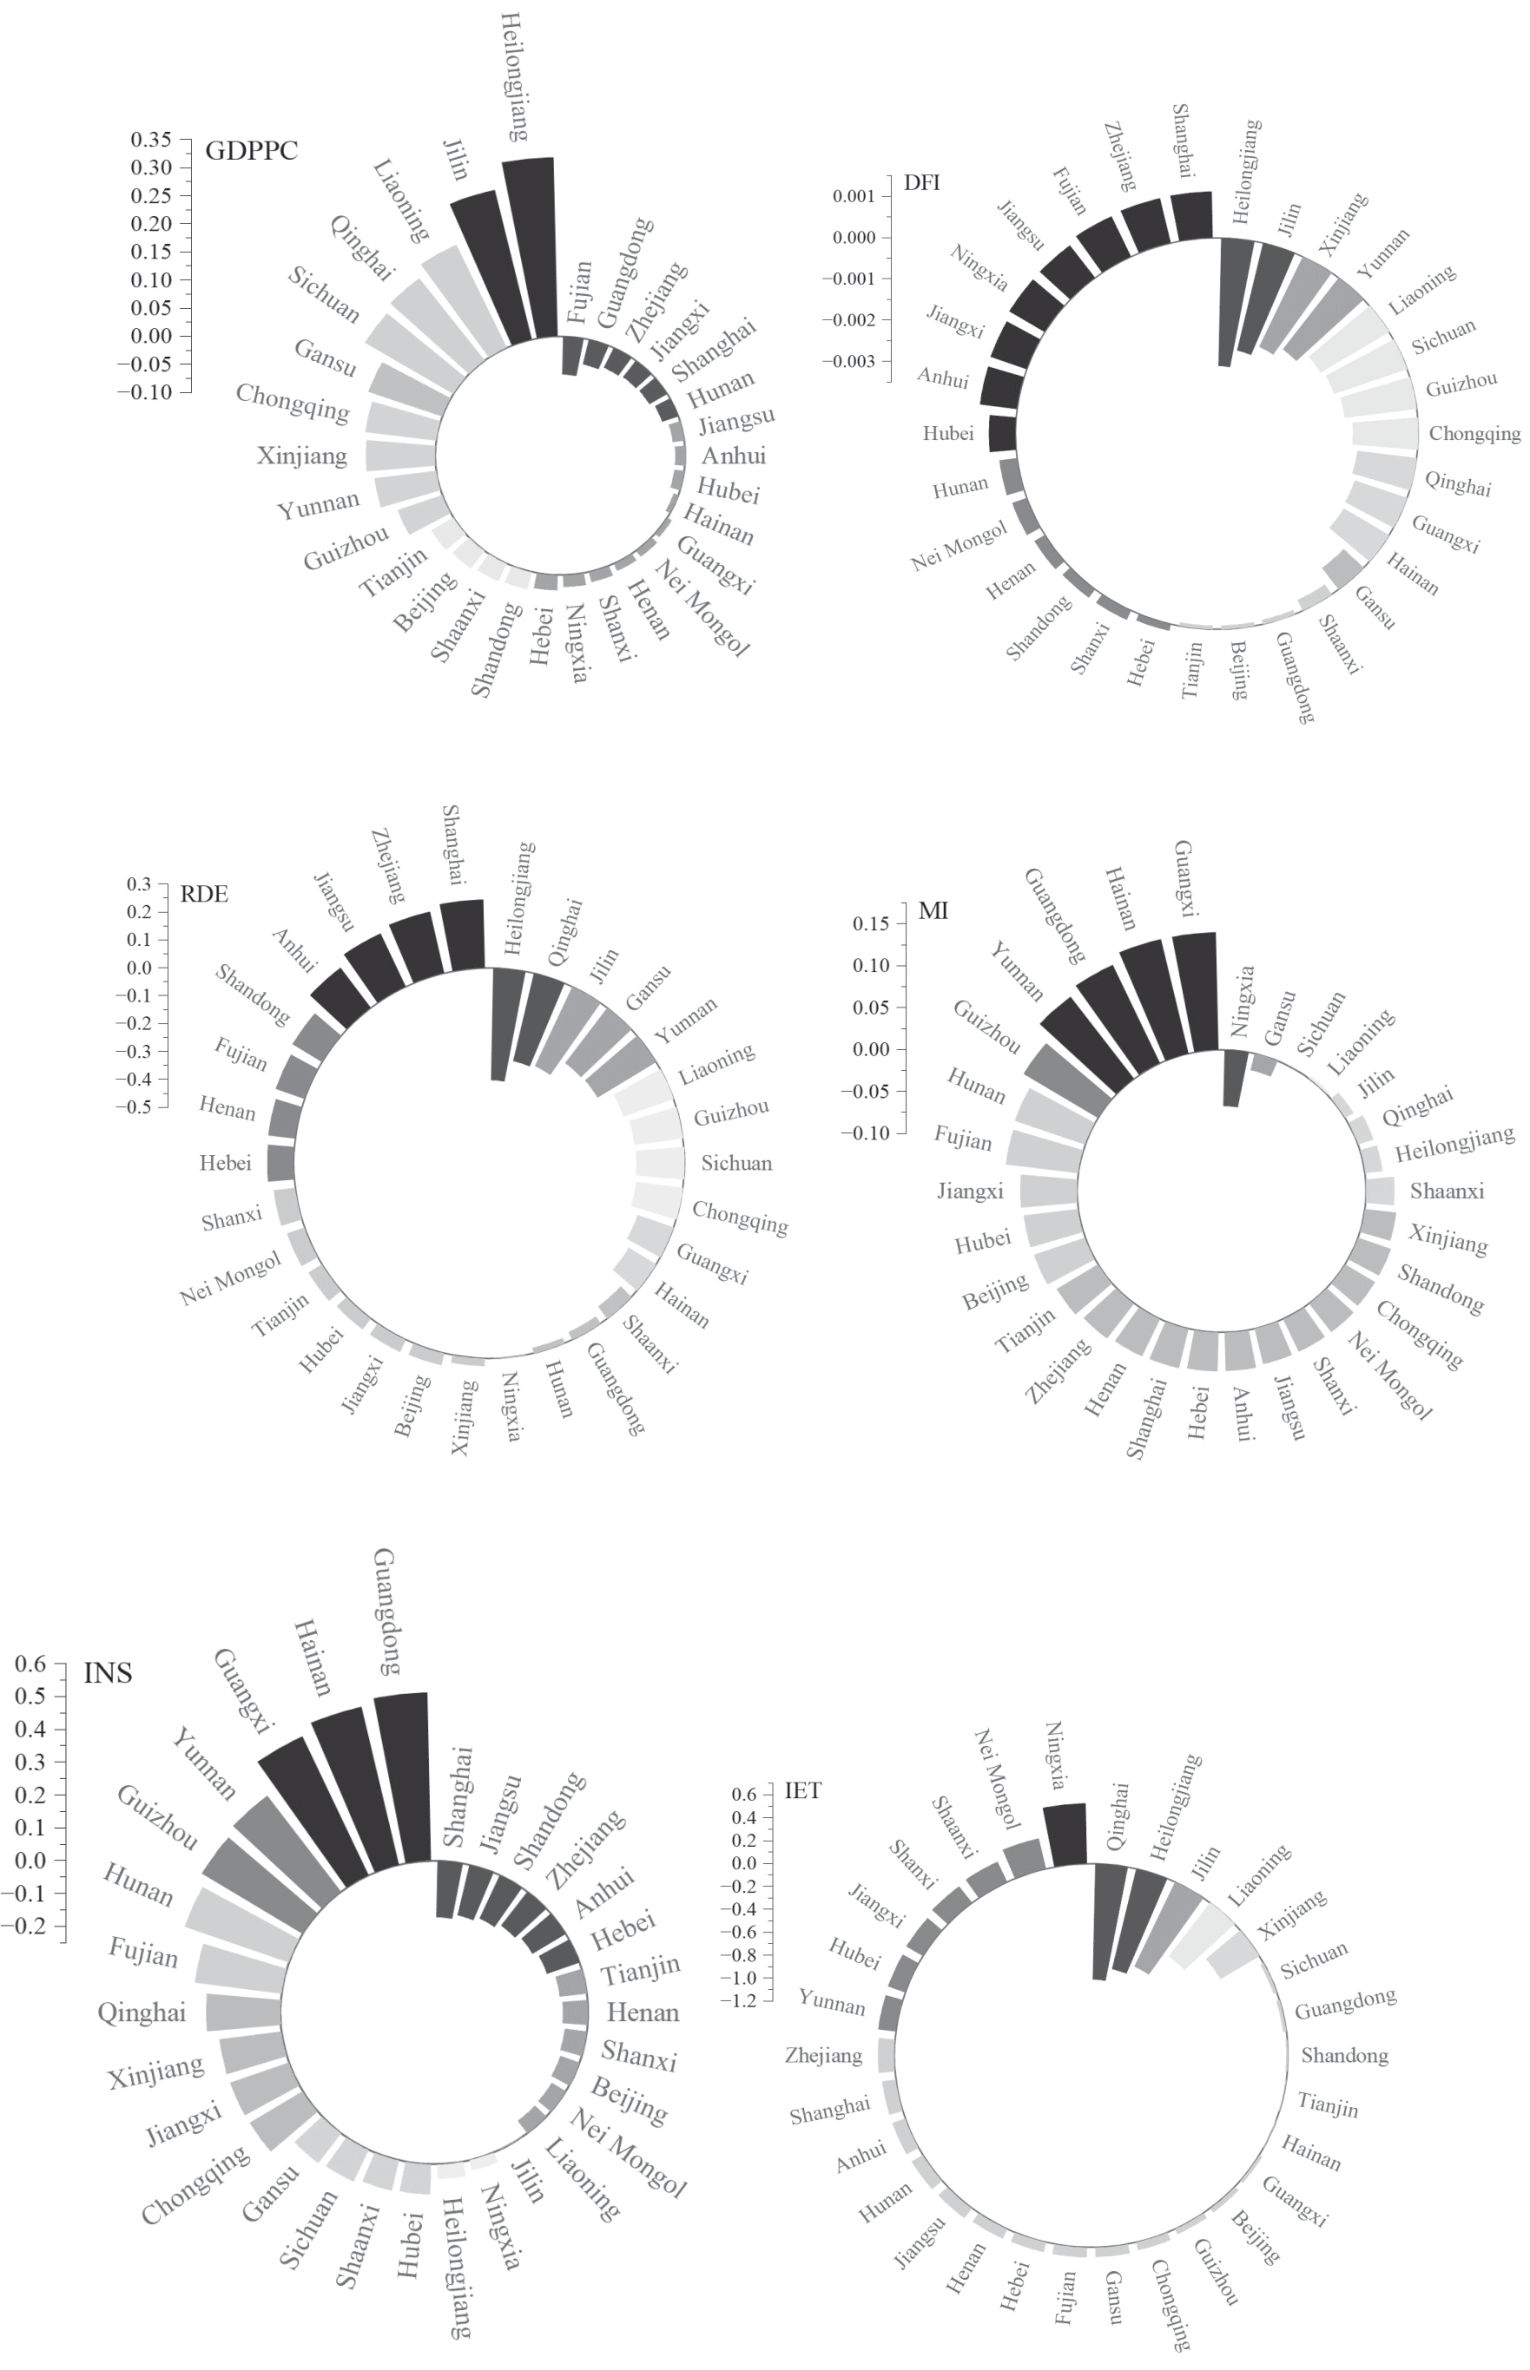
The spatial heterogeneity of factors’ influences on China’s GIE is illustrated in Fig. 3. The province with the largest positive effect of GDPPC on GIE is Heilongjiang, followed by Jilin and Liaoning, all located in the northeastern region. Other provinces with positive effects are mainly found in the west. In the eastern and central regions, where the economic development level is relatively high, GDPPC has a mainly negative effect on GIE. Indeed, the excessive pursuit of short-term economic benefits by local governments leads to development at the expense of environmental pollution and ecological damage, which ultimately inhibits GIE. Economically underdeveloped regions need to continue to develop economies, while other regions need to curb the excessive pursuit of economic benefits. In terms of spatial distribution, the direction of DFI’s impact on GIE is almost exactly opposite to that of GDPPC. The positive impact of DFI on GIE is mainly in the eastern and central regions, while the negative impact is mainly in the western and northeastern regions. Therefore, the western and northeastern regions need to strengthen and improve the infrastructure of the digital economy, so as to realize the role of the digital economy in the enhancement of GIE.
Similarly, the effect of RDE on GIE shows significant spatial heterogeneity. In the western and northeastern regions, RDE plays a predominantly negative role, while in other regions it plays a positive role. This suggests that the western and northeastern regions should improve the system of science and technology development and establish a good incentive mechanism to attract a large number of technical talents, high-tech enterprises, institutions of higher education, and other technological innovation subjects. As for other regions, it is imperative to continue to invest in R&D expenditure in order to sustain the important role of R&D in green technology innovation. As depicted in Fig. 3, MI positively contributes to GIE in all provinces except Ningxia, Gansu, and Sichuan. This provides a practical basis for local governments to enhance the development of product and factor markets and strengthen their linkages with markets.
The provinces with large positive contributions of INS to GIE are Guangdong, Hainan, and Guangxi, while the provinces with large negative contributions are Shanghai, Jiangsu, and Shandong. Most of the provinces where INS shows a negative impact on GIE are located in the eastern, central, and northeastern regions, while the western region mainly shows positive impacts. Hence, the northeastern region should take into account its natural environment and resource endowment and actively develop tourism resources, such as winter tourism programs, to reduce the long-term overdependence on the secondary industry. The eastern and central regions should also appropriately reduce highly polluting industries and improve the greenness and sustainability of technological innovation. In addition, the negative impact of IET on GIE is mainly found in Qinghai, the northeastern region, and Xinjiang, all of which are relatively remote regions that are weak in terms of import and export trade. Therefore, these provinces can take advantage of national-level development strategies, such as the Belt and Road Initiative, to strengthen international trade exchanges and cooperation.
Conclusions and Policy Recommendations
In this paper, we employed the super-SBM undesirable model to evaluate the GIE of 30 provinces in China from 2011 to 2022 and explored the dynamic evolutionary characteristics of GIE and the spatiotemporal heterogeneity of the influencing factors using the spatial Markov chain model and the GTWR model, respectively. The conclusions we draw are as follows: First, the eastern region has a critically higher GIE than the other regions, followed by the central region, while the western and northeastern regions are not noticeably different in GIE with alternating phenomena. There are also significant differences in the average GIE between provinces due to differences in infrastructure and resource endowments. In the long run, the GIE of each region has been rising in fluctuation. Second, the Markov transition probability of GIE considering spatial spillover effects and spatial lag conditions differs from traditional transition probability, indicating that the transition probability of GIE is affected by the level of neighboring regions. Particularly in some regions, the probability of GIE’s level decreasing is relatively high when adjacent to a province with a low level, and the probability of GIE’s level moving upward is also relatively high when adjacent to a province with a high level. Third, as a whole, GDPPC, MI, and INS promoted GIE, while DFI, RDE, and IET inhibited GIE. Simultaneously, there is significant spatiotemporal heterogeneity in the effects of individual factors on GIE. GDPPC’s positive impact on GIE diminishes over time, and the influences of both INS and MI on GIE show a V-shape trend in the time dimension. Besides, there is a very weak causal relationship between DFI and GIE, while the impacts of both RDE and IET on GIE shift from negative to positive.
In view of this, it is clear that a one-size-fits-all policy for GIE is highly unsuitable for the realities of individual provinces in China. Hence, based on the evolutionary dynamics of GIE in each province and the factors affecting it, we propose a number of targeted and differentiated policy recommendations that can be implemented. First, the governments have to take various measures to enhance the GIE of each province, which reflects the efficiency relationship between inputs and outputs. On the basis of ensuring the greenness and sustainability of technological innovation, it is necessary and feasible to appropriately reduce inputs or expand outputs. Thus, the governments can enhance GIE by attracting various types of innovative entities, sounding and improving the technological innovation system, concerning themselves with geospatial linkages with other provinces, and maintaining a good relationship with the market. Second, individual provinces, particularly those in the eastern and central regions, should not pursue short-term economic benefits in promoting economic development, but balance the relationship between economic development and environmental protection. These provinces can rely on their good economic foundation to realize the transformation and upgrading of their industrial structure and vigorously develop tertiary and high-tech industries. Third, the provinces in the western and northeastern regions need to facilitate the infrastructure construction of the digital economy and increase funding for R&D. The digital economy is the main economic form of the current society, while R&D funding is the financial support and an important source of green technology innovation. So, these provinces should fully utilize the advantages of the Internet to provide wider and more convenient financing services for technological innovation subjects than ever before. Fourth, remote provinces, such as those belonging to the northeastern region, should take full advantage of the Belt and Road Initiative to strengthen exchanges of talents and international trade cooperation, introduce advanced green technologies and advanced equipment from abroad, and ultimately realize imitation, digestion, and absorption.

